적요
As a first step of mapping genes conferring resistance to the brown planthopper, Nilaparvata lugens Stål, in Gayabyeo using a population derived from a cross between Gayabyeo and Taebaegbyeo, we performed the whole genome resequencing of these two Tongil-type rice varieties. The amount of raw sequence data was about 18.5X10⁹ bp and 17.9X10⁹ bp in Gayabyeo and Taebaegbyeo, respectively. After quality trimming and read mapping onto Nipponbare reference genome sequence, 9.3X10⁹ bp was mapped in Gayabyeo with mapping depth of 25.0X, and 9.5X10⁹ bp was mapped in Taebaegbyeo with mapping depth of 25.5X. Between Gayabyeo and Nipponbare, 1,585,880 SNPs were detected, while 1,416,898 SNPs were detected between Taebaegbyeo and Nipponbare. Between Gayabyeo and Taebaegbyeo, 284,501 SNPs were detected. Among the SNPs between Gayabyeo and Taebaegbyeo, 21.2% were in genic region and 78.8% were in intergenic region. In CDS region, 15,924 SNPs were detected, among which synonymous SNPs covered 47.3% and non-synonymous SNPs covered 52.7%. We designed Cleaved Amplified Polymorphic Sequences (CAPS) markers with SNPs in the restriction enzyme recognition sites, and 20 CAPS markers were tested. Of the 20 markers, 19 markers showed polymorphism and one marker showed monomorphism between Gayabyeo and Taebaegbyeo. It is expected that sufficient DNA markers for mapping genes with a population derived from a cross between Gayabyeo and Taebaegbyeo can be developed based on the results of the study.
서 언
차세대시퀀싱(NGS) 기술에 의한 지난 십년간의 유전체 혁명 은 생물체의 유전적 구성에 대한 이해를 크게 진전시켰으며, 식물육종에 있어서 새로운 혁명을 초래하고 있다(
Barabaschi et al. 2016,
Perez-de-Castro et al. 2012). 현재 NGS를 이용한 작물 유전체의 해독과 재해석(resequencing), 전사체 분석, 전장 유전체연관분석(GWAS), 후성유전체 분석, 유전체 선발 (genomic selection) 등이 활발히 수행되고 있다.
특히, NGS에 의한 유전체재해석(resequencing)은 진화 분석, 구조유전체 및 기능유전체 연구에 효율적으로 이용되고 있으며, 유전형과 표현형 사이의 관계를 구명하고 분자육종을 촉진하는 데 매우 유익하다(
Guo et al. 2014). 진화 분석의 한 예로, 446종 의 야생벼와 1,083종의 재배벼가 resequencing됨으로써 자포니 카벼가 먼저 중국 남부의 Pearl River 유역에서 야생벼로부터 순화되었고, 이후에 동남아시아로 퍼진 자포니카벼와 이 지역의 야생벼와의 교배에 의해 인디카벼가 분화되었음이 추정되었다 (
Huang et al. 2012). 한편, 돌연변이 계통과 원품종과의 교배 후대 F2 집단에서 돌연변이형을 가진 개체들의 DNA-bulk를 resequencing함으로써 변이유전자를 분리하는 MutMap 또는 MutMap-Gap 방법이 개발되었다(
Abe et al. 2012,
Takagi et al. 2013b). 그리고, 중국의 연구진들은 PA64s/93-11, 93-11/Ni pponbare, Zenshan97/Minhhui63 교배 후대 RIL 집단을 resequ encing함으로써 고밀도유전지도를 작성하고 수량성과 관련된 다수의 QTL들을 발견하였다(
Gao et al. 2013,
Wang et al. 2011,
Xie et al. 2010). 또한, 교배후대 집단에서 양 극단의 표현형을 보이는 20-50 개체들의 DNA-bulk를 resequencing함 으로써 주동 QTL을 신속히 탐색하는 QTL-seq 방법이 개발되었 다(
Takagi et al. 2013a). 최근에는 3000 rice genome project에 의해서 3000개의 벼 품종들이 평균 14x coverage로 resequencin g되었으며 약 20백만개의 SNP가 탐지되었고, SNP-Seek 데이 터베이스(
http://www.oryzasnp.org/iric-portal/)에서 이들 SNP 데이터를 검색하고 이용할 수 있게 되었다(
Alexandrov et al. 2015). 유전자원의 resequencing을 활용한 전장유전체연관분석 (GWAS)은 작물의 농업형질과 관련된 유전자들을 분리하는데 강력한 도구이며, 일본의 연구진은 유전적으로 구조화되거나 상호연관되어 있지 않은 일본에서 육성된 176개 벼 품종을 대상 으로 GWAS를 수행하여 출수기, 초장, 이삭길이, 이삭 수에 관련된 새로운 유전자 4개를 분리하였다(
Yano et al. 2016).
소수의 벼 품종들을 높은 coverage로 resequencing함으로써 각 품종의 유전적 구조를 상세히 구명하거나 품종간 SNP들을 대량으로 탐색하는 연구들이 있어왔다. 인산부족 조건에 내성을 가진 벼 품종인 Dular와 감수성 품종인 PB1이 resequencing되 어 두 품종간에 2,442,979개의 DNA 다형성이 탐지되었는데, 이 중 약 86%가 SNP이었고 약 14%가 InDel이었으며, 인산농도 에 반응하는 유전자들 중 1,731개의 유전자에 18,872개의 SNP 와 4,271개의 InDel이 있었다(
Mehra et al. 2015). 일본의 Koshihikari 품종이 resequencing되어 Nipponbare 대비 67,051 개의 SNP가 탐지되었으며(
Yamamoto et al. 2010), 일본의 sake 양조용 벼 재래종인 Omachi에서는 Nipponbare 대비 132,462 개의 SNP와 35,766개의 InDel이 탐지되었다(
Arai-Kichise et al. 2014). 화영벼 및 동진벼와 화영벼 유래 약배양 계통들이 resequencing되어 각 품종 또는 계통에서 Nipponbare 대비 170,961–253,530개의 DNA 다형성이 탐지되었다(
Jeong et al. 2013). 주남벼와 남평벼가 resequencing되어 두 품종간 352,478 개의 SNP와 45,645개의 InDel이 탐지되었다(
Jeong et al. 2015). 한국 녹색혁명의 발단이 된 통일벼와 통일벼의 모본인 Yukara, IR8, TN1을 resequencing한 결과, 통일벼 유전체의 91.8%가 인디카 모본으로부터 유래되었고, 7.9%가 자포니카 모본으로부터 유래되었음이 밝혀졌다(
Kim et al. 2014).
통일형 벼 품종인 가야벼는 국내에서 수집된 다양한 벼멸구 집단에 대하여 안정적인 저항성을 보였다(
Seo et al. 2009). 이 연구에서는 가야벼의 벼멸구 저항성 유전자를 mapping하기 위한 선행연구로서 가야벼와 벼멸구 감수성 통일형 품종인 태백 벼를 resequencing하여 두 품종간의 SNP를 탐색하였다. 이 연구 결과는 가야벼와 태백벼간 교배 후대 집단을 이용한 가야벼의 벼멸구 저항성 유전자 mapping 및 유전자 분리에 활용될 것이다.
재료 및 방법
DNA 추출 및 sequencing
국내에서 육성된 통일형 벼 품종인 태백벼와 가야벼의 genomic DNA를 DNeasy Plant Maxi kit (QIAGEN)를 이용하 여 추출하였다. 태백벼와 가야벼 종자를 50% 락스 용액으로 30분간 소독 후 멸균수로 3회 씻은 후 MS 배지에 치상하여 2주간 무균조건에서 키운 식물체 10 개체의 엽초와 잎부분을 채취하여 이로부터 DNA를 추출하였다. 차세대시퀀싱(NGS)를 수행하기 위해 제조사(Illumina)의 프로토콜에 따라 genomic DNA로부터 paired-end library를 만들어 Hiseq2000(Illumina) 장비로 염기서열분석을 수행하였다. 이로써 생산된 최초의 염기 서열 read들은 모두 101 bp 길이로 되어 있었으며, Quality trimming 절차를 통해 Phred Quality 값이 Q20 미만인 부분을 제거하였다. Q20 값은 99%의 정확도를 의미한다. Quality trimming 이후 남은 길이가 90 bp 이상인 read들만을 이후의 분석에 사용하였다.
염기서열 read mapping 및 SNP 탐색
벼 표준 유전체서열은 RAP-DB(The Rice Annotation Project Database,
http://rapdb.dna.affrc.go.jp/)에 있는 Nipponbare IR GSP-1.0 sequence(
http://rapdb.dna.affrc.go.jp/download/irgsp1.html)로 하였다. 주로 CLC Assembly Cell 프로그램(ver. 3.2.2,
http://www.clcbio.com)을 사용하여 가야벼와 태백벼의 NGS 염기서열들(reads)의 표준유전체서열에 대한 mapping과 SNP 탐색을 수행하였다. 이 과정에서 clc_mapper 명령어를 사용하여 read mapping을 수행하였는데, 이 때 옵션 값을 similar ity 95%, matched length fraction 1.0, repeat ignore로 설정하여 각 read의 전체 영역이 match되면서 염기서열 유사도가 95% 이상인 서열만을 선별하고 반복서열들은 제외되도록 하였다. clc_find_variations 명령어를 사용하여 각 품종들의 Nipponbar e 대비 SNP들의 목록을 추출하였다. 이후의 분석은 자체로 작성 한 Python 프로그램을 사용하였는데, 먼저 sequencing error에 의한 mismatch를 배제하기 위해 mapping depth가 10 이상인 SNP만을 추출하였다. 태백벼-Nipponbare 비교에 의한 SNP 파일과 가야벼-Nipponbare 비교에 의한 SNP 파일을 비교 분석 하여 태백벼와 가야벼간 SNP 목록을 추출하였다. RAP-DB에 있는 annotation 정보를 이용하여 각 SNP의 위치 영역을 interge nic, 5’ UTR, CDS, intron, 3’UTR로 구분하고, CDS에 위치한 SNP인 경우 아미노산 변화를 일으키는 non-synonymous SNP 인지, 아미노산 변화를 일으키지 않는 synonymous SNP인지를 구분하였다. 또한, 탐지된 SNP들 가운데 제한효소 인식부위에 있는 SNP들을 추출하고 각 SNP 전후 염기서열 500bp씩을 추출하여 Cleaved Amplified Polymorphic Sequences (CAPS) 마커 디자인에 사용하였다. 이 때 프라이머 디자인은 BatchPrim er3 1.0(
http://probes.pw.usda.gov/batchprimer3/)을 사용하여 수행하였다. PCR 산물을 제한효소로 37°C에서 8시간 이상 절단 한 후 1.2% 아가로스젤에서 전기영동하였다.
결과 및 고찰
sequencing과 Nipponbare 표준 유전체 서열에 대한 read mapping
가야벼와 태백벼를 Illumina Hiseq 2000 장비로 sequencing 하여 생산된 데이터양은, 가야벼에서 약 183X10
6 read에 약 18.5X10
9 bp의 염기서열이었으며, 태백벼에서 약 178X10
6 read 에 약 17.9X10
9 bp의 염기서열이었다(Table
1). Quality trimming 이후에 남은 데이터는 가야벼에서 약 153X10
6 read에 약 15.2X10
9 bp의 염기서열이었으며, 태백벼에서 약 147X10
6 read에 약 14.6X10
9 bp의 염기서열이었다(Table
1). 이 read들 을 Nipponbare 표준 유전체 서열에 mapping한 결과 가야벼에서 약 94X10
6 read에 약 9.3X10
9 bp의 염기서열이 mapping되어 약 25.0X의 mapping depth를 나타내었으며, 태백벼에서 약 96X10
6 read에 약 9.5X10
9 bp의 염기서열이 mapping되어 약 25.5X의 mapping depth를 나타내었다(Table
2). Nipponbare 표준 유전체 서열(373.2 Mbp)에서 3X 이상의 depth로 mapping 된 염기서열은 가야벼에서 302.6 Mbp로 81.1%에 해당하였으 며, 태백벼에서 304.5 Mbp로 81.6%에 해당하였다(Table
2).
Table 1.Summary of sequencing data amount
Table 1.
|
raw sequencing data
|
after quality trimming (Q20)
|
|
# of reads |
nucleotide (bp) |
# of reads |
nucleotide (bp) |
sequencing depth (X) |
|
|
Gayabyeo |
182,855,058 |
18,468,360,858 |
153,416,451 |
15,166,994,505 |
40.6 |
|
Taebaegbyeo |
177,692,578 |
17,946,950,378 |
147,454,952 |
14,573,120,428 |
39.0 |
Table 2.Summary of read mapping onto Nipponbare reference genome
Table 2.
|
mapping depth
|
coverage
|
|
# of mapped read |
# of mapped nucleotide (bp) |
average mapping depth (X) |
# of 3+ sitesz)
|
% of 3+ sitesy)
|
|
|
Gayabyeo |
94,283,586 |
9,326,183,654 |
25.0 |
302,568,387 |
81.1 |
|
Taebaegbyeo |
96,048,051 |
9,498,947,051 |
25.5 |
304,501,717 |
81.6 |
단일염기서열변이(SNP) 탐색
가야벼-Nipponbare 비교에서 총 1,585,880 개의 SNP가 탐지 되었으며, 1번 염색체에서 195,568개로 가장 많았고, 5번 염색체 에서 87,759개로 가장 적었다(Table
3). 태백벼-Nipponbare 비교에서 총 1,416,898 개의 SNP가 탐지되었으며, 1번 염색체에 서 185,708개로 가장 많았고, 5번 염색체에서 72,242개로 가장 적었다. 염색체별 분포경향에 있어서, 가야벼-Nipponbare SNP 분포경향과 태백벼-Nipponbare SNP 분포경향이 매우 유사하 였다. 가야벼-태백벼 비교시에 총 284,501개의 SNP가 탐지되었 으며, 4번 염색체에서 49,475개로 가장 많았고, 6번 염색체에서 3,875개로 가장 적었다(Table
3). SNP 밀도는 1 kb 당 가야벼와 Nipponbare 간에 4.25개 이었고, 태백벼와 Nipponbare 간에 3.80개 이었으며, 가야벼와 태백벼간에는 이들보다 훨씬 적은 0.76개이었다. 통일형 벼 품종의 원조인 통일벼와 Nipponbare 간에는 2,141,991개의 SNP들이 탐지되었다(
Kim et al. 2014). 한편, 일반형 벼 품종인 주남벼와 Nipponbare 간에는 260,710개 의 SNP들이 탐지되었고, 남평벼와 Nipponbare 간에는 230,215 개의 SNP들이 탐지되었다(
Jeong et al. 2015). 가야벼와 태백벼 에서 Nipponbare 대비 SNP가 통일벼보다 약 56만-73만개 적었 지만 주남벼와 남평벼보다는 116만-136만개 많았기에, 가야벼 와 태백벼가 일반형 벼 품종들보다 통일벼에 더 유사한 Nipponbare 대비 SNP 분포를 가지고 있음을 추정할 수 있다.
Table 3.No. of detected SNPs on chromosomes.
Table 3.
|
Chromosome |
comparison pair
|
|
Gayabyeo-Nipponbare |
Taebaegbyeo-Nipponbare |
Gayabyeo-Taebaegbyeo |
|
|
1 |
195,568 |
185,708 |
20,108 |
|
2 |
164,529 |
150,873 |
15,116 |
|
3 |
164,529 |
137,729 |
27,580 |
|
4 |
136,637 |
115,782 |
49,475 |
|
5 |
87,759 |
72,242 |
39,790 |
|
6 |
130,516 |
117,683 |
3,875 |
|
7 |
127,402 |
112,579 |
13,294 |
|
8 |
117,211 |
101,110 |
15,129 |
|
9 |
103,864 |
90,948 |
15,904 |
|
10 |
118,276 |
108,488 |
13,211 |
|
11 |
126,752 |
121,783 |
21,468 |
|
12 |
112,837 |
101,973 |
49,551 |
|
Total |
1,585,880 |
1,416,898 |
284,501 |
|
SNP densityz)
|
4.25 |
3.80 |
0.76 |
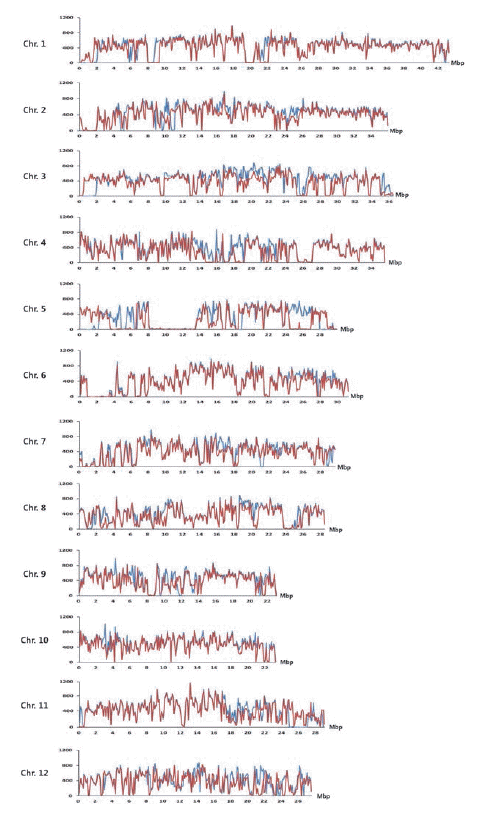
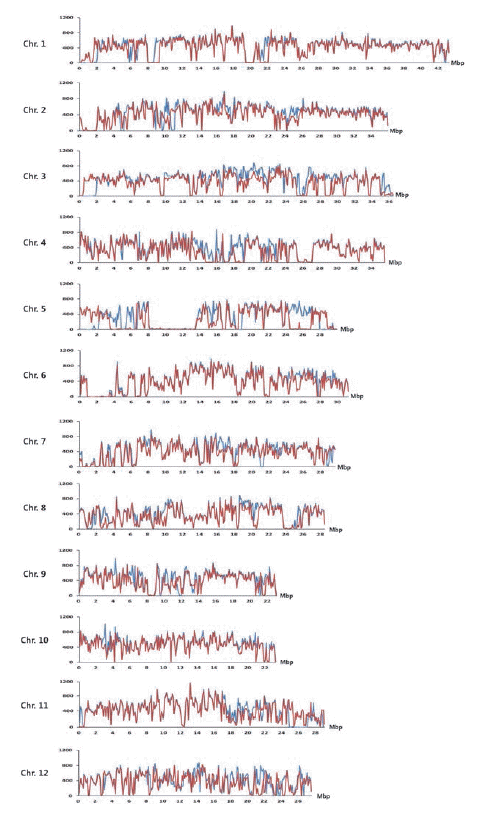
가야벼-Nipponbare SNP와 태백벼-Nipponbare SNP에 대해 서, 각 염색체 상에서 100 kb 구간별로 탐지된 SNP들의 빈도분 포를 Fig.
1에 나타내었다. 대부분의 구간에서 가야벼 -Nipponbare SNP와 태백벼-Nipponbare SNP가 100 kb당 50개 이상으로 많이 존재하였다. 반면, 5번 염색체 8.2-13.5 Mb 구간 과 6번 염색체 1.0-3.4 Mbp 구간에서 가야벼-Nipponbare SNP 와 태백벼-Nipponbare SNP가 모두 적었다. 가야벼-Nipponbare SNP가 태백벼-Nipponbare SNP보다 많은 경향을 보인 구간들 은 4번 염색체 13.4-16.3 Mbp, 5번 염색체 3.6-6.3 Mbp 및 24.5-26.9 Mbp, 11번 염색체 0-0.4 Mbp, 12번 염색체 21.1-22.1 Mbp이었다. 한편, 태백벼-Nipponbare SNP가 가야벼 -Nipponbare SNP보다 많은 경향을 보인 구간들은 1번 염색체 0-2.1 Mbp, 2번 염색체 0-0.8 Mbp, 3번 염색체 0-2.0 Mbp, 5번 염색체 0-2.2 Mbp 이었다.
Fig. 1.Distribution of SNPs between Gayabyeo and Nipponbare and SNPs between Taebaegbyeo and Nipponbare per 100kb in the 12 rice chromosomes. The x-axis represents the physical distance along each chromosome in mega base-pair (Mbp) unit. The y-axis indicates the number of DNA polymorphisms. The blue line represents frequency of SNPs between Gayabyeo and Nipponbare, and the red line represents frequency of SNPs between Taebaegbyeo and Nipponbare.
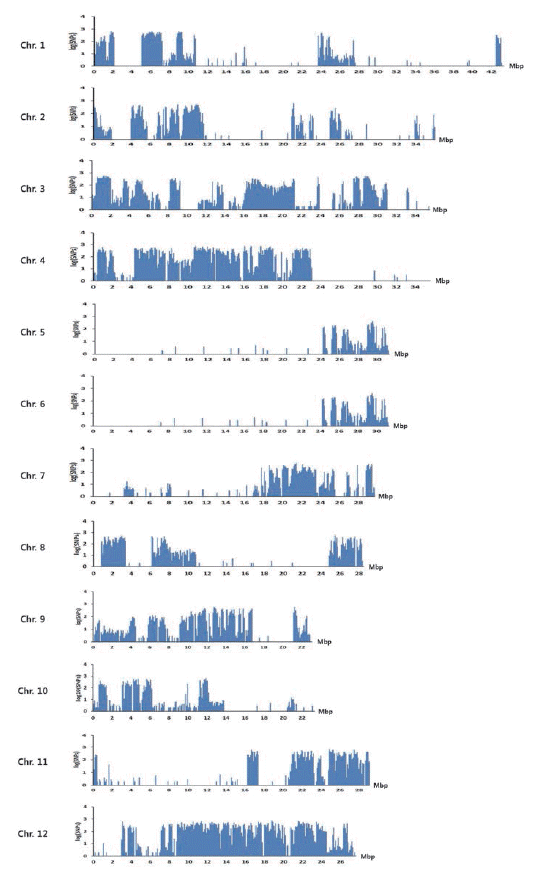
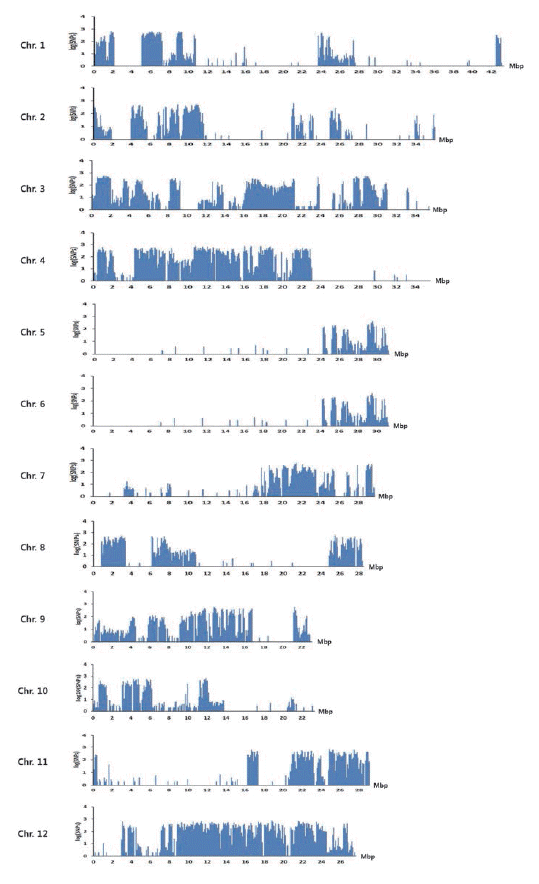
가야벼-태백벼 SNP들에 대하여 각 염색체 상에서 100 kb 구간별 빈도분포를 Fig.
2에 나타내었다. SNP 빈도가 높은 영역 들과 낮은 영역들이 있었는데, 12번 염색체에서는 거의 모든 영역에서 SNP 빈도가 높은 반면, 6번 염색체에서는 0-24.2 Mbp 의 광범위한 영역에서 SNP 빈도가 낮았다. 빈도의 차이가 있지 만 SNP가 광범위하게 존재하고 있기 때문에 가야벼와 태백벼간 교배후대 집단에서 유전지도를 작성하는데 필요한 SNP 마커들 을 충분히 개발할 수 있을 것으로 판단되었다.
Fig. 2.Distribution of SNPs between Gayabyeo and Taebaegbyeo per 100kb in the 12 rice chromosomes. The x-axis represents the physical distance along each chromosome in mega base-pair (Mbp) unit. The y-axis indicates the common logarithm of the number of SNPs.
SNP annotation과 CAPS 마커 개발
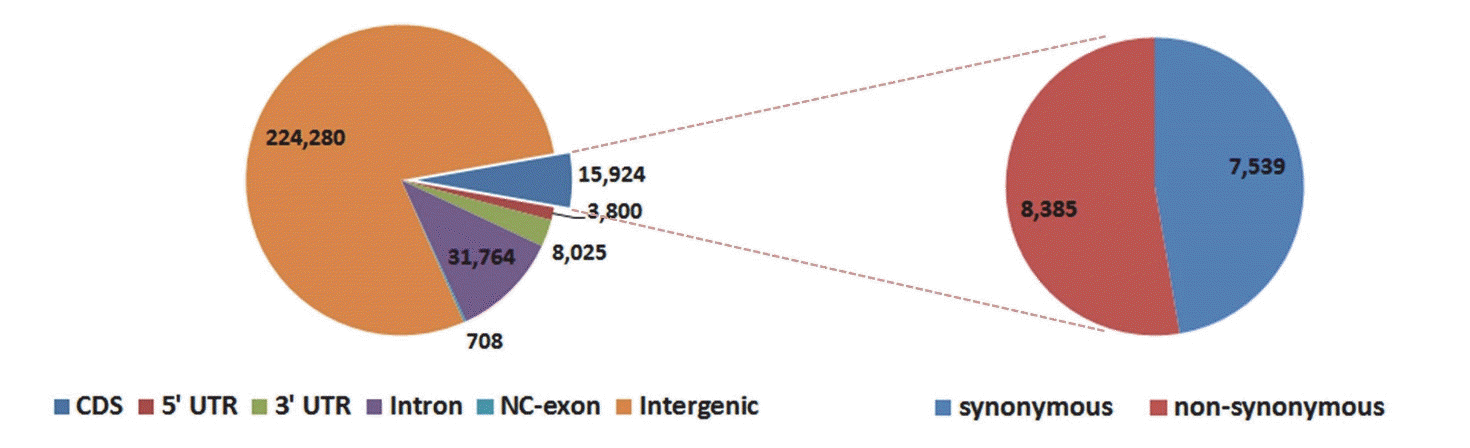
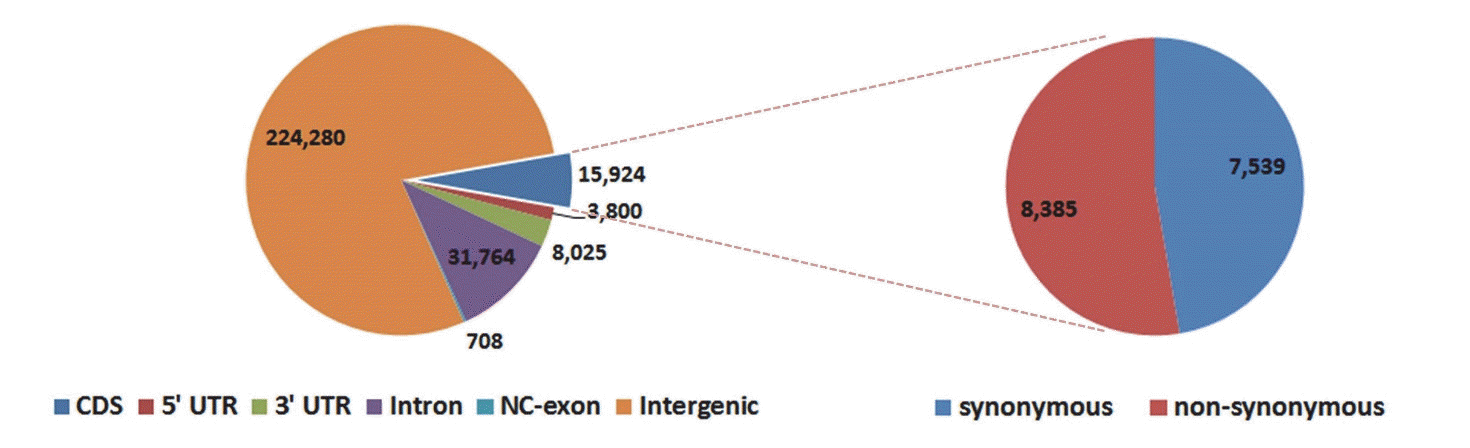
RAP-DB의 annotation 정보를 이용하여 가야벼와 태백벼간 SNP들의 annotation을 수행하였다. 총 284,501 개의 SNP들 가운데, 60,221(21.2%) 개의 SNP들이 유전자 영역에 있었고, 224,280(78.8%) 개의 SNP가 비유전자 영역에 있었다(Fig.
3). 유전자 영역에 있는 SNP들 가운데 단백질 코딩 영역(CDS)에 있는 SNP들은 15,924개이었으며, 인트론 영역에는 31,764개, 5’ UTR 영역에는 3,800개, 3’ UTR 영역에는 8,025개, 단백질을 코딩하지 않는 기타 엑손(exon) 부위에는 708개의 SNP들이 있었다. 단백질 코딩 영역(CDS)에 있는 15,924 개의 SNP들 가운데 synonymous SNP들은 7,539개로 47.3%를 차지하였으 며, non-synonymous SNP들은 8,385개로 52.7%를 차지하였다 (Fig.
3).
Fig. 3.Annotations of DNA polymorphisms between Gayabyeo and Taebaegbyeo. Nipponbare IRGSP 1.0 reference annotation was used for annotation. The number in each class is shown. NC-exon indicates non-coding exon.
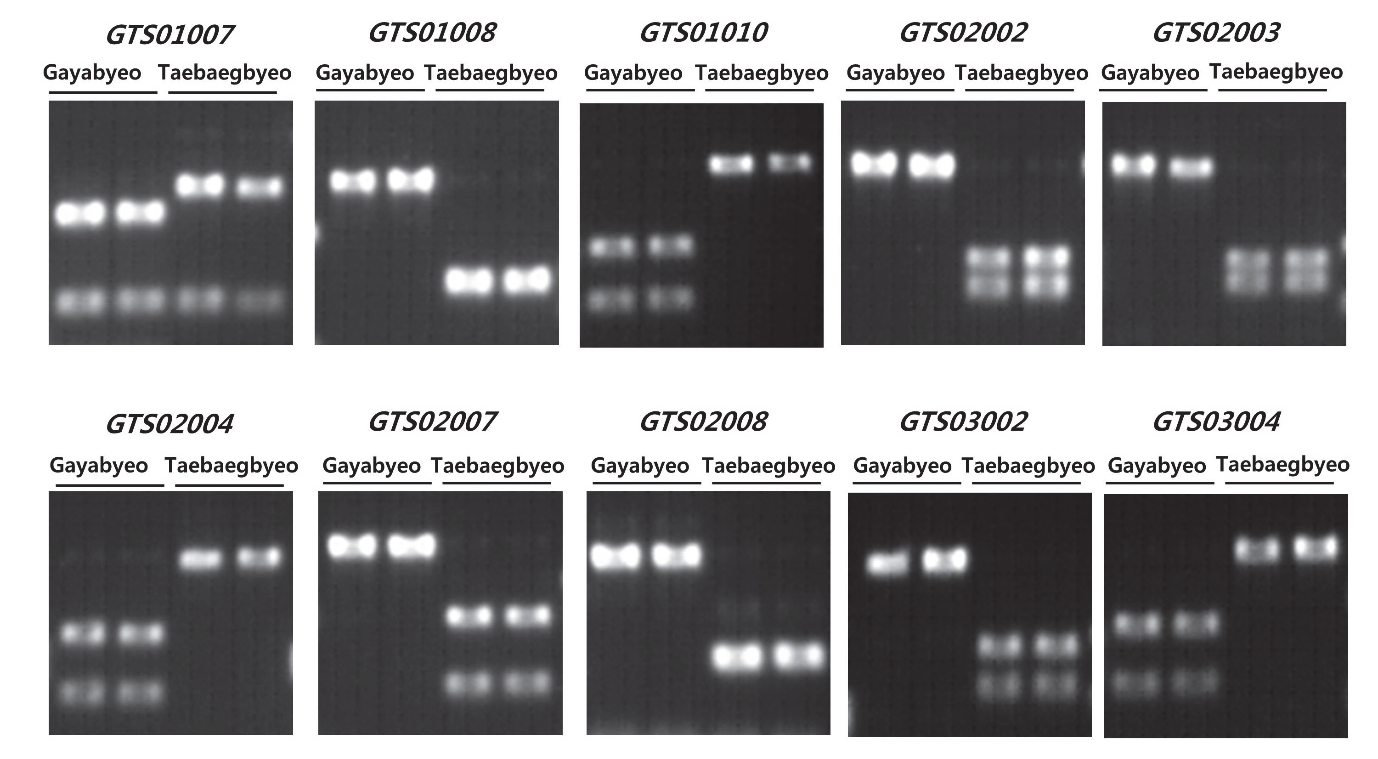
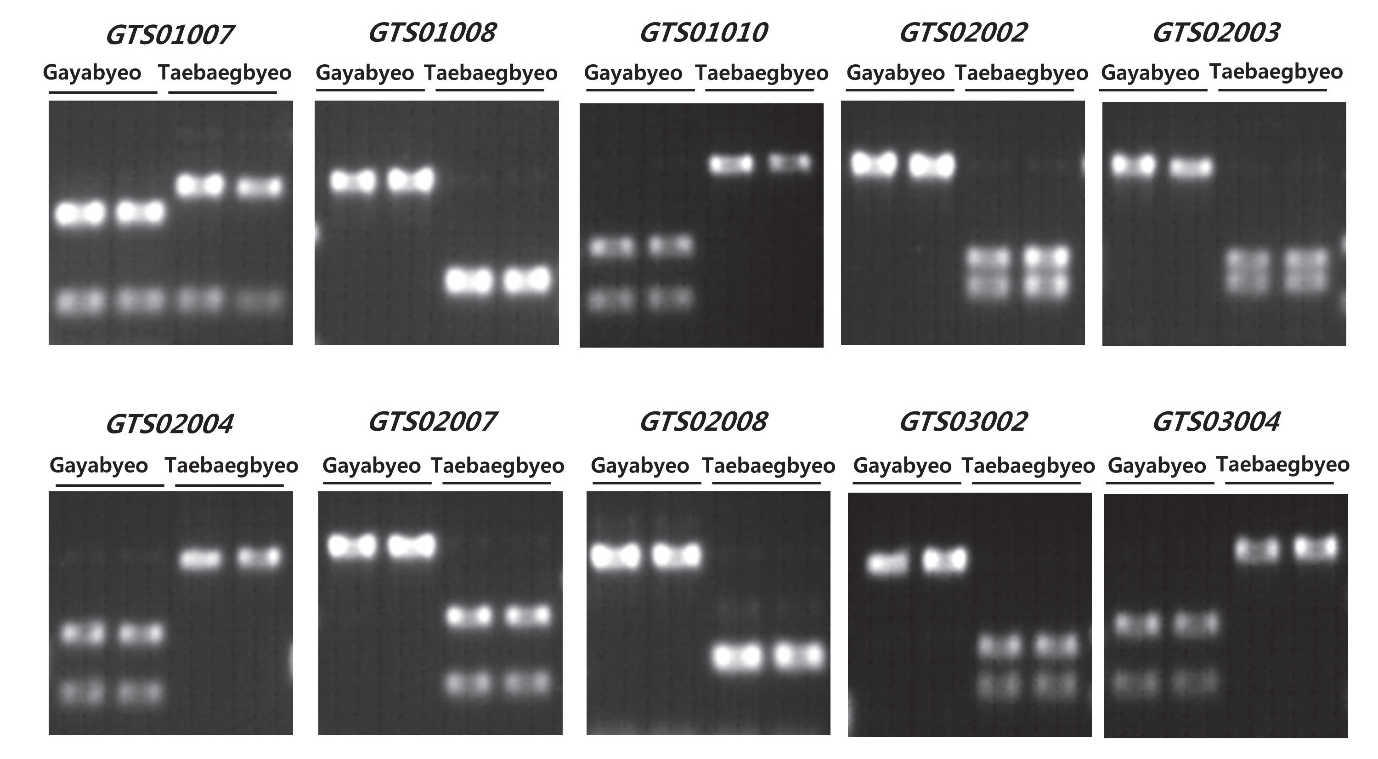
탐색된 SNP들을 이용하여 SNP 마커들을 개발할 수 있는지를 알아보기 위해 1, 2, 3번 염색체 SNP들 가운데 제한효소 인식부 위에 있는 SNP들을 대상으로 32개의 CAPS 마커들을 디자인하 여 모본들간 다형성(polymorphism)을 검정해 보았다. 이들 중 5개의 마커들이 PCR 증폭이 안되거나 미약하였으며, 7개 마커 는 제한효소 절단 패턴이 불분명하였다. 이들을 제외하고, PCR 증폭이 잘 되면서 제한효소 절단 패턴이 명확하였던 20개의 마커들 가운데 19개가 모본들간에 다형성을 보였고 1개의 마커 만이 다형성을 보이지 않았다(Table
4, Fig.
4). 주남벼와 남평벼 를 resequencing하여 두 품종간 SNP들을 탐색한 연구에서는 실험된 22개의 CAPS 마커들 중 17개가 다형성을 보였는데 (
Jeong et al. 2015), 이 연구에서는 정확도가 다소 향상된 것으로 추정된다. 이러한 정확도 향상의 원인은 두가지로 판단된다. 첫번째는 CLC Assembly Cell 프로그램의 clc_mapper 명령어 를 사용하여 염기서열 read들을 Nipponbare 표준유전체서열에 mapping할 때에 repeat ignore 옵션을 설정함으로써 반복서열들 이 제외되도록 한 것이다. 두번째는 10x 이상의 reading depth를 가진 SNP들을 선별하면서 이들 가운데서도 읽혀진 염기가 모두 단일하고 다른 염기가 읽혀지지 않은 SNP들만을 선별한 것이다.
Table 4.List of CAPS markers tested in this study.
Table 4.
|
No. |
marker name |
physical location
|
primer sequence
|
restriction enzyme |
polymorphism |
|
Chr. no |
distance from the top (Mbp) |
forward |
reverse |
|
|
1 |
GTS01007 |
1 |
25.6 |
AAGGGTTGTATGAACCGTCAAC |
TCCATGGGACACTAAAGAGAGG |
Sal I |
polymorphic |
|
2 |
GTS01008 |
1 |
26.69 |
CGTCGAAGAAAGTGACTCAAGA |
CCTCTTTTGTTGGTATCATTGG |
Nru I |
polymorphic |
|
3 |
GTS01009 |
1 |
27.34 |
ACTCCCAAAACCAGCGTAAATA |
CGTCAGGAATGAATTCGAAACT |
Sac I |
polymorphic |
|
4 |
GTS01010 |
1 |
32.52 |
AGAACCCGTGTAGAGCACATTA |
CAATTGATCTGCTTGCTCTCTG |
PshB I |
polymorphic |
|
5 |
GTS02001 |
2 |
1.33 |
AACTAGCACGCTTCGTTTTAGC |
CGGATTGGTGGAATTGAAAA |
Stu I |
polymorphic |
|
6 |
GTS02002 |
2 |
4.00 |
CCATTTGGCAATGTTCTCATAC |
CACCCTTCTATGCTCTCATCCT |
BamH I |
polymorphic |
|
7 |
GTS02003 |
2 |
5.07 |
TGTGTGGTAGAAAATGGACCTG |
CCATGATTGCCAGTGTTACATC |
EcoR I |
polymorphic |
|
8 |
GTS02004 |
2 |
6.85 |
TACCGATCAGCTGAAAACACAC |
TCTTGTTCCCTTCCCTTTAACA |
BamH I |
polymorphic |
|
9 |
GTS02005 |
2 |
7.66 |
AGTTTTCTTGTTTCGCATGCTC |
ACCGACCATGCACTTTACTCTT |
Hind III |
polymorphic |
|
10 |
GTS02006 |
2 |
8.59 |
GTGACCTCCGATCAAATCAACT |
CTACTGTGGGCAGTGAAGAGGT |
BamH I |
polymorphic |
|
11 |
GTS02007 |
2 |
9.66 |
ATTTCCCTCCTGTTCCTCATTT |
GGTTGGGTTTTGGTATAGCTGA |
Hind III |
polymorphic |
|
12 |
GTS02008 |
2 |
10.65 |
AGCTGGAAAATGTTGTATGCAG |
GGGATGAATCAGTAGTTCAGCA |
Hind III |
polymorphic |
|
13 |
GTS02009 |
2 |
11.48 |
GTGAGTGTGTGCTCAAGTTGGT |
ATGGGACTTACAGCACACGATT |
Fok I |
polymorphic |
|
14 |
GTS03002 |
3 |
11.55 |
AGCATCACGATGATTCTTTTGC |
TTATTGTGCCCTAGACGAATGA |
Sac I |
polymorphic |
|
15 |
GTS03004 |
3 |
13.59 |
TAGGGTTGGCTCTCAATCTCTC |
ACACCTACAAGGTTGTGACTGC |
EcoR I |
polymorphic |
|
16 |
GTS03005 |
3 |
16.21 |
AAATCAATTGCTACACGCACAC |
AAAGCCTCACGAGGTCATAAAA |
Hind III |
polymorphic |
|
17 |
GTS03006 |
3 |
17.26 |
GCTCGGTTGCAGGTTAATTACT |
GGTGCTGTTGTAGAAGGAGGAG |
BamH I |
polymorphic |
|
18 |
GTS03008 |
3 |
19.42 |
ATCGCACGGAAGGATAACTG |
GTTGCTCTAGAACCTCGCAATC |
Sac II |
polymorphic |
|
19 |
GTS03009 |
3 |
20.35 |
ATTATCTCACGACCTGGGACTG |
AGCTAGCTAGGGTTTGTGTTGC |
EcoR I |
polymorphic |
|
20 |
GTS03010 |
3 |
21.73 |
TGAGGAAGAGGAGGAGATTGAG |
CTGCTTCATTGTGTCTGAGGAC |
Sac I |
polymorphic |
Fig. 4.Examples of developing CAPS markers based on detected SNPs located in restriction enzyme recognition site
향후, 태백벼와 가야벼간 다형성을 나타내는 CAPS 마커를 추가로 개발하여 mapping을 수행하기에 충분한 수의 마커들이 확보되면, 가야벼와 태백벼간 차이가 나는 농업형질에 대한 mapping 연구에 활용할 계획이다. 또한 이 마커들은 통일형 벼 품종들의 유연관계 분석 등에도 활용될 수 있을 것이다.
적 요
벼멸구 저항성 통일형 벼 품종인 가야벼와 벼멸구 감수성 통일형 벼 품종인 태백벼와의 교배 후대집단을 이용하여 가야벼 의 저항성 유전자를 mapping하기 위한 1단계 연구로 가야벼와 태백벼를 resequencing하였다. 가야벼에서 약 18.5X10⁹ bp의 염기서열과, 태백벼에서 약 17.9X10⁹ bp의 염기서열이 생산되 었다. quality trimming을 거쳐 Nipponbare 표준유전체서열에 mapping한 결과 가야벼에서 약 9.3X10⁹ bp의 염기서열이 mapping되어 약 25.0X의 mapping depth를 나타내었으며, 태백 벼에서 약 9.5X10⁹ bp의 염기서열이 mapping되어 약 25.5X의 mapping depth를 나타내었다. 가야벼-Nipponbare 비교에서 총 1,585,880 개의 SNP가 탐지되었으며, 태백벼-Nipponbare 비교 에서 총 1,416,898 개의 SNP가 탐지되었다. 가야벼와 태백벼간 에는 총 284,501개의 SNP가 탐지되었다. 가야벼와 태백벼간 SNP들 가운데, 21.2%의 SNP들이 유전자 영역에 있었고, 78.8%의 SNP가 비유전자 영역에 있었다. 유전자 영역에 있는 SNP들 가운데 단백질 코딩 영역(CDS)에 있는 SNP들은 15,924 개이었으며, 이들 중 synonymous SNP들은 47.3%를 차지하였 고, non-synonymous SNP들은 52.7%를 차지하였다. 제한효소 인식부위에 있는 SNP들을 대상으로 CAPS 마커들을 디자인하 여 모본들간 다형성(polymorphism)을 검정한 결과, 20개의 마 커들 가운데 19개마커들이 모본들간에 다형성을 보였고 1개의 마커만이 다형성을 보이지 않았다. 이 연구결과를 토대로 가야벼 와 태백벼간 교배후대집단을 이용하여 벼멸구저항성 유전자를 mapping 하기에 충분한 마커들을 개발할 수 있을 것이다.
사 사
본 논문은 농촌진흥청 연구사업(과제번호: PJ01104201)의 지원에 의해 이루어진 것임.
References
- 1. Abe A, Kosugi S, Yoshida K, Natsume S, Takagi H, Kanzaki H, Matsumura H, Yoshida K, Mitsuoka C, Tamiru M, Innan H, Cano L, Kamoun S, Terauchi R. Genome sequencing reveals agronomically important loci in rice using MutMap. Nat Biotechnol 2012. 30: 174-178.
- 2. Alexandrov N, Tai S, Wang W, Mansueto L, Palis K, Fuentes RR, Ulat VJ, Chebotarov D, Zhang G, Li Z, Mauleon R, Hamilton RS, McNally KL. SNP-Seek database of SNPs derived from 3000 rice genomes. Nucleic Acids Res 2015. 43: D1023-D1027.
- 3. Arai-Kichise Y, Shiwa Y, Ebana K, Shibata-Hatta M, Yoshikawa H, Yano M, Wakasa K. Genome-wide DNA polymorphisms in seven rice cultivars of temperate and tropical japonica groups. PLoS One 2014. 9: e86312.
- 4. Barabaschi D, Tondelli A, Desiderio F, Volante A, Vaccino P, Vale G, Cattivelli L. Next generation breeding. Plant Sci 2016. 242: 3-13.
- 5. Gao ZY, Zhao SC, He WM, Guo LB, Peng YL, Wang JJ, Guo XS, Zhang XM, Rao YC, Zhang C, Dong GJ, Zheng FY, Lu CX, Hu J, Zhou Q, Liu HJ, Wu HY, Xu J, Ni PX, Zeng DL, Liu DH, Tian P, Gong LH, Ye C, Zhang GH, Wang J, Tian FK, Xue DW, Liao Y, Zhu L, Chen MS, Li JY, Cheng SH, Zhang GY, Wang J, Qian Q. Dissecting yield-associated loci in super hybrid rice by resequencing recombinant inbred lines and improving parental genome sequences. Proc Natl Acad Sci U S A 2013. 110: 14492-14497.
- 6. Guo L, Gao Z, Qian Q. Application of resequencing to rice genomics functional genomics and evolutionary analysis. Rice (N Y) 2014. 7: 4.
- 7. Huang X, Kurata N, Wei X, Wang ZX, Wang A, Zhao Q, Zhao Y, Liu K, Lu H, Li W, Guo Y, Lu Y, Zhou C, Fan D, Weng Q, Zhu C, Huang T, Zhang L, Wang Y, Feng L, Furuumi H, Kubo T, Miyabayashi T, Yuan X, Xu Q, Dong G, Zhan Q, Li C, Fujiyama A, Toyoda A, Lu T, Feng Q, Qian Q, Li J, Han B. A map of rice 1genome variation reveals the origin of cultivated rice. Nature 2012. 490: 497-501.
- 8. Jeong IS, Kim TH, Lee SB, Suh SC, Ji H. Genome wide Detection of DNA Polymorphisms Between Two Korean Japonica Rice Varieties. Plant Breeding and Biotechnology 2015. 3: 208-215.
- 9. Jeong IS, Yoon UH, Lee GS, Ji HS, Lee HJ, Han CD, Hahn JH, An G, Kim TH. SNP-based analysis of genetic diversity in anther-derived rice by whole genome sequencing. Rice (N Y) 2013. 6: 6.
- 10. Kim B, Kim DG, Lee G, Seo J, Choi IY, Choi BS, Yang TJ, Kim KS, Lee J, Chin JH, Koh HJ. Defining the genome structure of 'Tongil' rice, an important cultivar in the Korean "Green Revolution". Rice (N Y) 2014. 7: 22.
- 11. Mehra P, Pandey BK, Giri J. Genome-wide DNA polymorphisms in low Phosphate tolerant and sensitive rice genotypes. Sci Rep 2015. 5: 130-190.
- 12. Perez-de-Castro AM, Vilanova S, Canizares J, Pascual L, Blanca JM, Diez MJ, Prohens J, Pico B. Application of genomic tools in plant breeding. Curr Genomics 2012. 13: 179-195.
- 13. Seo BY, Jung JK, Choi BR, Park HM, Lee BH. Heong KL, Hardy B. Resistance-breaking ability and feeding behavior of the brown planthopper, Nilaparvata lugens, recently collected in Korea. Planthoppers : New threats to the sustainability of intensive rice production systems in Asia 2009. Los Banos (Philippines), International Rice Research Institute. 303-314.
- 14. Takagi H, Abe A, Yoshida K, Kosugi S, Natsume S, Mitsuoka C, Uemura A, Utsushi H, Tamiru M, Takuno S, Innan H, Cano LM, Kamoun S, Terauchi R. QTL seq rapid mapping of quantitative trait loci in rice by whole genome resequencing of DNA from two bulked populations. Plant J 2013a. 74: 174-183.
- 15. Takagi H, Uemura A, Yaegashi H, Tamiru M, Abe A, Mitsuoka C, Utsushi H, Natsume S, Kanzaki H, Matsumura H, Saitoh H, Yoshida K, Cano LM, Kamoun S, Terauchi R. MutMap-Gap : whole-genome resequencing of mutant F2 progeny bulk combined with de novo assembly of gap regions identifies the rice blast resistance gene Pii. New Phytol 2013b. 200: 276-283.
- 16. Wang L, Wang A, Huang X, Zhao Q, Dong G, Qian Q, Sang T, Han B. Mapping 49 quantitative trait loci at high resolution through sequencing-based genotyping of rice recombinant inbred lines. Theor Appl Genet 2011. 122: 327-340.
- 17. Xie W, Feng Q, Yu H, Huang X, Zhao Q, Xing Y, Yu S, Han B, Zhang Q. Parent-independent genotyping for constructing an ultrahigh-density linkage map based on population sequencing. Proc Natl Acad Sci U S A 2010. 107: 10578-10583.
- 18. Yamamoto T, Nagasaki H, Yonemaru J, Ebana K, Nakajima M, Shibaya T, Yano M. Fine definition of the pedigree haplotypes of closely related rice cultivars by means of genome-wide discovery of single-nucleotide polymorphisms. BMC Genomics 2010. 11: 267.
- 19. Yano K, Yamamoto E, Aya K, Takeuchi H, Lo PC, Hu L, Yamasaki M, Yoshida S, Kitano H, Hirano K, Matsuoka M. Genome-wide association study using whole-genome sequencing rapidly identifies new genes influencing agronomic traits in rice. Nat Genet 2016. 48: 927-934.