적요
Soybean cultivars with genetically low levels of stachyose enhance the utilization of soybean in food as well as feed uses. The objective of this research is to obtain the information on indirection selection of soybean lines with low stachyose content using DNA marker based on rs2 (rs2) gene. Two genetic populations were developed from the crosses of three parents (116-13 parent : low stachyose content, PI417227 and PI506903 parents: normal stachyose content). Twenty F2 plants of RS2_genotype and twenty F2 plants of rs2rs2 genotype from each populations were harvested. Content of stachyose was detected by HPLC. Stachyose contents (g/kg) of 116-13, PI417227, PI506903 parents were 3.7, 23.7, and 17.8, respectively. In population 1, stachyose content 20 F2 plants with RS2_ genotype was 14.8 – 24.1 and stachyose content 20 F2 plants with rs2rs2 genotype was 2.1 – 4.7. In population 2, stachyose content 20 F2 plants with RS2_ genotype was 12.4 – 19.7 and stachyose content 20 F2 plants with rs2rs2 genotype was 2.1 – 5.0. Mean difference between RS2_ genotype and rs2rs2 genotype in population 1 and 2 was highly significant. From this results, selection of genetic lines with low stachyose content by DNA marker based on RS2 (rs2) gene will be possible.
서 언
콩[
Glycine max (L.) Merr.]은 한반도와 남만주일대를 원산지 로 예로부터 식물성 단백질과 지방을 얻기 위하여 널리 재배되어 져 왔고, 최근에는 다양한 기능성 성분들이 발견됨에 따라 단순한 양질의 단백질 공급원의 역할을 넘어 건강 기능성 식품으로 주목받고 있다. 콩 종자에는 단백질 40%, 지방 20%, 탄수화물 35%, 미네랄 5% 정도가 함유되어져 있고(
Krober & Cartter 1962), 탄수화물의 약 47% 정도는 soluble sugar로 이루어져 있다(Hymowitz & Collins 1974). 콩 종자의 탄수화물에는 식이 섬유가 25%, 올리고당이 10% 정도이며, 올리고당은 2-10개의 단당이 결합되어 있는 상태이고 대표적인 올리고당으로는 sucrose, raffinose, stachyose 등이 존재하고 있다. Raffinose와 stachyose는 콩에서 각각 1%와 4% 정도 함유되어져 있다 (
Hymowitz et al. 1972). Raffinose와 stachyose는 sucrose에 galactose가 α-1, 6결합으로 1개 또는 2개 결합되어 있는 형태로 장내에는 α-galactosidase 효소가 결핍되어 있어 sucrose와 galactose로 분해시키지 못하기 때문에 난소화성인 것으로 밝혀 져 있다(
Suarez et al. 1999). 난소화성당은 분해되지 않은 상태로 대장에 도달하게 되고, 대장 내의 혐기성 미생물에 의해 분해되면 서 가스가 발생하면서 장을 불편하게 하고 체외로 배출시켜 불쾌감을 주는 것으로 알려져 있다(
Murphy et al. 1972).
Suarez 등(1997)은 일반적인 콩보다 raffinose와 stachyose의 함량이 떨어진 콩 생산물을 섭취하였을 경우 인체에서 가스발생이 감소 하였음을 보고하였다.
Stachyose의 함량은 유전자원에 따라 건물중의 0.014– 0.041% 정도로 매우 다양하며(
Hymowitz et al. 1972),
Hou등 (2009)은 유전자형, 성숙군, 원산지에 따른 stachyose의 함량 변이를 보고하였고,
Kumar등(2010)은 재배환경에 따른 함량의 변이를 보고한 바 있다. Stachyose의 함량은 단일 유전자나 주요 QTL(Quantitative trait loci)의 지배를 받는 것으로 알려져 있고 (
Sebastian et al. 2000,
Skoneczka et al. 2009),
Zeng 등(2015) 은 콩 염색체 10번과 11번에 존재하는 주요 QTL을 보고하였다. Stachyose의 함량이 낮은 유전자형에 대한 포장 실험결과 수량 등 대부분의 농업적 형질에서 일반콩과 차이가 없었다는 보고가 있다(
Jason et al. 2005). 콩 유전자원에서 raffinose 및 stachyose 의 함량이 낮은 PI200508이 발견되었으며, raffinose 및 stachyose 함량은 recessive allele
stc1a에 의해 조절되며,
stc1a 유전자는 낮은 raffinose synthase 활성을 갖는다고 보고하였다 (
Kerr & Sebastian, 2000).
Dierking & Bilyeu (2008)는 PI200508로부터
RS2라는 raffinose synthase의 대립유전자 (allele)를 발견하였으며,
RS2 유전자의 exon2에서 3개 염기쌍 (TGG)의 결실로 tryptophan의 손실이 발생한
rs2 유전자형에서 는 raffinose와 stachyose 함량이 감소하는 것을 보고하였다. 국내에서는
Choung (2005)이 32개의 장려품종과 468개의 유전 자원을 이용하여 stachyose의 함량이 건물중으로 0.75–3.32% 의 변이에 있다고 보고하였다.
Yang 등(2014)은 대원콩과 PI200508의 교배로 얻어진 F
2 집단에서
RS2 유전자 염기서열을 이용한 마커로 homozygous dominant, heterozygous, homozygous recessive의 개체들을 선발한 후 stachyose의 함량 분석결과 homozygous recessive 개체들이 낮은 성분을 보여 육종에서의 marker의 이용성을 제시 하였다.
RS2 유전자 염기서열을 이용한 마커로 여러 집단의 F
2 초기세대에서 homozygous recessive 개체선발이 가능하고 선발된 개체의 stachyose 함량이 통계적으로 PI200508 유전자 원의 함량과 유사하다면 효율적으로 stachyose 저함량 품종육성 이 가능 할 것으로 사료된다. 따라서, 본 연구에서는
RS2 유전자 염기서열 마커를 이용하여 F
2 초기세대에서 homozygous recessive 개체 선발과 선발된 개체의 stachyose 함량을 분석하 여 마커를 이용한 stachyose 저함량 콩 품종육성 효율을 높이기 위한 가능성을 재확인하기 위하여 진행되었다
재료 및 방법
유전집단
콩의 품질 및 기능성을 저하시키는 stachyose의 함량이 낮은 유전자원으로 밝혀진 PI200508(
Kerr & Sebastian, 2000)로부 터 유래된 stachyose의 함량이 낮은 116-13, PI417227 및 PI506903의 3가지 모본을 온실에 파종하여 교배를 실시하였다. 이용된 모본에 대한
RS2 유전자형과 농업적 형질은 Table
1과 같다.
Table 1Agronomic trait and RS2 genotype for three parents used in this experiment.
Table 1
|
Parents |
Flower color |
Stem termination type |
Seed coat color |
Hilum color |
Seed weight (g/100 seed) |
RS2 Genotype |
|
|
116-13 |
Purple |
Determinate |
Yellow |
Yellow |
19.5 |
rs2rs2
|
|
PI417227 |
Purple |
Determinate |
Yellow |
Brown |
24.0 |
RS2RS2
|
|
PI506903 |
Purple |
Determinate |
Yellow |
Yellow |
36.1 |
RS2RS2
|
두 개의 유전집단은 PI417227 x 116-13(집단 1) 및 PI506903 x 116-13(집단 2)의 조합으로 각각 F
1 종자를 얻었다. 얻어진 F
1 종자를 조합별로 2015년 온실에 파종하여 F
1 식물체로 양성하 면서 잡종성을 확인한 후 성숙기에 F
2 종자를 얻었다. 얻어진 F
2 종자를 조합별로 2016년 포장에 파종하여 F
2 집단으로 전개시 켰다. 집단별로 F
2 개체에 번호를 붙여 개화기때 어린 잎을 각각 채취하여
rs2 유전자 마커 분석에 이용하였다. 집단별로 각각 20개의
rs2rs2 유전자형을 가진 개체와
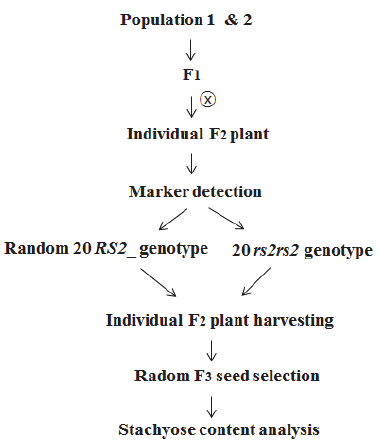
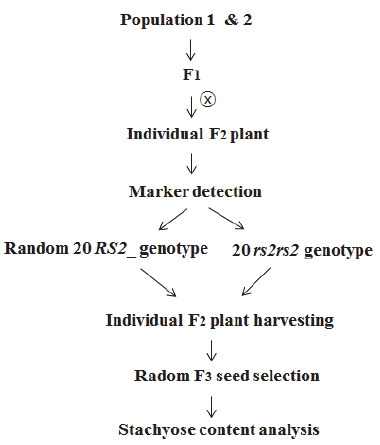
RS2_ 유전자형을 가진 개체를 임의로 선발하여 개체별로 수확하였다. 수확된 종자를 정선한 후 stachyose 함량 분석에 이용하였다(Fig.
1).
Fig. 1Scheme for the selection of F2 plant with low stachyose content using rs2 gene marker.
RS2 유전자형 분석
유전자원인 PI200508은
RS2 유전자의 coding sequence 중 TGG 염기서열이 결실되어 있어, TGG 결실 부분을 이용하여 primer를 디자인 하였다(Forward primer: 5ˊ-GCGTGGAGCA GGTGTATGTGTGG-3ˊ, Reverse primer: 5ˊ-TCAACCTTAA CACCGTCAATACC-3ˊ). DNA는
Rogers & Bendich (1994) 의 방법을 변형하여 추출하였다. 모본 및 집단별로 선발된 F
2 개체의 어린 잎을 2 ㎖ 원심분리 튜브에 넣고 액체질소를 추가하 여 잎을 마쇄하였다. 마쇄한 잎이 들어 있는 각각의 sample tube 에 CTAB extraction buffer[CTAB, 5M NaCl, 1M Tris, 0.5M EDTA, 14M 2-mercaptoethanol] 500 ㎕를 넣어준 뒤 항온수조 에 1시간 반응 시킨 후 상온에서 10분 동안 식혀주었다. 충분히 식혀진 sample tube에 chloroform/octanol (24:1) 500 ㎕를 추가하여 10분 동안 섞어 주었고, 섞은 후 4300 rpm, 4˚C 조건에 서 12분 동안 원심분리 하였다. 원심분리 후 상층액만 추출하여 새로운 1.5 ㎖ microcentrifuge tube로 옮겨 담았고 상층액이 옮겨진 각각의 sample tube에 냉동 보관된 isopropanol 500 ㎕를 넣어준 뒤 잘 섞어 –80˚C 초저온냉동고에서 30분간 보관하 였다. 30분 후 뭉쳐진 덩어리를 새로운 1.5 ㎖ microcentrifuge tube로 옮겨 담았고, 덩어리가 옮겨진 각각의 sample tube에 80% ethanol 500 ㎕를 넣어준 뒤 12,000 rpm에서 10분간 원심 분리 하였다. 원심분리 후 ethanol을 제거하였고 ethanol이 제거 된 sample tube를 10분간 상온에서 건조시켰다. 건조된 sample tube에 1X TE buffer (pH 8.0) 250 ㎕를 넣어 녹여준 뒤 4˚C 조건에서 냉장 보관하여 DNA sample로 사용하였다. 추출한 DNA를 증폭시키기 위해 PCR(polymerase chain reaction)을 실시하였다. PCR 반응액의 조성은 각 sample 당 DNA 2.5 ㎕, Water 11.5 ㎕, PCR Master Mix [10X PCR buffer, 50mM MgCl₂, 100mM BSA, 100mM dATP, 100mM dTTP, 100mM dGTP, 100mM dCTP] 3.44 ㎕, forward와 reverse primer 각 0.23 ㎕, Polymerase (E-3100, Bioneer Co., Daejeon, Repub lic of Korea) 0.1 ㎕를 혼합하여 총 18 ㎕ volume이 되게 하였다. PCR은 95˚C 30s (denature), 60.5˚C 30s (annealing), 72˚C 30s (extension)의 조건으로 32회 반복 실행되었다. PCR 완료 후 DNA가 증폭된 반응액 sample에 loading dye 2 ㎕를 혼합하여 2% agarose gel (1 X TAB buffer 100 ㎖ 당 agarose 2 g, ETBR 3 ㎕)에 loading하였고, 120V 조건에서 25분간 전기영동을 실시하였다. 전기영동 완료 후 band의 유무로
rs2rs2 유전자형과
RS2_ 유전자형을 구분하였다.
Sung 등(2014)의 방법을 이용하여 콩 종자에서 syachyose를 추출하였으며 HPLC로 분석하였다. 포장에 파종된 3개의 모본, 집단별 20개의 rs2rs2 유전자형을 가진 F2 개체, RS2_ 유전자형 을 가진 F2 개체등 전체 83개의 sample를 수확하여 자연 건조 후 종자를 임의적으로 선발하여 stachyose의 함량을 분석하기 위한 시료로 사용하였다. 선발된 성숙 종자를 막자와 사발을 이용하여 파쇄 한 후 분말 200 ㎎을 취해 3 ㎖의 아세톤 처리를 하고 60℃의 항온수조에 두어 2시간 동안 반응시킨 후, 이를 2,000rpm으로 5분간 원심분리하여 침전물을 취함으로서 지방 질을 제거하였다. 침전물을 약 60℃의 heating block에서 열처리 하여 남은 유기용매를 완전히 제거하였고, 삼차 증류수 1.9 ㎖을 가하여 60℃의 water bath에 2시간 동안 둔 후 0.1 ㎖의 1M 5-SSA(5-sulfosalicylic acid)를 첨가하여 4℃에 두고 overnight 시켰다. 이를 3,000rpm으로 5분간 원심분리하여 침전물은 버리 고 상등액을 취하여 시료에 포함된 단백질을 비롯한 방해물질을 제거한 후 상등액 0.8 ㎖에 동량의 삼차 증류수를 넣고 4℃에서 12,000rpm으로 10분간 원심분리하여 상등액을 취하였다. 0.2 ㎛ membrane filter에 상등액을 여과시킨 후 4℃에 보관하여 HPLC(High performance liquid chromatography)로 stachyose 함량을 분석하였다. 사용된 HPLC는 Agilent 1100 series(Agilent Technologies, Santa Clara, CA, USA)이며, RI(reflective index) detector를 사용하였다. 분석 column은 Supelcogel 610-H column(300 × 7.8 mm i.d., 9 μm, Supelco, USA)을 사용하였으 며, 이동상인 0.1% H3PO3수용액을 0.6 ㎖/min으로 일정하게 흘려주었다. 시료 주입량은 10 ul로 하였다. 시료의 stachyose 함량을 분석하기 위해서 각각의 표준물질(S4001, Sigma-Aldrich Co.)을 농도별(1, 0.5, 0.25, 0.125, 0.0625 mg/㎖)로 HPLC 분석을 수행하여 검량선을 작성하였다. 통계처리는 SAS(Ver. 9.2 for windows, SAS Institute, Cary, NC, USA) 프로그램을 이용하여 t-검증을 실시하였다.
결과 및 고찰
콩 성숙 종자에서 stachyose의 함량이 낮은 모본(116-13)을 이용하여 육성된 2개의 유전집단에서
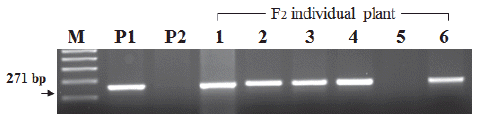
rs2 유전자 마커는 F
2 개체에 따라 분리를 보였다(Fig.
2).
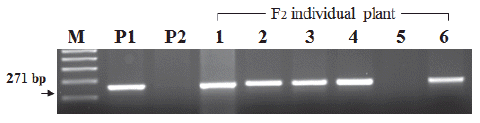
Fig. 2Segregation of rs2 gene marker in F2 individual plants. M: molecular marker, P1:PI417227(RS2RS2 genotype), P2:116-13(rs2rs2 genotype).
F
2 개체가
rs2rs2 유전자형일 경우 모본(113-13)과 동일하게 PCR 밴드가 발견되지 않았으나
RS2RS2와
RS2rs2에서는 밴드 가 확인되었다. 이러한 결과는
rs2 유전자를 SNP 마커로 이용하 여 장려품종과 PI200508의 교배로 얻어진 F
2 집단에서 3:1의 분리를 보고한 이전의 연구결과(
Yang et al. 2014)와 일치하였다. 집단 1(PI417227 x 116-13) 및 집단 2(PI506903 x 116-13)에서 각각 F
2 개체별
RS2 (
rs2) 유전자형 분석결과
rs2rs2 유전자형을 보인 20개체와
RS2RS2 유전자형 또는
RS2rs2 유전자형 형태를 보인 20개체에 대한 stachyose 함량 분석결과는 Table
2와 같다.
Table 2Stachyose content of parents and F2 individual plants according to Rs2 (rs2) genotype.
Table 2
|
Parents/F2
|
Rs2 (rs2) genotype |
Stachyose (g/kg) |
|
|
Population 1 |
Population 2 |
|
|
116-13 |
rs2rs2
|
3.7 |
|
PI417227 |
RS2RS2
|
23.7 |
|
PI506903 |
RS2RS2
|
17.8 |
|
F2-1 |
RS2_
|
24.1 |
17.1 |
|
-2 |
rs2rs2
|
3.1 |
4.4 |
|
-3 |
RS2_
|
23.3 |
19.7 |
|
-4 |
rs2rs2
|
3.3 |
4.2 |
|
-5 |
rs2rs2
|
4.3 |
4.0 |
|
-6 |
rs2rs2
|
4.7 |
3.5 |
|
-7 |
RS2_
|
19.3 |
15.5 |
|
-8 |
RS2_
|
22.6 |
14.4 |
|
-9 |
RS2_
|
14.8 |
16.6 |
|
-10 |
rs2rs2
|
3.3 |
2.9 |
|
-11 |
RS2_
|
23.5 |
16.9 |
|
-12 |
rs2rs2
|
2.2 |
2.8 |
|
-13 |
RS2_
|
18.1 |
17.1 |
|
-14 |
rs2rs2
|
3.5 |
2.7 |
|
-15 |
RS2_
|
22.3 |
18.4 |
|
-16 |
rs2rs2
|
4.3 |
2.4 |
|
-17 |
rs2rs2
|
4.4 |
3.8 |
|
-18 |
RS2_
|
22.1 |
14.4 |
|
-19 |
RS2_
|
23.6 |
13.3 |
|
-20 |
RS2_
|
18.4 |
12.4 |
|
-21 |
rs2rs2
|
2.7 |
3.7 |
|
-22 |
rs2rs2
|
2.4 |
2.9 |
|
-23 |
rs2rs2
|
2.1 |
4.1 |
|
-24 |
RS2_
|
21.4 |
17.1 |
|
-25 |
rs2rs2
|
3.0 |
4.3 |
|
-26 |
RS2_
|
16.8 |
18.6 |
|
-27 |
RS2_
|
19.1 |
16.7 |
|
-28 |
rs2rs2
|
2.1 |
3.7 |
|
-29 |
RS2_
|
21.2 |
15.5 |
|
-30 |
rs2rs2
|
2.3 |
3.3 |
|
-31 |
RS2_
|
18.2 |
13.8 |
|
-32 |
RS2_
|
18.8 |
14.5 |
|
-33 |
rs2rs2
|
3.1 |
5.0 |
|
-34 |
rs2rs2
|
2.8 |
4.9 |
|
-35 |
RS2_
|
16.8 |
18.2 |
|
-36 |
rs2rs2
|
2.3 |
4.3 |
|
-37 |
RS2_
|
18.1 |
17.9 |
|
-38 |
rs2rs2
|
3.4 |
4.6 |
|
-39 |
rs2rs2
|
2.1 |
2.1 |
|
-40 |
RS2_
|
15.5 |
19.4 |
Stachyose의 함량은
rs2rs2 유전자형을 가진 116-13 모본에 서는 3.7 g/kg이었고,
RS2RS2 유전자형을 가진 PI417227 모본 은 23.7g/kg이었으며 PI506903 모본은 17.8 g/kg을 나타내었다. 집단 1에서는 2.1–24.1 g/kg의 범위를 보였고, 집단 2에서는 2.1-19.7 g/kg의 범위를 나타내었다. 이러한 결과는 장려품종인 ‘Osage’의 stachyose 함량이 19.8-51.8 g/kg 범위에 있었으며, stachyose의 함량이 낮은 품종은 2.1-4.6 g/kg의 범위를 보인 이전의 결과와 유사하였다 (
Zeng et al. 2015). 집단별
RS2 (
rs2) 유전자 마커 분석에 따른 유전자형별 stachyose의 함량에 대한 통계는 Table
3과 같다.
Table 3Statistics for stachyose content (g/kg) according to population and RS2 (rs2) genotype.
Table 3
|
Population |
Genotype |
No. of sample |
Range |
Mean±SDz
|
t-value |
|
|
1 |
RS2_
|
n=20 |
14.8 |
– 24.1 |
20.0±3.0 |
24.4**y
|
|
rs2rs2
|
n=20 |
2.1 |
– 4.7 |
3.1±0.8 |
|
|
2 |
RS2_
|
n=20 |
12.4 |
– 19.7 |
16.4±2.1 |
25.4**
|
|
rs2rs2
|
n=20 |
2.1 |
– 5.0 |
3.7±0.8 |
집단 1에서
RS2_ 유전자형(N=20)의 stachyose 함량(g/kg)의 범위와 평균은 각각 14.8-24.1, 20.0+3.0이었으나
rs2rs2 유전자 형(N=20)의 경우 각각 2.1-4.7, 3.1+0.8로 휠씬 낮았다. 유전자 형에 따른 두 집단의 평균치에 대한 t 분석결과 고도로 유의한 차이를 보였다. 집단 2에서는
RS2_유전자형을 보인 20개체의 stachysoe 함량 범위는 12.4-19.7이었고 평균은 16.41±2.1인 반면에
rs2rs2 유전자형을 가진 20개체의 범위는 2.1-5.0이었으 며 평균은 3.7±0.8로 매우 낮은 함량을 보였다. 유전자형에 따른 두 집단의 평균치에 대한 t 분석결과 집단 1에서와 마찬가지로 고도로 유의한 차이를 보였다. 이용된 모본에 따라 집단 1과 2에서 stachyose 함량의 변이는 다소 존재하나
RS2 (
rs2) 유전자 형에 따른 stachyose의 함량은
rs2rs2 유전자형일 경우 매우 낮아 저 stachyose 함량 콩 계통 선발에
RS2 (
rs2) 유전자 마커가 효율적으로 이용될 수 있을 것으로 사료된다. 이러한 결과는 stachyose의 함량이
RS2 allele에 큰 영향을 받는다고 보고한 이전의 결과와 유사하였다(
Dierking & Bilyeu 2008).
적 요
콩 성숙 종자에 존재하는 stachyose 성분은 품질, 기능성, 가공적성을 저하시키기 때문에 stachyose의 함량이 낮은 콩 품종 육성이 요구된다. Stachyose의 함량이 낮은 콩 품종 육성을 위하 여 rs2 유전자 마커의 이용성에 관한 자료를 얻기 위하여 수행된 연구 결과는 아래와 같았다. 3개의 모본을 이용하여 2개의 유전 집단(PI417227 x 116-13, PI506903 x 116-13)에서 RS2 (rs2) 유전자 마커는 single gene 분리양상을 보였다. Stachyose의 함량은 rs2rs2 유전자형을 가진 116-13 모본에서는 3.7g/kg이었 고, RS2RS2 유전자형을 가진 PI417227 모본은 23.7g/kg이었으 며 PI506903 모본은 17.8g/kg을 나타내었다. 집단 1에서의 stachyose 함량(g/kg)은 RS2_유전자형을 보인 20개체의 범위는 14.8-24.1이었고 평균은 20.0±3.0인 반면에 rs2rs2 유전자형을 가진 20개체의 범위는 2.1-4.7이었으며 평균은 3.1±0.8로 훨씬 낮은 함량을 보였다. 집단 2에서는 RS2_유전자형을 보인 20개체 의 stachysoe 함량 범위는 12.4-19.7이었고 평균은 16.41±2.1인 반면에 rs2rs2 유전자형을 가진 20개체의 범위는 2.1-5.0이었으 며 평균은 3.7±0.8로 매우 낮은 함량을 보였다. 유전자형에 따른 두 집단의 평균치에 대한 t 분석결과 집단 1 및 2에서 고도로 유의한 차이를 보여 저 stachyose 함량 콩 계통 선발에 RS2 (rs2) 유전자 마커가 효율적으로 이용될 수 있을 것으로 보였다.
사 사
본 연구는 2015년도 정부(교육부)의 재원으로 한국연구재단 의 지원을 받아 수행된 기초연구사업(No. 2015059053) 결과입 니다.
References
- 1. Choung M.G.. Determination of soluble carbohydrates in soybean seeds. Kor J Crop Sci 2005. 50: 319-324.
- 2. Dierking E.C., Bilyeu K.D.. Association of a soybean raffinose synthase gene with low raffinose and stachyose seed Phenotype. Plant Genome 2008. 1: 135-145.
- 3. Hou A., Chen P., Alloatti J., Li D., Mozzoni L., Zhang B., Shi A.. Genetic variability of seed sugar content in worldwide soybean germplasm collections. Crop Sci. 2009. 49: 903-912.
- 4. Hymowitz T., Collins F.I.. Variability of sugar content in seed of Glycine max (L.) Merrill and G. soja Sieb and Zucc. Agron. J. 1972. 66: 239-240.
- 5. Hymowitz T., Collins F.I., Panezner J., Walker W.M.. Relationship between the content of oil, protein, and sugar in soybean seed. Agron. J. 1972. 64: 613-616.
- 6. Jason D.N., Fehr W.R., Schnebly S.R.. Agronomic and seed characteristics of soybean with reduced raffinose and stachyose. Crop Sci. 2005. 45: 589-592.
- 7. Kerr P.S., Sebastian S.A.. Soybean products with improved carbohydrate composition and soybean plants. U.S. Patent 6147193 2000.
- 8. Krober O.A., Cartter J.L.. Quantitative interrelations of protein and nonprotein constituents of soybeans. Crop Sci. 1962. 2: 171-172.
- 9. Kumar V.A., Rani L., Goyal A., Dixit K., Manjaya J.G., Swamy M.. Sucrose and raffinose family oligosaccharides Population Genotype No. of sample Range MeanA SDz t-value (RFOs) in soybean seeds as influenced by genotype and growing location. J. Agric. Food Chem. 2010. 58: 5081-5085.
- 10. Murphy E.L., Horsley H., Burr H.K.. Fractionation of dry bean extracts which increase carbon dioxide egestion in human flatus. J. Agric. Food Chem. 1972. 20: 813-817.
- 11. Rogers S.O., Bendich A.J.. Extraction of total cellular DNA from plants, algae and fungi.. Plant Molecular Biology Manual, 1994. pp. 183-190.
- 12. Sebastina S.A., Kerr P.S., Pearisten R.W., Hitz W.D.. 2000. Soybean germplasm with novel genes for improved digestibility.. Federation of Animal Sci. Soc, Savoy, IL.
- 13. Skoneczka J.A., Saghai Maroof M.A., Shang C., Buss G.R.. Identification of candidate gene mutation associated with low stachyose phenotype in soybean lines PI200508. Crop Sci. 2009. 49: 247-255.
- 14. Suarez F.L., Furne J.K., Springfield J.R., Levitt M.D.. Insights into human colonic physiology obtained from study of flatus composition. Am. J. Physiol. 1997. 272: 1028-1033.
- 15. Suarez F.L., Springfield J., Furne J.K., Lohrmann T.T., Kerr P.S., Levitt M.D.. Gas production in humans ingesting soybean flour derived from beans naturally low in oligosaccharides. Am. J. Clin. Nutr. 1999. 69: 135-139.
- 16. Zeng A., Chen P., Zhang B., Orazaly M., Palacios L.F., Brye K.R.. Identification and confirmation of quantitative trait loci for stachyose content in soybean seed. Plant Breed. 2015. 134: 178-185.
- 17. Yang K., Ko J.M., Ha T.J., Lee Y.H., Baek I.Y., Yang T.J., Nou I.S.. Development of molecular markers for low raffinose and stachyose in korean soybean cultivars. Plant Breed. Biotechnol. 2014. 2: 151-157.