적요
A dwarf mutant rice line was selected from an Ac/Ds insertion mutant population and named dwf1. The phenotype of F1 and F2 plants derived from a cross between dwf1 and Dongjin indicated that a single recessive gene is responsible for the mutant phenotype, and we named this gene dwf1. Resequencing of the dwf1 line and Dongjin (wild type) revealed 42,386 homozygous single nucleotide polymorphisms (SNPs) between dwf1 line and Dongjin. MutMap analysis was performed by sequencing a DNA pool prepared from 100 mutant type plants in the dwf1/Dongjin F2 population, and it was found that the dwf1 gene was located in the 23 ~ 30 Mbp region on chromosome 4. In this region, we found a non-synonymous SNP in the Os04g0469800 gene, which was reported as D11 gene encoding a cytochrome P450 family protein involved in the biosynthesis of brassinosteroids (BRs). This SNP was regarded as the causative SNP for the dwf1 phenotype, and the dwf1 gene is a novel allele of D11. We performed mapping of the dwf1 gene with five SNP markers on chromosome 4 with 190 dwf1/Dongjin F2 plants. The phenotype of F2 plants was completely co-segregated with genotypes of the J10402 marker, which was developed based on the non-synonymous SNP in the D11 gene. These results will contribute to the study of the molecular biological functions of the D11 gene and BRs.
서 언
세계 인구는 2050년까지 90억명으로 증가되어 식량생산량은 현재의 두 배가 필요할 것이라 예측된다(
Ray et al. 2013). 식량난을 해결하기 위한 작물 생산량 증대는 인류의 생존을 위한 필수적인 과제이다. 작물의 단간 형질은 작물 생산량 증대를 가져온 중요한 형질로 지베렐린에 대한 반응성을 감소시킨 밀 단간 품종 육성을 비롯하여 단간 형질 도입을 통한 작물 생산성 증대 연구가 계속되고 있다(
Peng et al. 1999).
최근 차세대시퀀싱(next-generation sequencing, NGS)을 이용한 유전체 염기서열분석(whole genome sequencing, WGS)이 활발히 수행되고 있으며, 시퀀싱 기술의 발전과 자동화로 유전체 염기서열 시퀀싱에 필요한 시간과 비용이 줄어들고 고품질의 염기서열 정보를 얻을 수 있게 되었다. 생물 정보학 도구들과 알고리즘의 발달은 방대한 양의 염기서열 정보를 보다 빠르게 분석할 수 있도록 하였으며, 유전체 염기서열 분석을 활용한 연구 기법도 다양하게 개발되었다. 그 중 MutMap (
Abe et al. 2012)은 돌연변이형과 야생형을 교배한 F
2세대를 이용하여 돌연변이 특성을 유발시키는 유전자 염기서열 변이를 신속하게 찾는 분석방법이다. MutMap은 MutMap+ (
Fekih et al. 2013), MutMap-Gap (
Takagi et al. 2013b), QTL-Seq (
Takagi et al. 2013a)로 확장되어 돌연변이 계통 뿐만 아니라 유전자원을 대상으로 목표 유전자를 탐색할 수 있도록 발전한 유용한 연구 기법이다. MutMap은 돌연변이형과 야생형을 교배한 F
2세대에서 돌연변이형 개체들을 선발하여 DNA를 같은 비율로 혼합한 DNA pool을 작성하여 차세대 시퀀싱 기술을 이용하여 시퀀싱한 후 돌연변이형과 야생형간 나타나는 단일염기다형성(single DNA polymorphism, SNP) 유전자좌에서 전체 염기 allele에 대한 돌연변이형 염기 allele의 비율인 SNP-index를 구한다. 돌연변이 표현형을 유발하는 SNP와 이에 밀접하게 연관된 SNP들에서는 F
2세대의 돌연변이 표현형을 보이는 자손들의 염기 allele이 동일해야 하므로 SNP-index는 1에 근접하게 되고, 그렇지 않은 SNP들에서는 야생형 allele와 돌연변이 계통의 allele 비율이 대략 1:1이 되어 SNP-index가 0.5에 근접하게 된다. 그러므로, SNP-index가 1에 근접한 영역을 찾음으로써 돌연변이 특성을 유발하는 변이를 신속히 추정할 수 있다.
스테로이드 호르몬의 일종인 brassinosteroids (BRs)는 식물 생장 촉진 호르몬으로서 세포 분열과 세포 신장, 광 형태 형성, 물관부 형성, 화분관의 발달, 잎의 개도, 잎의 노화, 스트레스 반응 등을 포함하는 다양한 범위의 식물 발달과 생리 현상에 중요한 역할을 한다(
Clouse & Sasse 1998,
Mussig 2005). 대표적인 BRs인 Brassinlolide (BL)의 생합성과정에서 중요한 단계들로는 campesterol이 campestanol, cathasterone, teasterone, typhasterol, castasterone을 거쳐 BL이 합성되는데 이 과정에서 C-22 oxidation pathway와 C-6 oxidation pathway가 작용한다(
Fujioka & Yokota 2003). 벼에서 BRs 생합성과정에 관여하는 것으로 밝혀진 유전자들 가운데
Brd1과
ebisu dwarf (
D2) 유전자들은 BRs의 생합성 과정 중 C-6 oxidation pathway에 관여하는 것으로 밝혀졌다.
Brd1 유전자는 teasterone, typhasterol과 castasterone의 합성에 관여하며(
Hong et al. 2002),
D2 유전자는 6-deoxocathasterone에서 3-dehydro-6-deoxoteasterone을 합성하는 과정에 관여하는 것으로 밝혀졌다(
Hong et al. 2003). 그리고, 벼
Dwarf11 (
D11) 유전자는 6-deoxotyphasterol과 typhasterol의 합성 과정에 관여하는 것으로 추정되었다(
Tanabe et al. 2005). 지금까지 BRs의 결핍으로 인하여 발생되는 돌연변이 계통들을 이용하여 많은 연구가 진행되었다. BR 결핍 돌연변이인
brassinosteroid-dependent dwarf1 (
brd1) 계통에서는 세포 신장이 저해되어 초장이 짧아졌다(
Mori et al. 2002).
brassinosteriod-deficient dwarf2 (
brd2) 계통에서는 BRs의 결핍으로 인하여 종자 표현형이 동그랗게 변형되었고, 줄기와 뿌리의 세포가 신장되지 않아 야생형에 비해 길이가 짧은 표현형을 가지고 있었으며, 야생형 보다 잎의 개도가 더 작은 표현형을 나타내었다(
Hong et al. 2005). Arabidopsis에서
constitutive photomorphogenesis and dwarfism (
cpd) 계통에서는 물관부의 형성이 비정상적이었고(
Szekeres et al. 1996), 벼
dwarf61 (
d61) 돌연변이 계통에서는 줄기의 세포와 세포내의 미세소관이 무질서하게 정렬되어 있었다(
Yamamuro et al. 2000). BRs를 활용하여 생산성과 재해저항성을 증대시킬 수 있다. BR 생합성 유전자인 옥수수의
CYP724B4를 벼에 형질전환해서 과발현하였을 경우 낟알의 무게와 초장은 19%, 분얼수는 28%, 생체중은 42%까지 증가하였다(
Wu et al. 2008). 벼의 BR 생합성 유전자인
CYP90B2/OsDWARF4 돌연변이 계통들은 재식 밀도를 높여 재배했을 때 생체중과 종자 수확량이 원품종인 니폰바레보다 증가되었다(
Sakamoto et al. 2006). 유채에서 24-epibrassinolide (EBR)을 처리했을 때 heat-shock protein들의 합성이 증가되어 고온 내성이 증가하였다(
Dhaubhadel et al. 2002). perennial ryegrass에서 EBR을 처리했을 때 염해 조건에서 항산화 효소들인 superoxide dismutase (SOD), catalase (CAT), ascorbate peroxidase (APX)의 활성이 증가하고 프롤린과 양이온(K
+, Ca
2+, Mg
2+)의 축적이 촉진되어 내염성이 증대되었다(
Wu et al. 2017).
이 연구에서는 농촌진흥청에서 육성한 Ac/Ds 삽입 돌연변이 집단에서 BRs 돌연변이의 특징인 단간, 동그란 종자 모양, 불임, 진한 엽색 등의 표현형을 보이는 돌연변이 계통을 선발하였다. 이 계통을 dwf1으로 명명하고, MutMap 분석을 수행하여 돌연변이 원인 유전자를 탐색하였다. 그 결과 BR 생합성에 관여하는 D11 유전자에서 아미노산 변이를 유발하는 단일염기서열변이가 dwf1 계통에 일어났음을 발견하였고, 이에 의하여 dwf1 계통의 돌연변이 표현형이 나타났음을 추정할 수 있었다.
재료 및 방법
식물 재료
본 연구에서 사용된 벼 돌연변이 계통은 농촌진흥청에서 Ac/Ds 전이인자를 동진벼에 형질 전환하여 얻어진 Ac/Ds 삽입 돌연변이 집단(
Chin et al. 1999,
Kim et al. 2004)에서 선발되었다. Ac/Ds 삽입 돌연변이 집단 중 dwarf 표현형을 지닌 Ds061942 계통을
dwf1으로 명명하였다.
dwf1과 원품종인 동진벼를 교배한 F
1을 자가 수정시킨 F
2 집단을 온실과 포장에서 전개하였다.
유전체염기서열 분석을 수행하기 위해 dwf1, 동진벼, dwf1/동진벼 F2 식물체들의 잎을 샘플링하고 DNeasy Plant Mini kit (Qiagen, Hilden, Germany)를 이용하여 DNA를 추출하였다. 유전체 염기서열 분석은 제조사(Illumina, San Diego, USA)의 프로토콜에 따라 Genomic DNA로부터 Paired-end library를 만들어 Hiseq2000 (Illumina)장비로 염기서열분석을 하였다. 이 결과로 생산된 최초의 염기서열은 모두 101bp 길이로 되어 있으며, quality trimming 절차를 통해 Q20 (정확도 99%) 미만인 부분을 제거하고, 남은 길이가 90 bp 이상인 read들만을 이후의 분석에 사용하였다.
주로 CLC Assembly Cell 프로그램(ver. 3.2.2,
http://www.clcbio.com)을 사용하여 유전체 염기서열 데이터 분석을 수행하였다. 이 때 표준 유전체 서열(reference genome sequence)은 RAP-DB (The Rice Annotation Project Database,
http://rapdb.dnaaffrc.go.jp/)에 있는 Nipponbare IRGSP-1.0 sequence (
http://rapdb.dna.affrc.go.jp/download/irgsp1.html)을 사용하였다. clc_mapper 명령어를 사용하여 read mapping을 수행하였는데, 이 때 옵션 값을 similarity 95%, matched length fraction 1.0, repeat ignore로 설정하여 각 read의 전체 영역이 match되면서 염기서열 유사도가 95% 이상인 서열만을 선별하고 반복서열들은 제외되도록 하였다. clc_find_variations 명령어를 사용하여
dwf1과 동진벼에서 표준유전체(Nipponbare) 대비 SNP들의 목록을 추출하였다. 이후의 분석은 자체로 작성한 Python 프로그램을 사용하였는데, 먼저 sequencing error에 의한 mismatch를 배제하기 위해 mapping depth가 10이상인 SNP들만을 추출하였다. 동진벼와 Nipponbare간 SNP들(DJ-NP SNP)과
dwf1 계통과 Nipponbare간 SNP (
dwf1-NP SNP)들을 비교하여 동진벼와
dwf1 계통간의 SNP들(DJ-
dwf1 SNP)을 추출하였다. 표준 유전체 서열의 annotation 정보를 이용하여 각 SNP들의 위치 영역을 intergenic, 5’ untranslated region (UTR), coding sequence (CDS), intron, 3’ UTR로 구분하고, CDS에 위치한 SNP인 경우 아미노산을 변화시키는 non-synonymous SNP인지, 아니면 아미노산을 변화시키지 않는 synonymous SNP인지를 구분하였다.
동진벼와 dwf1 계통간 교대 후대 F2집단(441 개체)에서 돌연변이 표현형을 보이는 100 개체들의 DNA를 pooling하였다. 이 DNA pool을 대상으로 위에서 서술한 방법으로 유전체 염기서열 분석을 수행하였다. 이 돌연변이형 F2 개체들의 DNA pool (F2MP)을 시퀀싱한 데이터를 Nippinbare 표준유전체 염기서열과 비교하여 SNP (F2MP-NP SNP)들을 추출하였다. 동진벼와 dwf1간 SNP (DJ- dwf1 SNP)들과 F2MP-NP SNP들에서 공통된 SNP들을 추출하였다. 그리고, 각각의 SNP 위치에서 돌연변이 표현형 DNA pool 시퀀싱 데이터에서의 야생형 염기 allele 수와 돌연변이형 염기 allele 수를 측정하였다. 그리고, 전체 염기 allele 수에 대한 돌연변이형 염기 allele 수의 비율인 SNP-index를 구하였다. 엑셀 프로그램에서 SNP 5개당 SNP-index의 평균값으로 추세선을 작성하여 도식화하였다. SNP-index의 추세선이 일관되게 1에 근접한 구간을 돌연변이 표현형의 원인이 되는 유전자 변이가 위치한 구간으로 추정하였다. 이 구간에 있는 SNP들 가운데 SNP-index가 1이면서 유전자 영역에 위치한 SNP들을 추출하고 유전자 기능에 큰 영향을 미칠 것으로 판단되는 SNP를 돌연변이 표현형의 원인이 되는 SNP로 추정하였다.
Mapping
MutMap 분석 결과를 보완하기 위하여 동진벼,
dwf1 계통과
dwf1/동진 F
2집단 190개체를 대상으로 bulked segregant analysis (BSA)와 mapping을 수행하였다. F
2집단 개체들을 표현형에 따라 야생형과 돌연변이형으로 구분하고 DNA를 추출하였다. 야생형과 돌연변이형의 표현형에 대해서 같은 표현형을 가지고 있는 개체의 DNA를 10개씩 2,000ng으로 모았는데 야생형과 돌연변이형 각각의 표현형당 3개의 그룹을 만든 후 10ng/ul로 희석하여 샘플을 준비하였다. MutMap 결과 돌연변이형의 원인이 되는 SNP가 위치하는 것으로 분석된 4번 염색체에서 제한효소 인식부위에 있는 SNP들을 추출하였다. SNP 전후 염기서열 500bp씩 추출하여 총 1001bp의 염기서열로 cleaved amplified polymorphic sequence (CAPS) 마커를 제작하였다. 그리고, SNP-index가 1이면서 유전자 기능에 영향을 미칠 것으로 판단되는 SNP에서 CAPS 마커를 제작하였다. 이때 프라이머 디자인은 BatchPirmer3 1.0 (
http://probes.pw.usda.gov/batchprimer3/) 프로그램을 사용하였다. 그 결과, 4번 염색체에서 CAPS 마커 5개를 제작하여(
Table 1) BSA를 하였다. PCR (Polymerase chain reaction) 산물을 제한효소로 37℃에서 8시간 이상 절단 한 후 1.2% 또는 3% 아가로스젤에서 전기영동하였다. 또한, 돌연변이 표현형 변이 원인 유전자의 mapping을 위해서 이 마커들로 F
2집단의 개체들을 각각 genotyping하였다. F
2집단의 유전자형 데이터와 표현형 데이터를 종합하여 MapDisto 프로그램(
Lorieux 2012)을 이용해 유전자 지도를 작성하였다.
결과 및 고찰
dwf1 계통의 표현형과 분리비
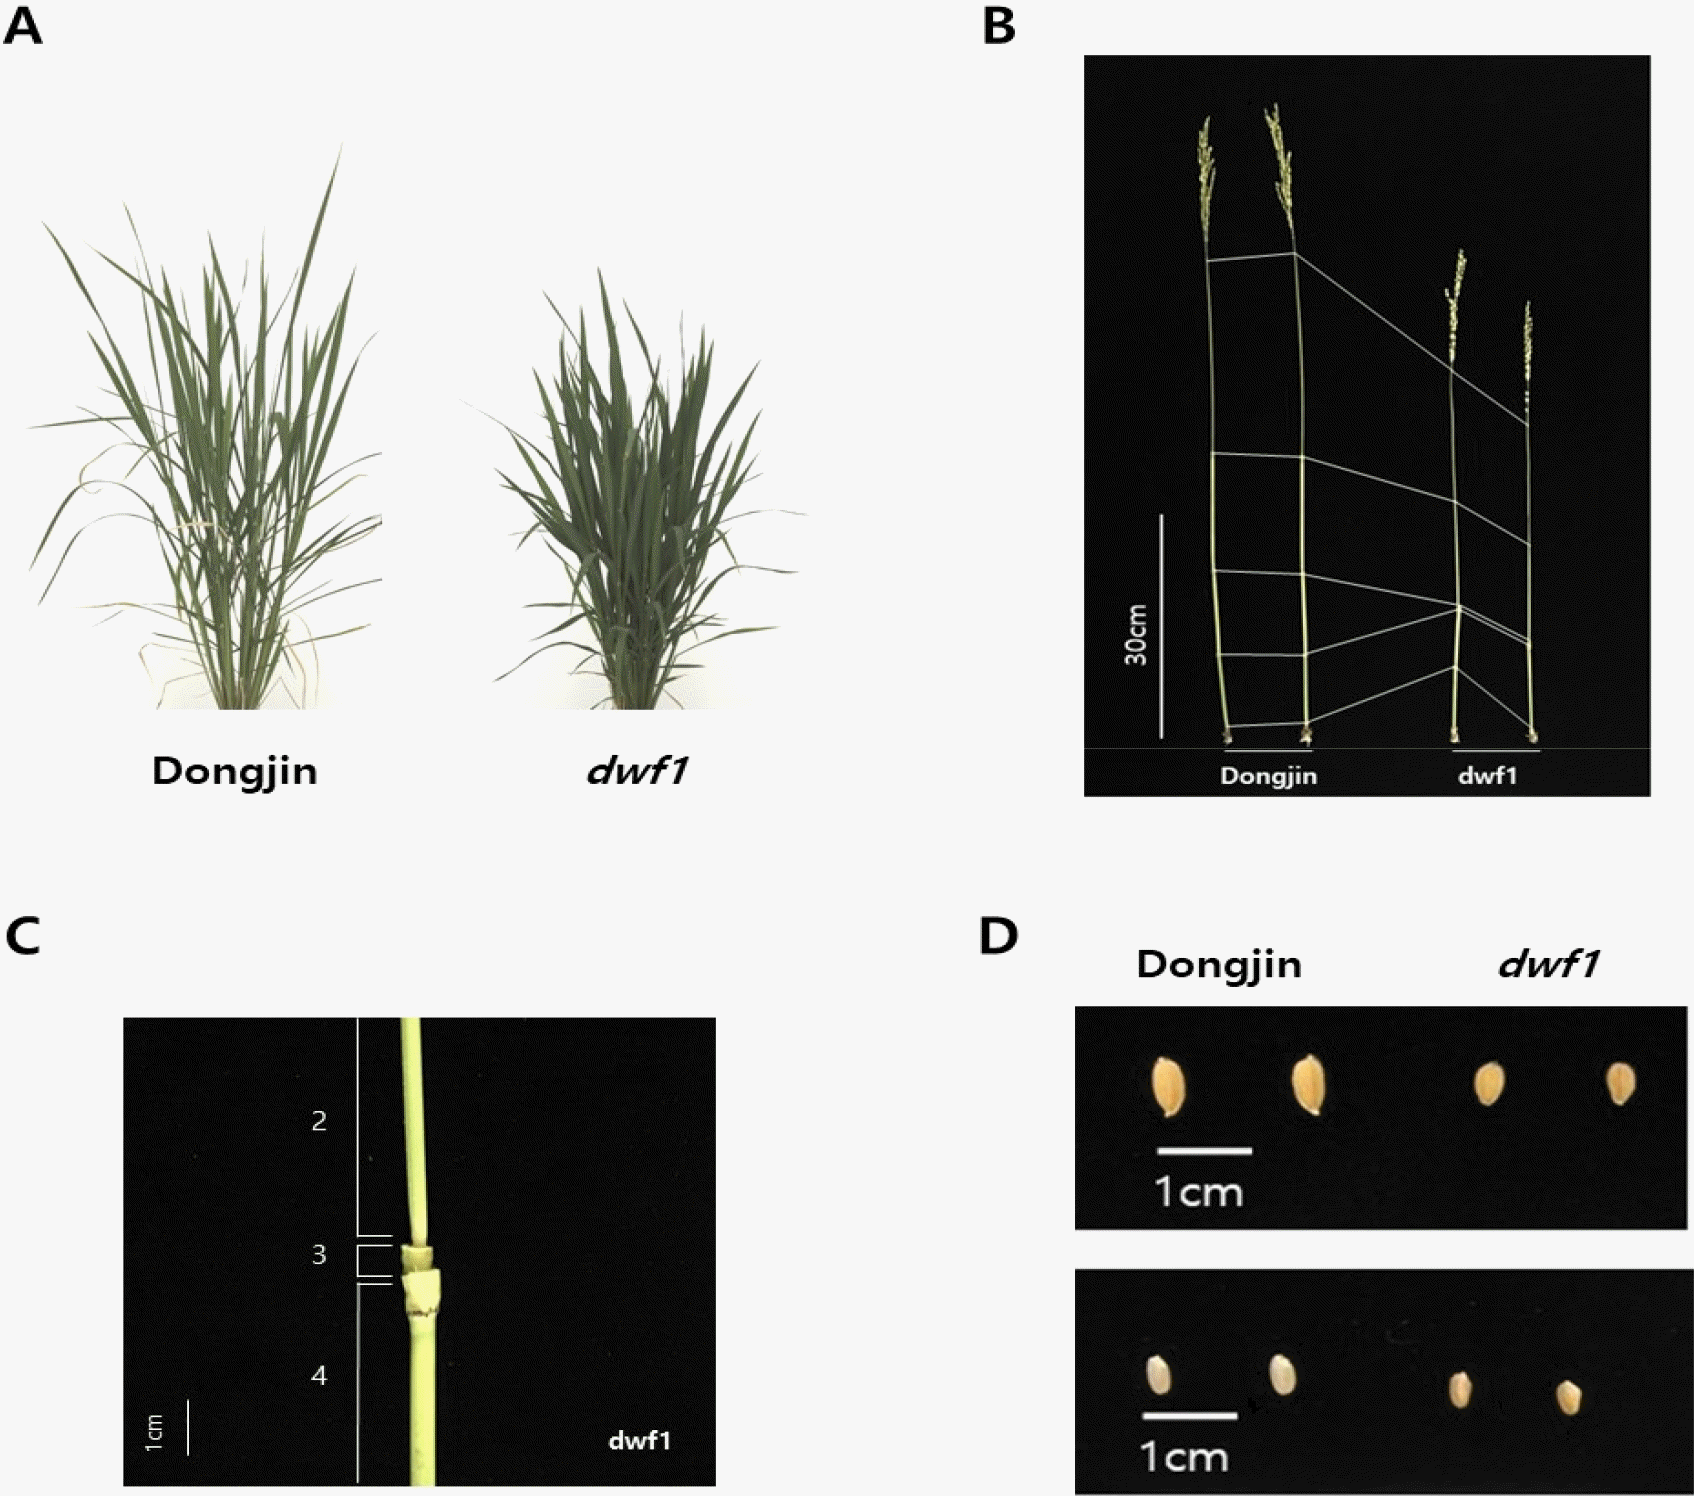
dwf1 계통의 표현형은 야생형인 동진벼에 비해서 엽색이 진한 녹색을 띄며(
Fig. 1A) 초장과 간장이 야생형인 동진벼에 비해서 더 작았다(
Fig. 1A, 1B). 그리고
dwf1 계통은 세 번째 절간의 길이가 매우 짧았다(
Fig. 1B, 1C). 종자형은 작고 둥글며(
Fig. 1D) 내영과 외영을 제거하였을 때 배유 부분이 야생형인 동진벼에 비해서 패어 있고(
Fig. 1D), 임실율이 낮았다.
dwf1 계통의 유전 분석을 위해
dwf1/동진벼 F
1, F
2와 모본을 포장과 온실에서 생육하였다.
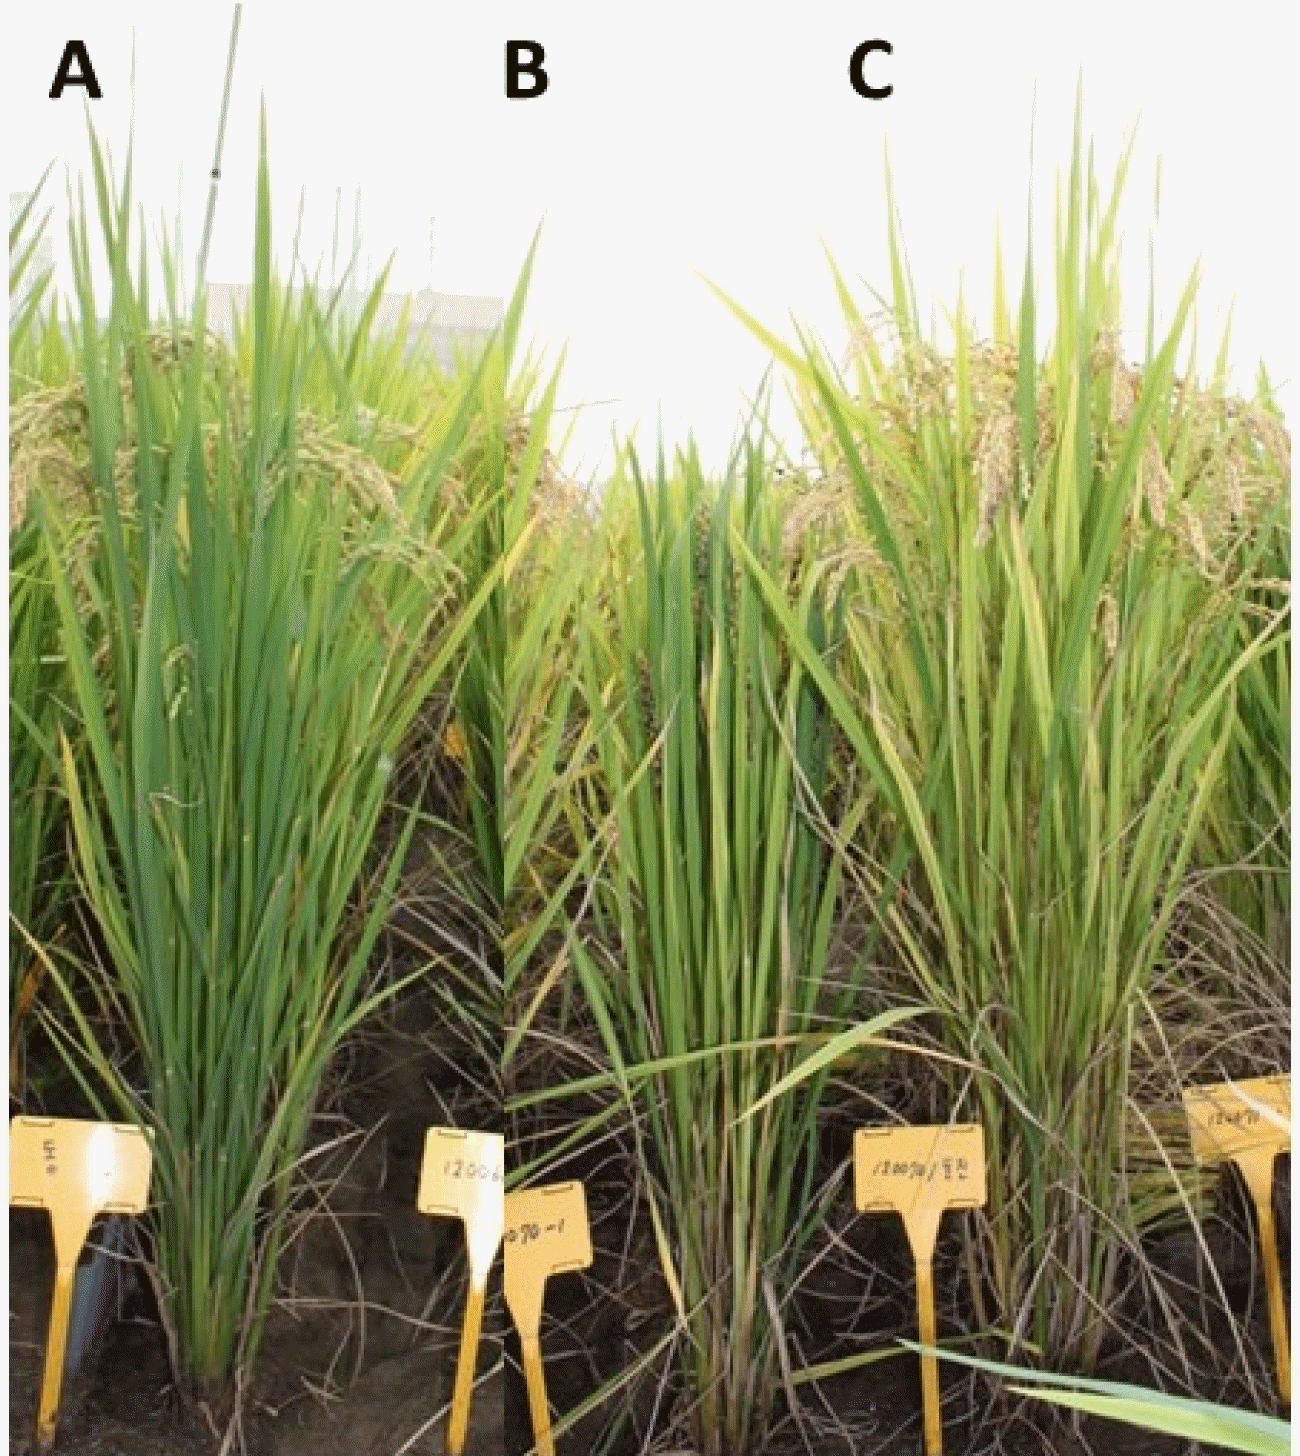
dwf1 계통에 동진벼를 교배한 F
1 식물체들은 야생형인 동진벼와 같은 표현형을 보였다(
Fig. 2).
dwf1/동진벼 F
2 집단을 포장에서 전개한 결과 야생형이 341개체, 돌여변이형이 100개체로 분리하였다. 분리비에 대한 χ2검정을 수행한 결과 χ2값이 1.150 (
p>0.05)으로 단일 유전자 분리비인 3:1에 적합하였다(
Table 2). 이 결과들에 근거하여
dwf1 계통의 표현형 변이 원인 유전자는 단일 열성 유전자임을 알 수 있었으며, 이 유전자를
dwf1 유전자로 명명하였다.
유전체 염기서열 분석
동진벼와
dwf1 계통, 그리고 동진벼와
dwf1 계통의 교대 후대 F
2 집단에서 돌연변이 표현형을 보이는 100 개체들의 DNA pool (F2MP)을 sequencing하여 생산된 데이터 양은 동진벼에서 20.7 giga base pair (Gbp)의 염기서열이었으며,
dwf1 계통에서 13.9 Gbp의 염기서열이었고, F2MP에서 29.1 Gbp의 염기서열이었다. quality trimming 이후에 남은 데이터는 동진벼에서 17.2 Gbp의 염기서열이었으며,
dwf1 계통에서 11.9 Gbp의 염기서열이었고, F2MP에서 21.4 Gbp의 염기서열이었다(
Table 3). 이 read들을 Nipponbare 표준 유전체 서열에 mapping한 결과 동진벼에서 15.0 Gbp의 염기서열이 mapping되어 40.18X의 mapping depth를 나타내었으며,
dwf1 계통에서 9.9 Gbp의 염기서열이 mapping되어 26.55X의 mapping depth를 나타내었고, F2MP에서 15.8 Gbp의 염기서열이 mapping되어 42.23X의 mapping depth를 나타내었다(
Table 3). Nipponbare 표준 유전체 염기서열에서 3개 이상의 read들이 mapping된 염기서열의 퍼센트로 구한 mapping coverage는 동진벼,
dwf1 계통, F2MP에서 각각 93.90, 94.54, 95.21%이었다(
Table 3).
Nipponbare 표준 유전체 서열에 대한 read mapping 후 SNP를 추출한 결과, 동진벼와 Nipponbare간 SNP (DJ-NP SNP)들의 개수는 225,553개이었고,
dwf1 계통과 Nipponbare간 SNP (dwf1-NP SNP)들의 개수는 185,259개이었다.
dwf1/동진 F
2 집단의 돌연변이형 DNA pool (F2MP)와 Nipponbare간 SNP (F2MP-NP SNP)는 229,176개이었다(
Table 4). DJ-NP SNP와 dwf1-NP SNP를 비교 분석한 결과, 동진벼와
dwf1 계통간 SNP (DJ-dwf1 SNP) 61,090개를 탐지하였다. 이들 가운데 homozygous SNP (DJ-dwf1 homo SNP)들을 추출하였는데 42,386개가 탐지되었다. DJ-dwf1 homo SNP와 F2MP-NP SNP를 비교하여 공통된 SNP들을 추출하였는데 이들은 29,864개이었다. 이들 SNP 위치에서 F2MP 시퀀싱 데이터에서의 야생형 염기 allele 수와 돌연변이형 염기 allele 수를 측정하였다. 그리고, 전체 염기 allele 수에 대한 돌연변이형 염기 allele 수의 비율인 SNP-index를 구하고 SNP 5개당 SNP-index의 평균값으로 추세선을 작성하여 도식화하였다.
각각의 염색체에서 많은 SNP가 발견되었지만 돌연변이 표현형의 원인이 되는 유전자의 SNP를 추출하기 위하여 SNP-index가 1에 근접한 위치를 탐색한 결과, 4번 염색체 23~30 Mbp 영역에서 SNP-의 추세선이 일관되게 1에 근접하여 돌연변이 표현형과의 높은 연관관계를 보였다(
Fig. 3). 한편, 11번 염색체 17~23 Mbp 영역과 12번 염색체 6~15 Mbp 영역에서도 SNP- index가 1인 SNP가 다수 존재했지만 이 영역에서 SNP-index 추세선의 기복이 심하여 이들 영역에서 돌연변이 표현형과의 연관이 높다고 할 수 없었다. 이 결과로
dwf1 계통 표현형의 원인 유전자는 4번 염색체 23~30 Mbp 영역에 위치하고 있음을 추정할 수 있었다. 이 영역에서 동진벼와
dwf1간 SNP (DJ-dwf1 SNP)들과 돌연변이형 F
2 개체들의 DNA pool과 Nipponbare간 SNP (F2MP-NP SNP)들에서 공통된 SNP들을 추출한 결과 33개의 SNP들이 발견되었다(
Table 5). 이들 가운데 SNP-index가 1인 SNP들의 annotation 정보를 검토한 결과, 결과 2개 유전자들(
Os04g0469800, Os04g0507000)에서 SNP-index가 1인 SNP들이 확인되었다(
Table 6).
Os04g0507000 유전자에서는 인트론 영역에서 1개의 SNP가 발생하였는데, 이 SNP는 단백질을 코딩하지 않는 인트론 영역에 있으므로 유전자 기능에 변화를 일으키지 않을 것으로 추정되었다. 반면에
Os04g0469800 유전자에서는 단백질을 코딩하는 coding sequence (CDS) 영역에서 아미노산 변화를 일으키는 non-synonymous SNP가 발견되었으며, 이 SNP는 유전자 기능에 변화를 일으킬 것으로 추정되었다.
Os04g0469800 유전자는 BRs 생합성 과정에 관여하는 Cytochrome P450 계열의 단백질을 코딩하는
D11 유전자로 보고된 바 있다(
Tanabe et al. 2005).
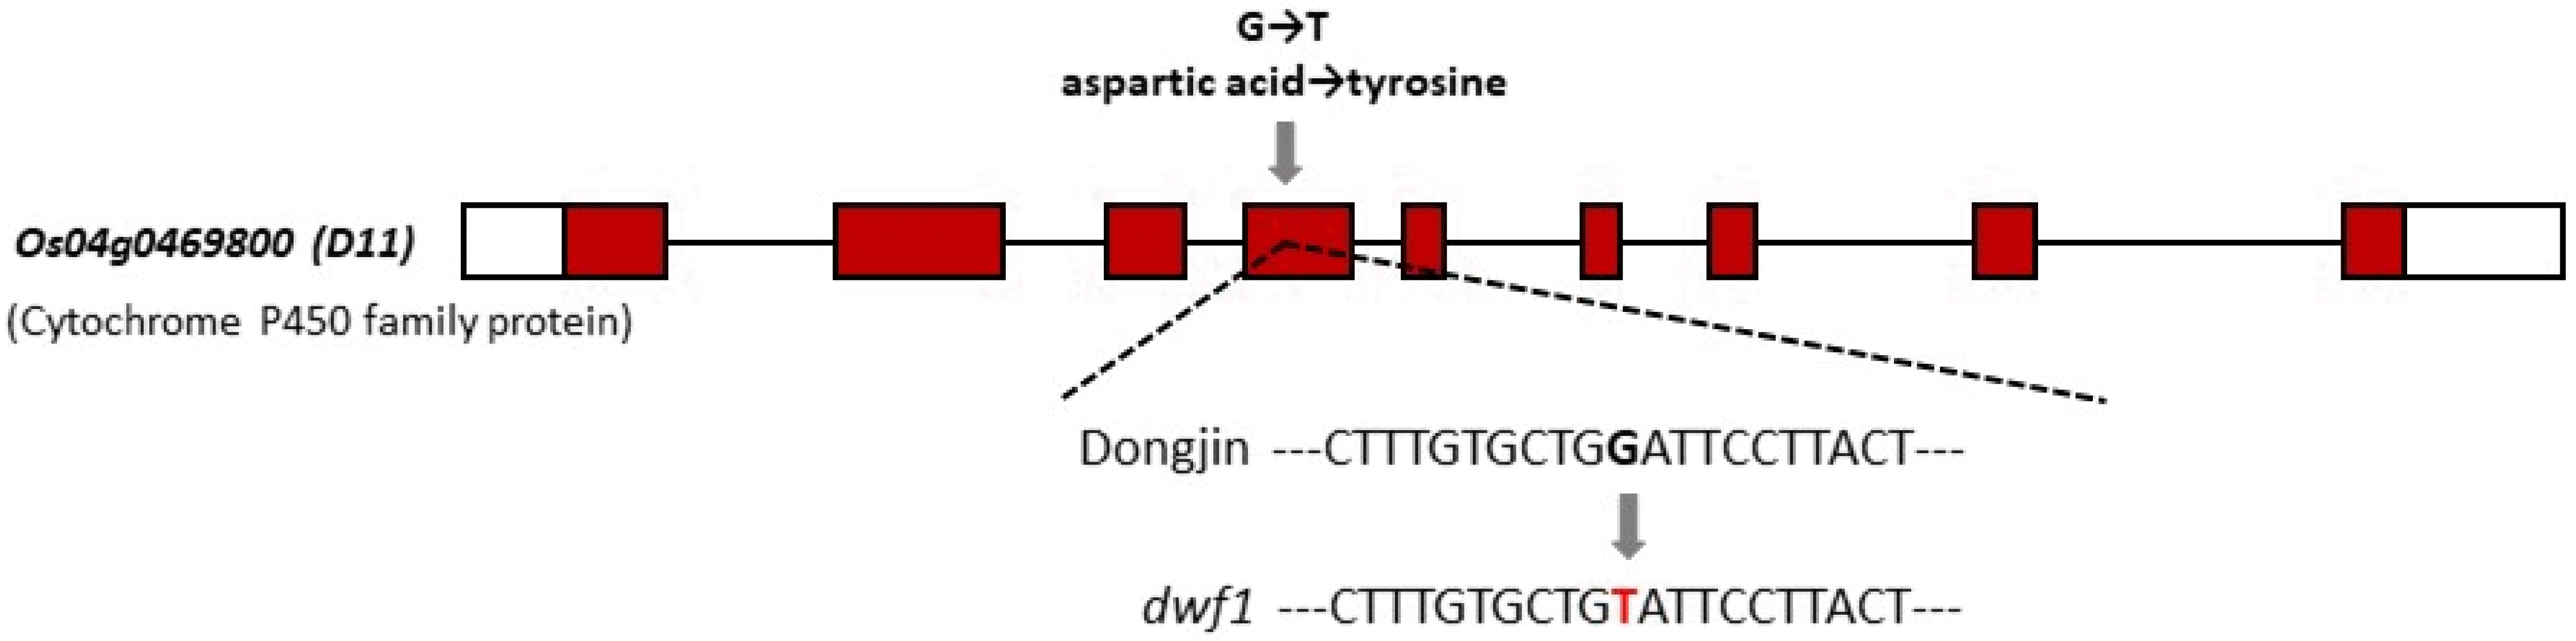
dwf1 계통에서는
D11 유전자의 4번째 exon에 존재하는 1,783번째 염기인 guanine (G)이 thymine (T)으로 변경되는 돌연변이가 일어났다(
Fig. 4). 이로 인해서
dwf1 계통에서는
D11이 코딩하는 단백질의 284번째 아미노산인 aspartic acid가 tyrosine으로 변경되는 것으로 분석되었다. 그러므로,
Os04g0469800 유전자(
D11)에서 발견된 SNP가
dwf1 계통의 돌연변이 표현형의 원인일 것으로 추정되었다.
MutMap 분석 결과를 검증하고자
dwf1/동진벼 F
2 집단을 대상으로 BSA와 mapping을 수행하였다. BSA를 진행하기 위해서 F
2 집단에서 야생형과 돌연변이형 개체들을 10개체씩 각각 3그룹으로 pooling하였다. 마커는 4번 염색체에서
dwf1 계통과 동진벼간 SNP들 가운데 제한효소 인식부위에 있는 SNP들에서 CAPS 마커 4종을 제작하였다(
Table 1). 그리고, 돌연변이 표현형의 원인으로 추정된
Os04g0469800 유전자 SNP에서 CAPS 마커인
J10402 마커를 제작하였다(
Table 1).
dwf1/동진벼 F
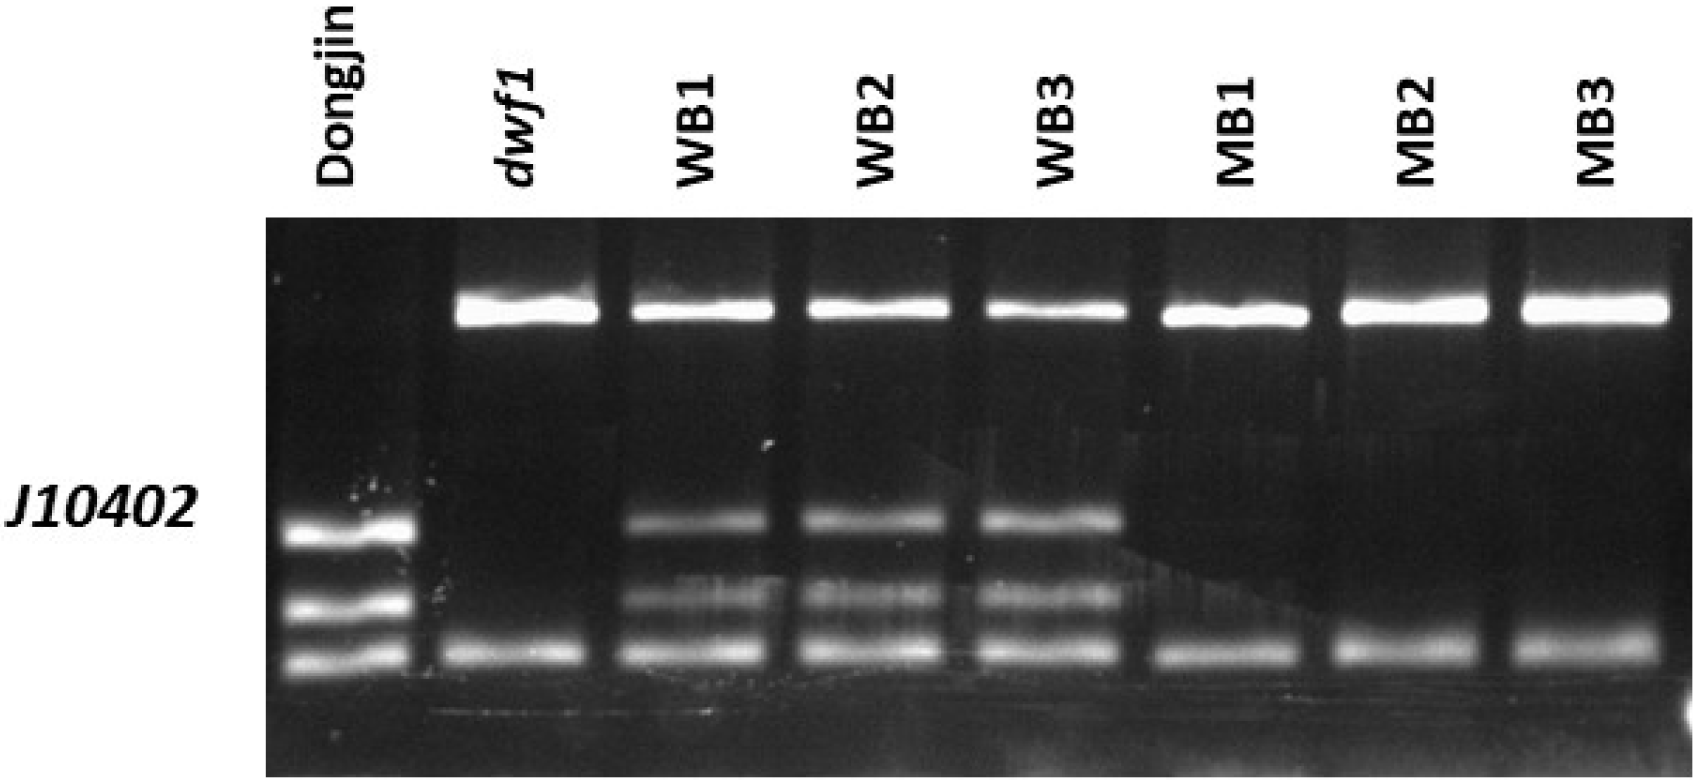
2집단에서 돌연변이형과 야생형 각각 3그룹으로 모은 DNA를 각각의 마커로 증폭한 PCR 산물에 제한효소를 처리하여 유전자형을 분석하였다. BSA 결과
J10402 마커에서 야생형인 DNA 그룹과 돌연변이형 DNA 그룹 간에 유전자형이 뚜렷하게 구분되었지만(
Fig. 5) 다른 마커들에서는 야생형인 DNA 그룹과 돌연변이형 DNA 그룹이 뚜렷하게 구분되지 않았다. 이 결과
dwf1 유전자가
J10402 마커 부위에 존재할 것으로 추정되었다.
BSA에 사용된 마커들로
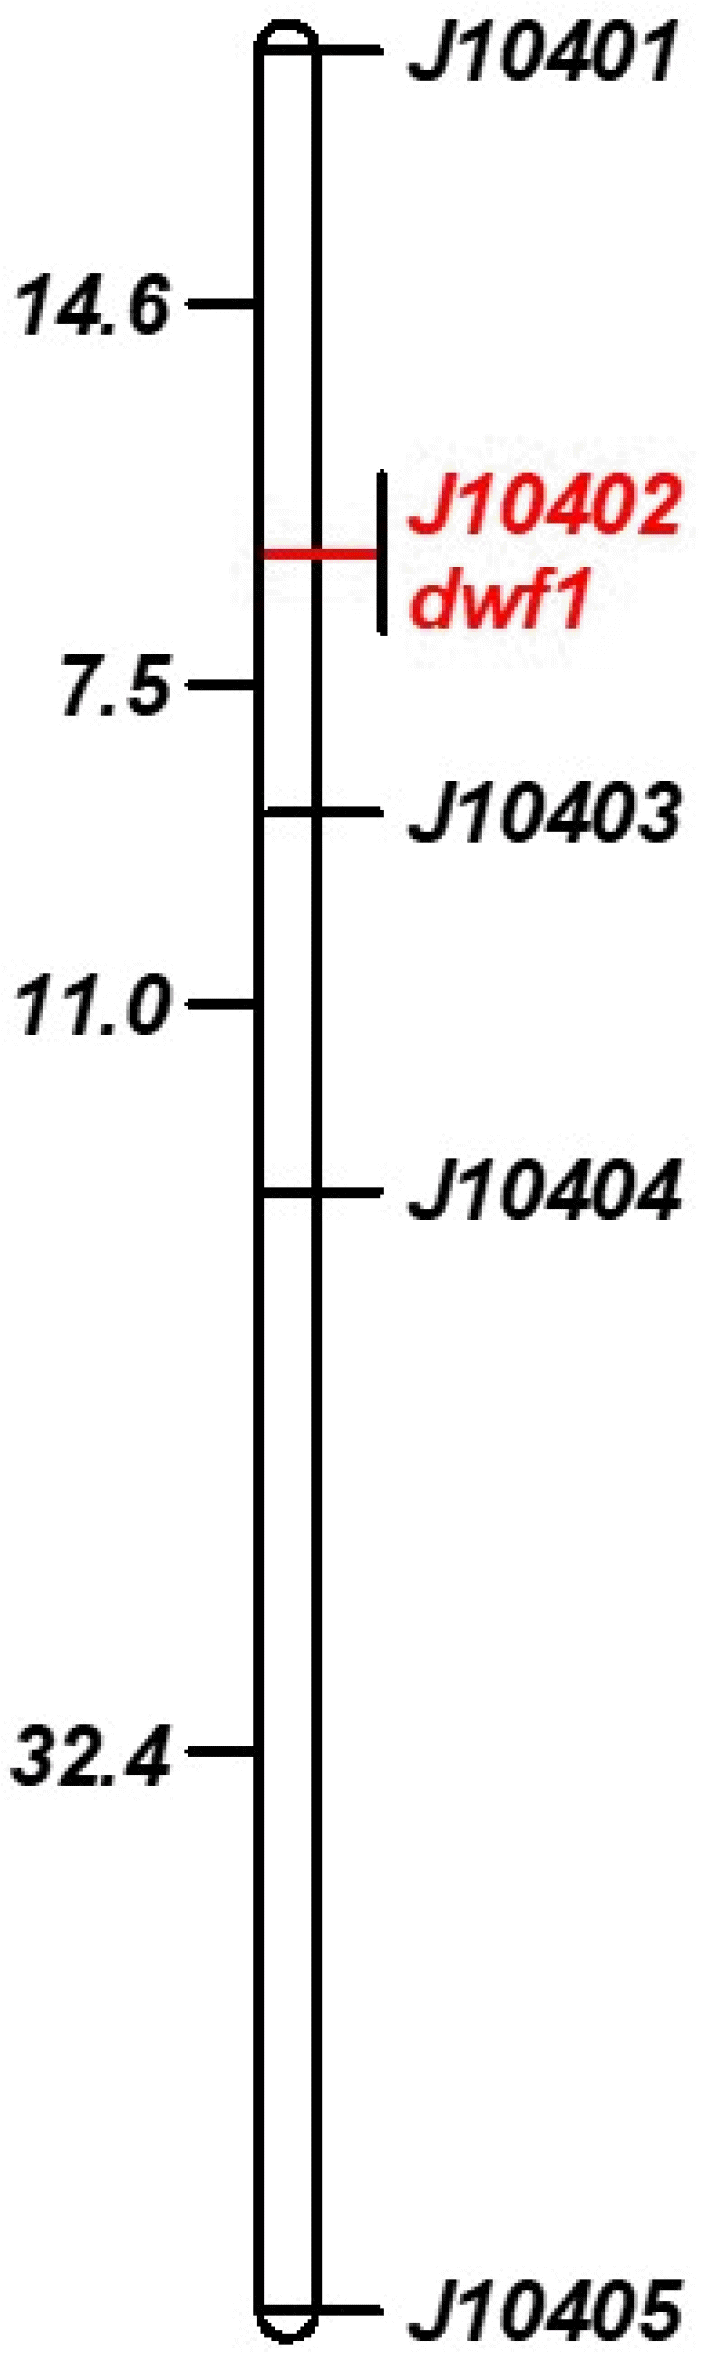
dwf1/동진 F
2집단 190개체의 유전자형을 분석하고 종자 표현형 데이터와 종합하여 유전 지도를 작성하였다(
Fig. 6).
dwf1/동진벼 F
2집단 190개체의 유전자형과 표현형의 비교분석 결과,
J10402 마커에서 유전자형과 표현형이 완전히 일치하여
dwf1 유전자가
J10402 마커 위치에 존재함을 알 수 있었다. 이 결과는
dwf1 유전자가
J10402 마커가 속해 있는
Os04g0469800 유전자(
D11)임을 뒷받침 해주고 있다.
dwf1 유전자는 이전에 보고되지 않은
D11 유전자의 새로운 allele이다.
D11 유전자에서
d11-1, 2, 3, 4 allele들이 보고된 바 있다(
Tanabe et al. 2005).
d11-1은 2번째 exon에서 1bp 염기 삭제,
d11-2는 7번째 exon에서 1bp 염기 삽입,
d11-3은 4번째 exon에서 C가 T로 염기 치환이 발생하였다. 그리고
d11-4는 3번째 intron의 마지막 염기가 G에서 T로 치환되고 3번째 exon에서 5bp의 염기가 삭제되었다.
dwf1 유전자에서는
D11 유전자의 4번째 exon에 존재하는 1,783번째 염기인 G가 T로 염기 치환이 발생한 것으로 기존에 보고된 allele들과 다르다.
dwf1 계통은 기존에 보고된 D11 유전자 돌연변이 계통들과 비슷한 표현형(간장 및 절간 길이 감소, 직립성 초형, 동그란 종자 모양 등)을 나타냈다. 본 연구를 통해 발굴한 신규 allele의 기능 확인을 위해 추후 야생형 D11 유전자를 dwf1 계통에 형질전환하여 돌연변이 표현형이 야생형 표현형으로 회복되는지를 검증하는 것이 필요하다. dwf1 유전자는 D11 유전자의 새로운 allele로써 이 유전자의 분자 생물학적 기능 연구와 BRs에 관련된 연구에 유용한 재료로 활용될 수 있을 것이다.
적 요
Ac/Ds 전이인자를 동진벼에 형질 전환하여 얻어진 Ac/Ds 삽입 돌연변이 집단에서 dwarf 표현형을 보이는 돌연변이 계통을 선발하고 MutMap으로 dwarf 표현형의 원인이 되는 SNP를 탐색하였다. 돌연변이 계통은 진한 엽색, 단간, 동그란 종자 모양 등의 표현형을 보였다. 이 돌연변이 계통에 야생형 원품종인 동진벼를 교배한 F1은 동진벼와 유사한 표현형을 보였으며, 후대 F2 집단에서는 야생형 개체들과 돌연변이형 개체들이 3:1로 분리하였다. 이를 통해, dwarf 표현형의 원인 유전자는 단일열성유전자임을 알 수 있었고, 이 유전자를 dwf1으로 명명하였다. 동진벼와 dwf1 계통을 resequencing한 결과 동진벼와 dwf1 계통간 homogeneous SNP들이 42,386개 추출되었다. MutMap을 수행하기 위하여 dwf1/동진벼 F2 집단에서 돌연변이형 100 개체들의 DNA를 pooling하여 resequencing하였다. MutMap 분석 결과 SNP-index가 일관되게 1에 가까이 나타난 영역이 4번 염색체의 23~30 Mbp 영역이었고, 이 영역에서 SNP-index가 1인 SNP들의 annotation 정보를 조사한 결과, Os04g0469800 유전자의 단백질을 코딩하는 CDS 영역에서 아미노산 변화를 일으키는 non-synonymous SNP가 발견되었다. 이 유전자는 brassinosteroids (BRs) 생합성 과정에 관여하는 Cytochrome P450 계열의 단백질을 코딩하는 D11 유전자로 보고된 바 있으며, dwf1 계통에서는 D11 유전자의 4번째 exon에 존재하는 1,783번째 염기인 guanine (G)이 thymine (T)으로 변경되는 돌연변이가 일어났다. 이로 인해서 dwf1 계통에서는 D11이 코딩하는 단백질의 284번째 아미노산인 aspartic acid가 tyrosine으로 변경되는 것으로 분석되었다. dwf1/동진벼 F2 집단을 대상으로 bulked segregant analysis (BSA)와 mapping을 수행한 결과, Os04g0469800 유전자(D11) SNP에서 제작한 J10402 마커 유전자형과 표현형이 완전히 일치하여 Os04g0469800 유전자(D11) SNP가 dwf1 계통의 표현형 변이 원인인 것으로 추정하였다. dwf1 유전자는 D11 유전자의 새로운 대립유전자로써 이 유전자의 분자 생물학적 기능 연구와 BRs에 관련된 연구에 유용한 재료로 활용될 수 있을 것이다.
사 사
본 논문은 농촌진흥청 연구사업(과제번호: PJ01246802)의 지원에 의해 이루어진 것임.
Fig. 1Phenotype comparison between Dongjin plants and dwf1 mutants. (A) Plant architecture. dwf1 mutant line showed phenotypes of dense green leaf color and reduced plant height. These photographs were taken at 68 days after seeding. (B) Culm structure. White lines indicate location of nodes (bar: 30 cm). (C) The third internode of dwf1 is shortened remarkably (bar: 1 cm). (D) The dwf1 mutant line showed phenotypes of small and round seeds. upper part: hulled seeds. lower part: dehulled seeds.
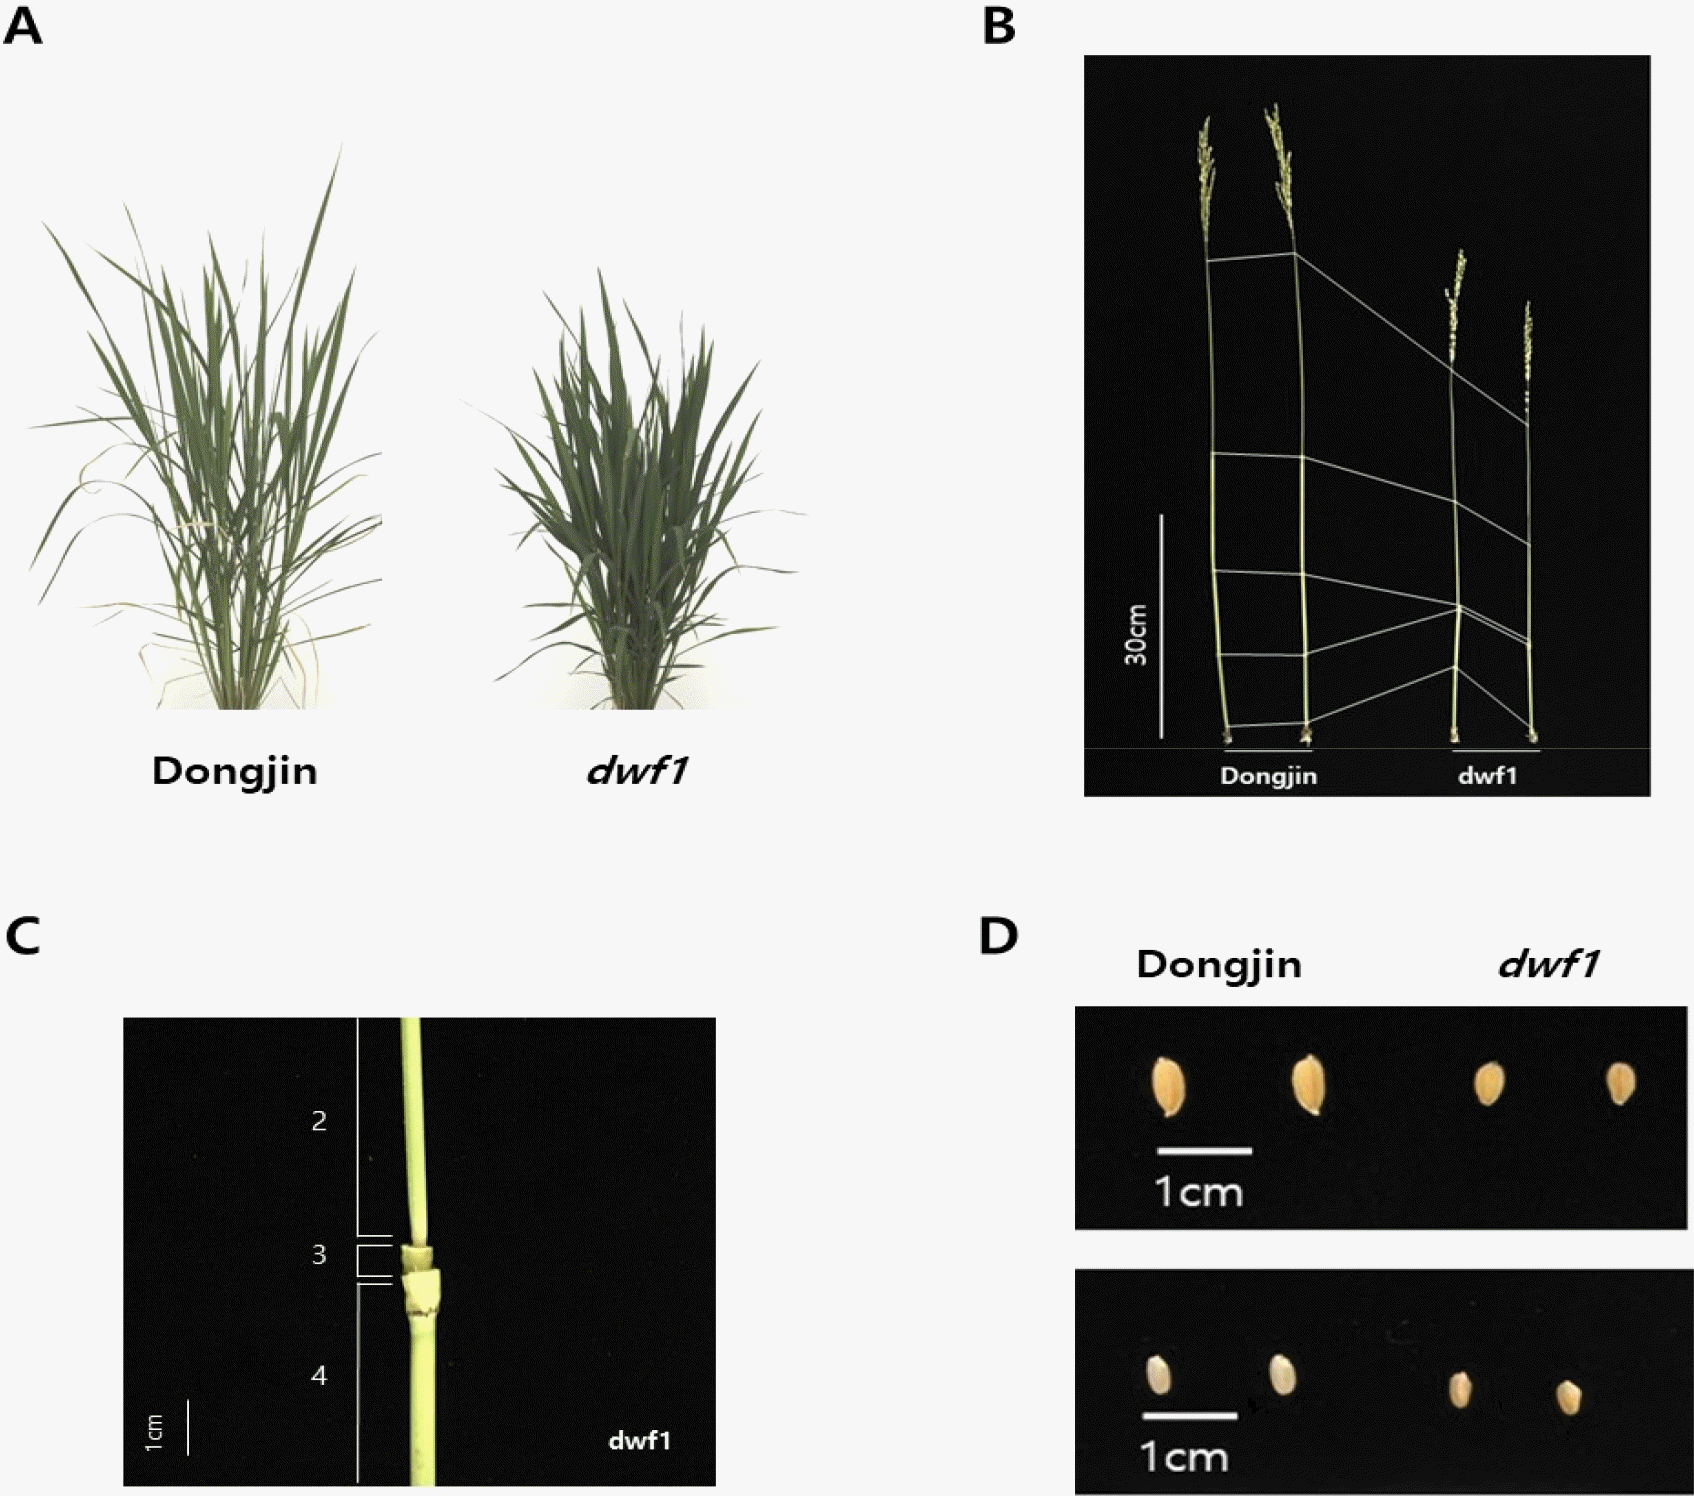
Fig. 2Phenotype of Dogjin, dwf1 mutant line and dwf1/Dongjin F1. (A) wild-type parental line (Dongjin). (B) dwf1. (C) dwf1/Dongjin F1.
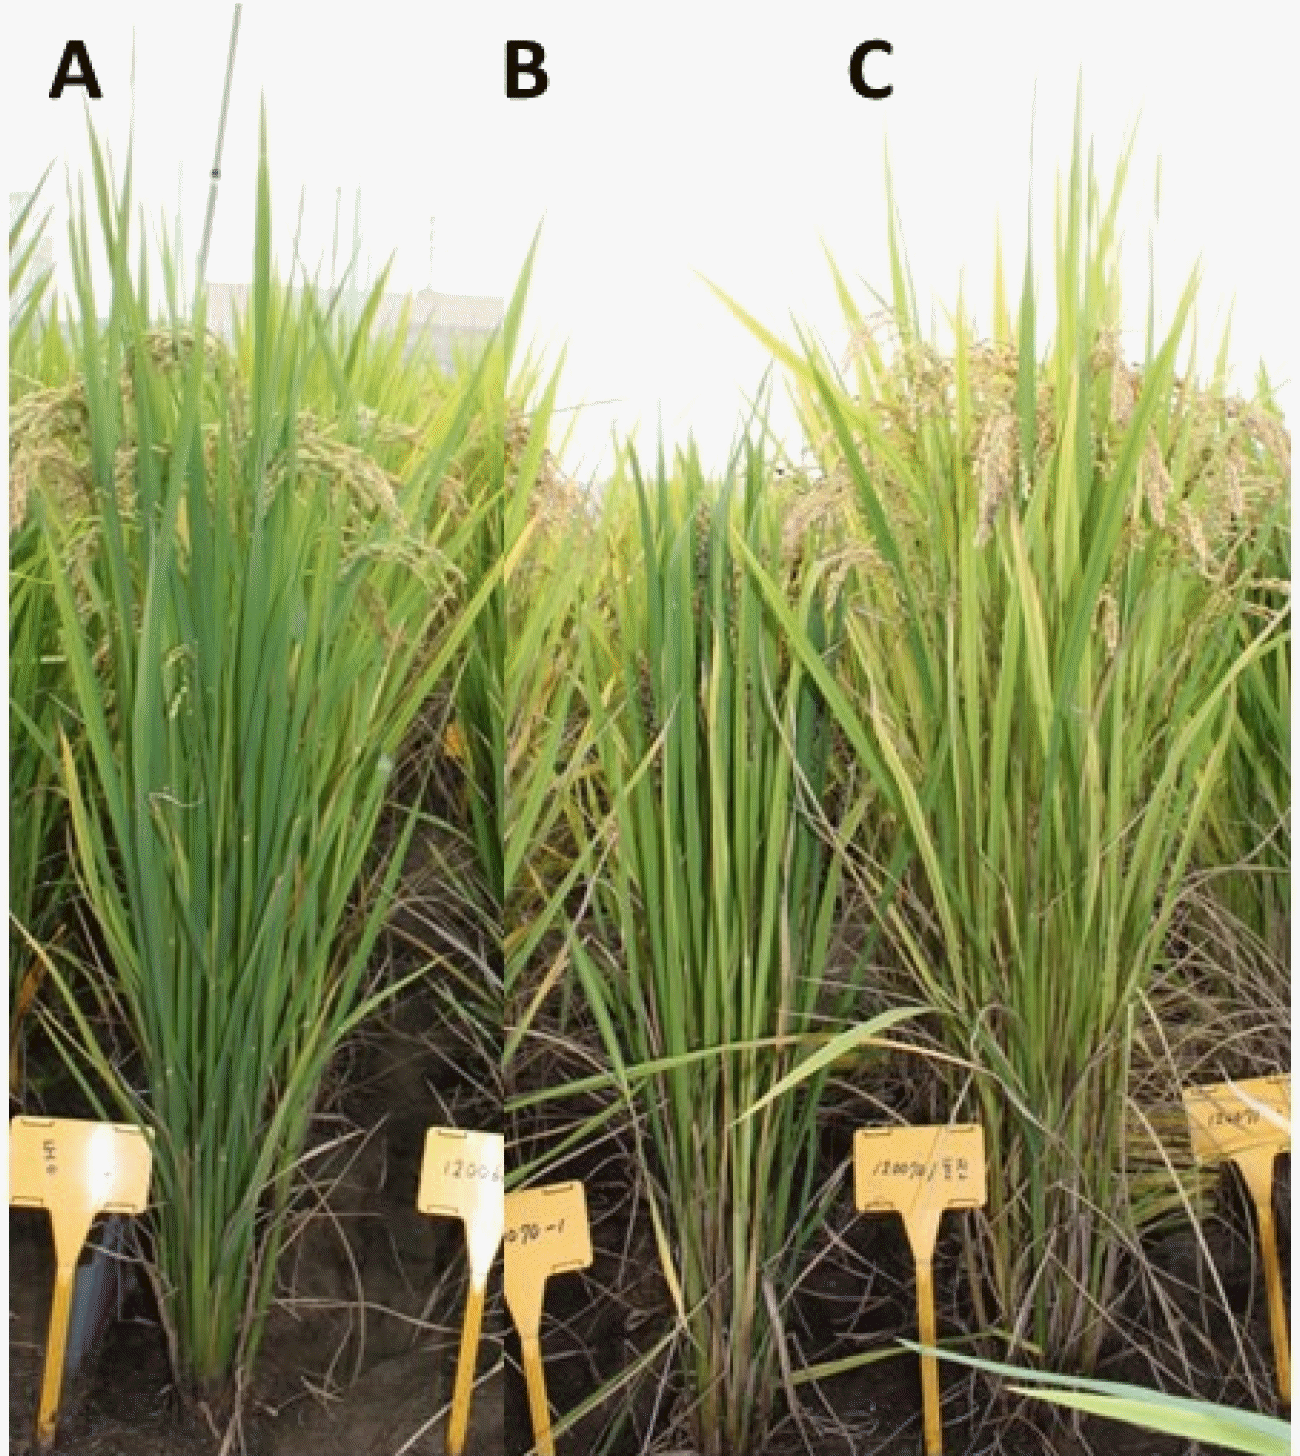
Fig. 3SNP-index graph for MutMap analysis of dwf1. Red regression lines were obtained by averaging SNP-indices from a moving window of five consecutive SNPs and shifting the window one SNP at a time. Y-axis shows SNP-index as 0~1 and X-axis is the SNP position in units of mega base pair (Mbp). The red bar of chromosome 4 indicates region including the causal SNP for the mutant phenotype.
Fig. 4Gene structure of Os04g0469800 (D11) and its mutation in dwf1. Red boxes represent exons for coding sequence, empty boxes represent untranslated regions, and lines represent introns. The mutation occurred in exon 4 changing G to T which caused amino acid change from aspartic acid to tyrosine in dwf1.
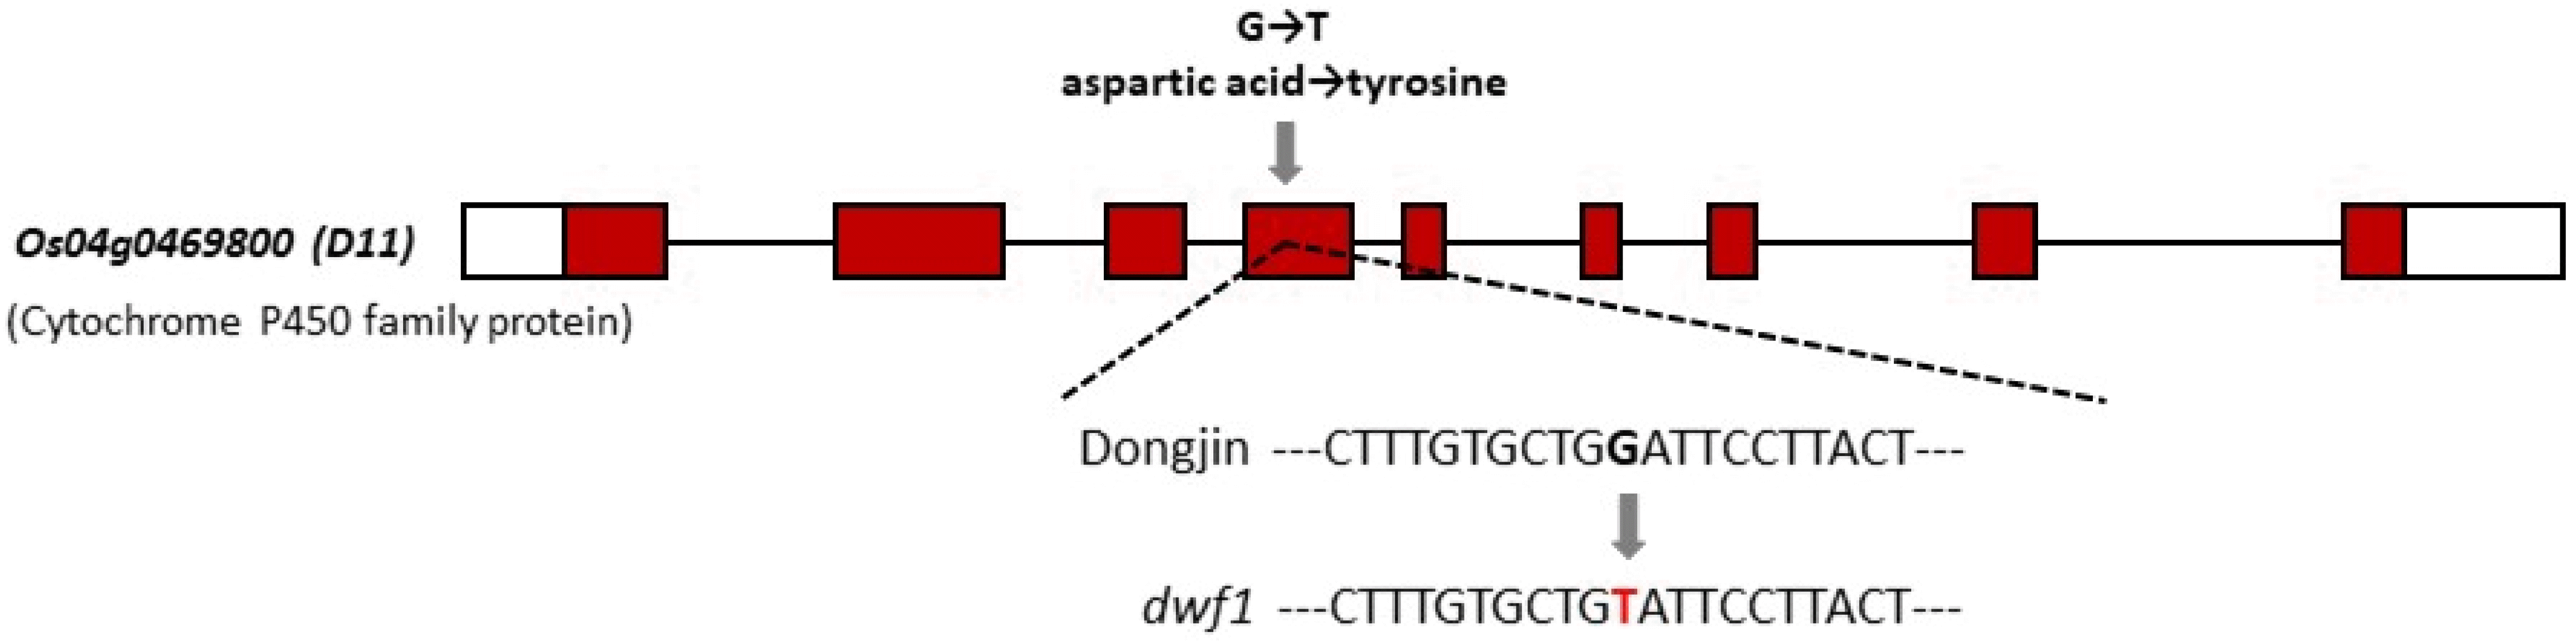
Fig. 5Result of bulked segregant analysis (BSA) with dwf1/Dongjin F2 population using J10402 marker. PCR products cut with restriction enzyme were run on 3% agarose gel. WB1-WB3: DNA bulk samples each containing DNA samples from 10 out of 30 wild type F2 plants; MB1-MB3: DNA bulk samples each including DNA samples from 10 out of 30 mutant type F2 plants.
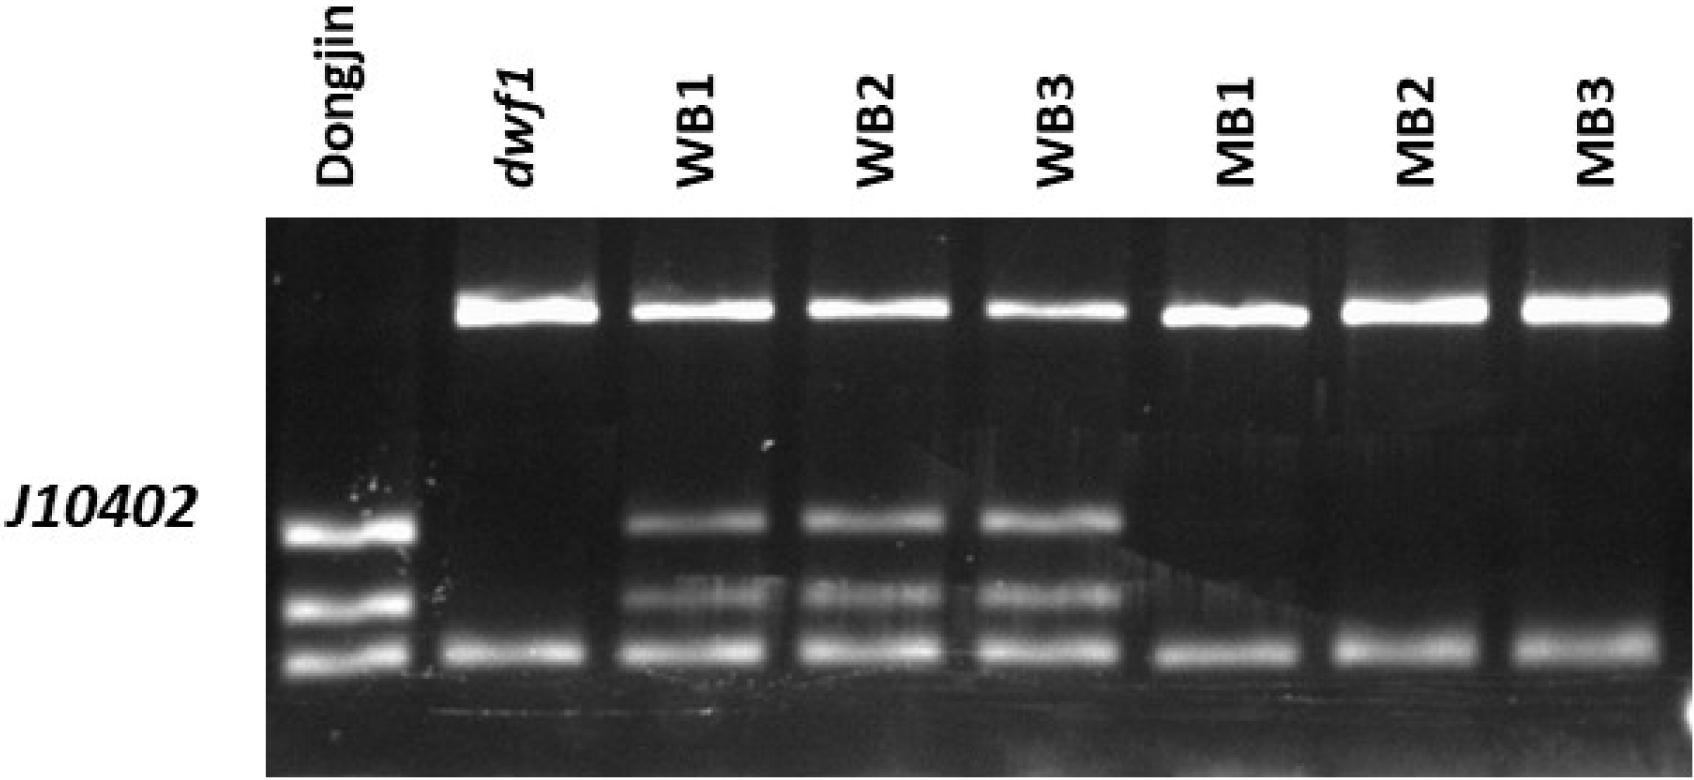
Fig. 6Linkage map of rice chromosome 4 showing the location of dwf1 gene. The gene harboring causative mutation for phenotypes of dwf1 mutant line was designated dwf1. The dwf1 gene was located at the same location with J10402 marker.
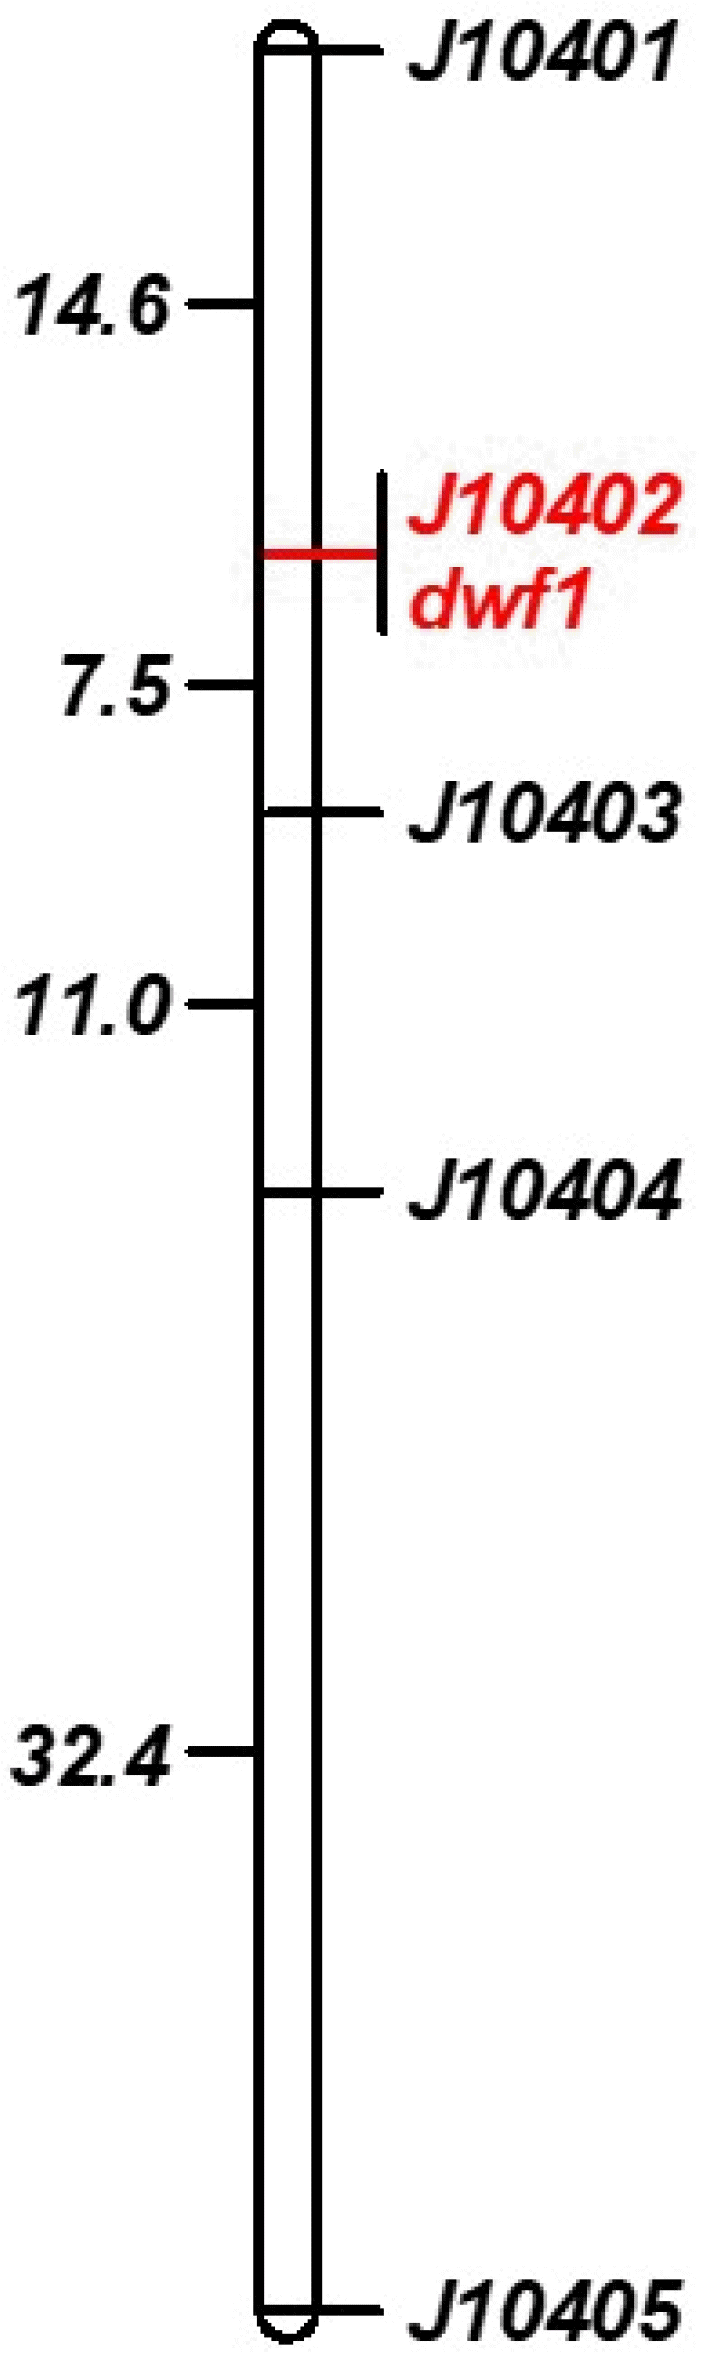
Table 1List of CAPS markers on chromosome 4 used in bulked segregant analysis and genetic mapping of dwf1.
Table 1
|
Marker name |
Position (bp) |
Primer sequence (5´ -3´) |
Restriction enzyme |
|
|
Forward sequence |
Reverse sequence |
|
J10401
|
5,112,849 |
GCAAGGTTCAAGAGCGATTC |
AGCATCAGCCTCGCTACAAC |
PvuⅡ
|
|
J10402
|
23,469,810 |
GCTCTGTCTTTTTCAGCA |
GCATGCAACTCAACATCT |
HinfⅠ
|
|
J10403
|
25,851,000 |
ACCTGTGTGGGAGAGGTGAG |
AGATCGATCGTTTTGCTTGC |
FokⅠ
|
|
J10404
|
28,260,138 |
TCAGGATTGGAGGGAAAAGA |
TTTCCTGCCCCTGCATATAA |
ClaⅠ
|
|
J10405
|
33,484,779 |
CGTCGATTTTAATCGGTCGT |
CTCGCTGGCTCACATATTCC |
AluⅠ
|
Table 2Phenotype segregation of F2 plants derived from crosses between Dongjin and dwf1 mutant line.
Table 2
|
Cross combination |
No. of F2 plants |
χ2 (3:1) |
P value |
|
|
Wild type |
Mutant type |
|
dwf1/Dongjin |
341 |
100 |
1.150 |
0.284 |
Table 3Summary of sequence data amount.
Table 3
|
|
raw sequencing data |
after quality trimming (Q20) |
after read mapping |
|
|
|
|
nucleotides (Gbp) |
nucleotides (Gbp) |
sequencing depth (X) |
nucleotides (Gbp) |
average mapping depth (X) |
Covered 3+ sites (Mbp)z
|
mapping coverage (%)y
|
|
Dongjin |
20.7 |
17.2 |
46.13 |
15.0 |
40.18 |
350.5 |
93.90 |
|
dwf1
|
13.9 |
11.9 |
31.83 |
9.9 |
26.55 |
352.9 |
94.54 |
|
dwf1/Dongjin F2MPx
|
29.1 |
21.4 |
57.43 |
15.8 |
42.23 |
355.4 |
95.21 |
Table 4Number of detected SNPs on chromosomes.
Table 4
|
Chromosome |
Comparison pairz
|
|
|
DJ-NP SNP |
dwf1-NP SNP |
DJ-dwf1* SNP |
DJ-dwf1homo SNP |
F2MP-NP SNP |
DJ-dwf1 homo SNP-F2MP common |
|
1 |
5,020 |
4,974 |
2,231 |
548 |
5,180 |
406 |
|
2 |
5,702 |
5,107 |
2,626 |
1,310 |
5,913 |
1,014 |
|
3 |
2,150 |
2,093 |
1,216 |
159 |
2,085 |
119 |
|
4 |
15,613 |
10,902 |
6,805 |
5,045 |
15,376 |
3,303 |
|
5 |
12,702 |
2,690 |
11,931 |
10,467 |
10,642 |
7,360 |
|
6 |
9,449 |
9,072 |
1,650 |
374 |
9,824 |
319 |
|
7 |
24,303 |
20,384 |
5,705 |
4,072 |
24,904 |
2,950 |
|
8 |
12,500 |
3,231 |
10,768 |
9,126 |
10,183 |
6,365 |
|
9 |
3,713 |
6,820 |
6,875 |
5,826 |
7,280 |
4,571 |
|
10 |
11,851 |
7,961 |
5,631 |
3,894 |
11,022 |
2,532 |
|
11 |
56,185 |
52,226 |
2,759 |
674 |
58,574 |
337 |
|
12 |
66,365 |
59,799 |
2,893 |
891 |
68,193 |
588 |
|
Total |
225,553 |
185,259 |
61,090 |
42,386 |
229,176 |
29,864 |
Table 5List of SNPs in the dwf1 target region and their SNP-index.
Table 5
|
Position |
Reference nucleotide |
Dongjin nucleotide |
dwf1 nucleotide |
No. of Dongjin allelesz
|
No. of dwf1 allelesy
|
SNP-index |
|
23,469,810 |
C |
C |
A |
0 |
55 |
1.00 |
|
23,546,254 |
T |
T |
A |
1 |
35 |
0.97 |
|
23,637,440 |
T |
T |
G |
41 |
472 |
0.92 |
|
24,652,472 |
- |
- |
A (Ins)x
|
4 |
16 |
0.80 |
|
24,787,274 |
G |
G |
A |
2 |
30 |
0.94 |
|
25,328,061 |
T |
T |
A |
0 |
44 |
1.00 |
|
25,423,834 |
A |
A |
T |
1 |
45 |
0.98 |
|
25,851,000 |
G |
G |
A |
6 |
48 |
0.89 |
|
25,970,046 |
T |
T |
A |
10 |
31 |
0.76 |
|
26,040,458 |
C |
C |
T |
3 |
39 |
0.93 |
|
26,045,753 |
T |
T |
A |
1 |
53 |
0.98 |
|
26,130,501 |
T |
T |
C |
4 |
50 |
0.93 |
|
26,310,900 |
A |
A |
T |
5 |
27 |
0.84 |
|
26,385,509 |
A |
A |
C |
7 |
48 |
0.87 |
|
26,539,330 |
A |
A |
T |
4 |
43 |
0.91 |
|
27,265,670 |
A |
A |
T |
2 |
45 |
0.96 |
|
27,393,577 |
T |
T |
A |
7 |
23 |
0.77 |
|
27,416,635 |
- |
- |
T (Ins) |
7 |
8 |
0.53 |
|
27,423,468 |
G |
G |
A |
4 |
28 |
0.88 |
|
27,655,011 |
T |
T |
A |
10 |
27 |
0.73 |
|
27,656,683 |
G |
G |
A |
8 |
28 |
0.78 |
|
27,851,565 |
G |
G |
T |
8 |
49 |
0.86 |
|
27,865,807 |
C |
C |
A |
4 |
37 |
0.90 |
|
27,911,046 |
C |
C |
T |
1 |
39 |
0.98 |
|
28,042,325 |
G |
G |
A |
2 |
35 |
0.95 |
|
28,109,890 |
G |
G |
A |
8 |
17 |
0.68 |
|
28,151,383 |
A |
A |
T |
2 |
15 |
0.88 |
|
28,153,342 |
T |
T |
A |
7 |
39 |
0.85 |
|
28,196,188 |
A |
A |
T |
3 |
27 |
0.90 |
|
28,260,138 |
C |
C |
A |
6 |
38 |
0.86 |
|
28,334,098 |
C |
C |
T |
8 |
30 |
0.79 |
|
28,575,184 |
C |
C |
A |
1 |
19 |
0.95 |
|
29,071,503 |
G |
G |
A |
6 |
23 |
0.79 |
Table 6Detected SNPs with SNP-index of 1 in the genic region of genes located in the dwf1 target region analyzed by MutMapz.
Table 6
|
Gene ID |
Start |
Endy
|
5’ UTR |
CDS |
Intron |
3’ UTR |
sum |
Gene description |
|
|
NS |
SY |
|
Os04g0469800
|
23,467,167 |
23,471,592 |
|
1 |
|
|
|
1 |
Cytochrome P450 family protein (D11) |
|
Os04g0507000
|
25,323,826 |
25,340,028 |
|
1 |
1 |
Similar to DNA mismatch repair protein. |
References
- 1. Abe A, Kosugi S, Yoshida K, Natsume S, Takagi H, Kanzaki H, Matsumura H, Yoshida K, Mitsuoka C, Tamiru M, Innan H, Cano L, Kamoun S, Terauchi R. 2012. Genome sequencing reveals agronomically important loci in rice using mutmap. Nat Biotechnol 30: 174-178.
- 2. Chin HG, Choe MS, Lee SH, Park SH, Park SH, Koo JC, Kim NY, Lee JJ, Oh BG, Yi GH, Kim SC, Choi HC, Cho MJ, Han CD. 1999. Molecular analysis of rice plants harboring an ac/ds transposable element-mediated gene trapping system. Plant J 19: 615-623.
- 3. Clouse SD, Sasse JM. 1998. Brassinosteroids: Essential regulators of plant growth and development. Annu Rev Plant Physiol Plant Mol Biol 49: 427-451.
- 4. Dhaubhadel S, Browning KS, Gallie DR, Krishna P. 2002. Brassinosteroid functions to protect the translational machinery and heat-shock protein synthesis following thermal stress. Plant J 29: 681-691.
- 5. Fekih R, Takagi H, Tamiru M, Abe A, Natsume S, Yaegashi H, Sharma S, Sharma S, Kanzaki H, Matsumura H, Saitoh H, Mitsuoka C, Utsushi H, Uemura A, Kanzaki E, Kosugi S, Yoshida K, Cano L, Kamoun S, Terauchi R. 2013. Mutmap+: Genetic mapping and mutant identification without crossing in rice. Plos One 8: e68529.
- 6. Fujioka S, Yokota T. 2003. Biosynthesis and metabolism of brassinosteroids. Annu Rev Plant Biol 54: 137-164.
- 7. Hong Z, Ueguchi-Tanaka M, Fujioka S, Takatsuto S, Yoshida S, Hasegawa Y, Ashikari M, Kitano H, Matsuoka M. 2005. The rice brassinosteroid-deficient dwarf2 mutant, defective in the rice homolog of arabidopsis diminuto/dwarf1, is rescued by the endogenously accumulated alternative bioactive brassinosteroid, dolichosterone. Plant Cell 17: 2243-2254.
- 8. Hong Z, Ueguchi-Tanaka M, Shimizu-Sato S, Inukai Y, Fujioka S, Shimada Y, Takatsuto S, Agetsuma M, Yoshida S, Watanabe Y, Uozu S, Kitano H, Ashikari M, Matsuoka M. 2002. Loss-of-function of a rice brassinosteroid biosynthetic enzyme, c-6 oxidase, prevents the organized arrangement and polar elongation of cells in the leaves and stem. Plant J 32: 495-508.
- 9. Hong Z, Ueguchi-Tanaka M, Umemura K, Uozu S, Fujioka S, Takatsuto S, Yoshida S, Ashikari M, Kitano H, Matsuoka M. 2003. A rice brassinosteroid-deficient mutant, ebisu dwarf (d2), is caused by a loss of function of a new member of cytochrome p450. Plant Cell 15: 2900-2910.
- 10. Kim CM, Piao HL, Park SJ, Chon NS, Je BI, Sun B, Park SH, Park JY, Lee EJ, Kim MJ, Chung WS, Lee KH, Lee YS, Lee JJ, Won YJ, Yi G, Nam MH, Cha YS, Yun DW, Eun MY, Han CD. 2004. Rapid, large-scale generation of ds transposant lines and analysis of the ds insertion sites in rice. Plant J 39: 252-263.
- 11. Lorieux M. 2012. Mapdisto: Fast and efficient computation of genetic linkage maps. Mol Breeding 30: 1231-1235.
- 12. Mori M, Nomura T, Ooka H, Ishizaka M, Yokota T, Sugimoto K, Okabe K, Kajiwara H, Satoh K, Yamamoto K, Hirochika H, Kikuchi S. 2002. Isolation and characterization of a rice dwarf mutant with a defect in brassinosteroid biosynthesis. Plant Physiol 130: 1152-1161.
- 13. Mussig C. 2005. Brassinosteroid-promoted growth. Plant Biology 7: 110-117.
- 14. Peng JR, Richards DE, Hartley NM, Murphy GP, Devos KM, Flintham JE, Beales J, Fish LJ, Worland AJ, Pelica F, Sudhakar D, Christou P, Snape JW, Gale MD, Harberd NP. 1999. Green revolution' genes encode mutant gibberellin response modulators. Nature 400: 256-261.
- 15. Ray DK, Mueller ND, West PC, Foley JA. 2013. Yield trends are insufficient to double global crop production by 2050. Plos One 8: e66428.
- 16. Sakamoto T, Morinaka Y, Ohnishi T, Sunohara H, Fujioka S, Ueguchi-Tanaka M, Mizutani M, Sakata K, Takatsuto S, Yoshida S, Tanaka H, Kitano H, Matsuoka M. 2006. Erect leaves caused by brassinosteroid deficiency increase biomass production and grain yield in rice. Nat Biotechnol 24: 105-109.
- 17. Szekeres M, Nemeth K, KonczKalman Z, Mathur J, Kauschmann A, Altmann T, Redei GP, Nagy F, Schell J, Koncz C. 1996. Brassinosteroids rescue the deficiency of cyp90, a cytochrome p450, controlling cell elongation and de-etiolation in arabidopsis. Cell 85: 171-182.
- 18. Takagi H, Abe A, Yoshida K, Kosugi S, Natsume S, Mitsuoka C, Uemura A, Utsushi H, Tamiru M, Takuno S, Innan H, Cano LM, Kamoun S, Terauchi R. 2013a. Qtl-seq: Rapid mapping of quantitative trait loci in rice by whole genome resequencing of DNA from two bulked populations. Plant J 74: 174-183.
- 19. Takagi H, Uemura A, Yaegashi H, Tamiru M, Abe A, Mitsuoka C, Utsushi H, Natsume S, Kanzaki H, Matsumura H, Saitoh H, Yoshida K, Cano LM, Kamoun S, Terauchi R. 2013b. Mutmap-gap: Whole-genome resequencing of mutant f2 progeny bulk combined with de novo assembly of gap regions identifies the rice blast resistance gene pii. New Phytol 200: 276-283.
- 20. Tanabe S, Ashikari M, Fujioka S, Takatsuto S, Yoshida S, Yano M, Yoshimura A, Kitano H, Matsuoka M, Fujisawa Y, Kato H, Iwasaki Y. 2005. A novel cytochrome p450 is implicated in brassinosteroid biosynthesis via the characterization of a rice dwarf mutant, dwarf11, with reduced seed length. Plant Cell 17: 776-790.
- 21. Wu CY, Trieu A, Radhakrishnan P, Kwok SF, Harris S, Zhang K, Wang J, Wan J, Zhai H, Takatsuto S, Matsumoto S, Fujioka S, Feldmann KA, Pennell RI. 2008. Brassinosteroids regulate grain filling in rice. Plant Cell 20: 2130-2145.
- 22. Wu W, Zhang Q, Ervin EH, Yang Z, Zhang X. 2017. Physiological mechanism of enhancing salt stress tolerance of perennial ryegrass by 24-epibrassinolide. Front Plant Sci 8: 1017
- 23. Yamamuro C, Ihara Y, Wu X, Noguchi T, Fujioka S, Takatsuto S, Ashikari M, Kitano H, Matsuoka M. 2000. Loss of function of a rice brassinosteroid insensitive1 homolog prevents internode elongation and bending of the lamina joint. Plant Cell 12: 1591-1605.