적요
To determine whether Fourier-transform infrared (FT-IR) spectral analysis based on multivariate analysis for whole-cell extracts can be used to discriminate different countries of Perilla seeds at the metabolic level, leaves of Perilla seeds were subjected to FT-IR spectroscopy. FT-IR spectral data of leaves were analyzed by principal component analysis (PCA), partial least square discriminant analysis (PLS-DA), and hierarchical clustering analysis (HCA). FT-IR spectra confirmed typical spectral differences between frequency regions of 1,700-1,500, 1,500-1,300, and 1,100-950 cm-1. These spectral regions reflect the quantitative and qualitative variations of amide I, II in amino acids and proteins (1,700-1,500 cm-1), phosphodiester groups in nucleic acids and phospholipids (1,500-1,300 cm-1), and carbohydrates (1,100-950 cm-1). PCA revealed separate clusters corresponding to their country relationship. Thus, PCA could be used to distinguish between countries of origin with different metabolite contents. And PLS-DA showed a similar country classification of Perilla seeds. Furthermore, these metabolic discrimination systems could be used for the rapid selection and classification of useful field crop cultivars.
서 언
들깨는 꿀풀과에 속하는 유료작물 중 하나로 생육기간이 짧고, 재배지 토양에 대한 적응성이 높아 혼작과 윤작이 가능한 중요 작물로 평가되고 있다(
Choung 2005). 들깨 종실에는 약 44%의 지질을 함유하고 있으며, 그 중 체내에서 생성되지 못하여 필수로 섭취해야 하는 오메가-3계 지방산이면서 고혈압, 항산화, 인지기능 개선, 항알러지 등의 다양한 기능성 효과를 갖는다고 알려진 알파-리놀렌산이 약 60% 조성되어 있다(
Kim et al. 2015,
Seong et al. 2015,
Li et al. 2017). 그 외에도 루테올린, 로즈마린산, 폴리코사놀 등의 다양한 기능성 물질을 함유하고 있어 건강 기능성 식품으로의 주목도가 높아지고 있다(
Lee et al. 2017,
Lee et al. 2020a). 이에 따라 들깨에 대한 소비는 확대되고 있지만, 재배환경을 통한 들깨의 특성에 대한 연구는 거의 이루어지지 않았다(
Gu et al. 2019).
원산지 판별은 수입 개방화 추세에 국내 생산자와 소비자 보호를 위해 공정한 유통질서를 확립하고자 실시되고 있다. 또한, 수입 농산물과 국산 농산물의 가격차이와 육안식별이 어려움에 따라 원산지를 허위 표시하는 경우가 나타나고 있어 원산지에 대한 불안감이 증가하고 있다. 들깨(
Perilla)는 동아시아를 중심으로 착유를 통해 기름을 얻는 유료작물로 소비되고 있고(
Seong et al. 2015), 특히, 한국과 중국에서 많은 생산과 소비가 이뤄지고 있다. 국내산과 중국 등의 수입산 들깨의 육안적 특성을 통한 원산지 식별은 한계가 있지만, 동일한 들깨 품종이라도 재배 조건(생육온도, 광, 생장호르몬, 무기성분, 기후변화 등)과 외부 환경변화(염류장해, 질소장해, 환경변화, 생장조절물질 등)에 따라 이차대사산물의 함량이 변화하기 때문에 이차대사산물을 이용하여 원산지 식별이 가능하다(
Akula et al. 2011).
대사체를 이용하여 시료간 양적, 질적 패턴 차이를 구명하는 대사체학 연구는 오믹스 기법의 발달을 통해 활발한 연구가 진행되고 있다. Fourier transform infrared (FT-IR) spectroscopy, proton nuclear magnetic resonance (HNMR) spectroscopy 및 mass spectrometry (MS)등의 분석 데이터를 이용하여 각종 시료의 식별과 대사체 마커 개발에 활용이 되고 있다(
Krishnan et al. 2005). FT-IR 스펙트럼 분석은 스펙트럼이 나타내는 다양한 정보를 다변량통계분석을 이용하여 신속하고 정확하게 구분할 수 있다(
Gallardo-Velázquez et al. 2009). 대사성분의 작용기작 구명과 같은 기초학문적 활용이 가능한 대사체학은 농산물의 품종, 원산지 식별과 재배연령 등의 진위 식별 그리고, 식품이나 의약품 산업의 표준화 및 안정성 관련 산업적 활용이 다양하게 이루어지고 있다. 대사체 분석의 데이터를 보다 유용한 생물학적 정보 추출에 활용하기 위하여 다변량통계분석 기법이 필수적으로 사용되고 있다. 대표적인 다변량통계분석기법은 Principal component analysis (PCA), Partial least squares discriminant (PLS-DA) 그리고 Partial least squares (PLS) regression을 주로 사용하며, Partial least squares (PLS) regression은 서로 다른 두개의 데이터를 활용하여 상관분석을 통해 다양한 예측 모델링 방법에 이용되고 있다(
Höskuldsson 1988,
Wold et al. 2001,
Bastiena et al. 2005,
Mevik & Wehrens 2007). PLS regression 기법을 이용하여 동백나무속 식물(
Camellia oleifera)에서 지방산 함량 예측 모델링(
Yuan et al. 2013), 사과, 오렌지 그리고 복숭아 주스에 함유되어 있는 carotenoid 성분 함량 예측 모델링(
Leopold et al. 2011), 버섯에 존재하는 단당류와 다당류 함량 예측 모델링(
Chen et al. 2012), 육류의 부패 및 손상에 대한 예측 모델링(
Argyri et al. 2013) 이 가능한 것으로 보고되고 있지만, 들깨 원산지 식별 예측 모델링에 활용이 없는 실정이다.
따라서 본 연구에서는 FT-IR 스펙트럼 데이터의 다변량통계분석 기법을 이용하여 들깨를 신속한 구분 및 식별 체계를 확립하고 더 나아가 들깨의 원산지 예측 모델링을 개발하여 국내산과 수입산의 신속한 선발 체계를 확립하고자 하였다.
재료 및 방법
식물재료
본 연구에서 사용된 들깨 종자는 원산지 식별을 위해 국립식량과학원 작물기초기반과에서 보유하고 있는 국산 들깨 4종을 사용하였고, 수입산 들깨 4종을 사용하였다. 실험에 사용된 재료는 품종별 3반복으로 시료를 사용하였고, 각각의 시료는 Wonder crusher, WC-3를 이용하여 분말 형태로 분쇄하였다. 분쇄된 시료는 -70°C 초저온냉동고에 보관하여 분석에 사용하였다.
들깨 whole-cell 추출물 제조
시료 분말 20 mg을 20% (v/v) methanol 200 µL에 첨가하여(1.5 mL Eppendorf tube) 시료와 용액이 잘 섞이도록 vortexing하여, 50°C water bath에서 5분 간격으로 시료를 잘 섞어주며 30분간 추출하였다. 추출된 시료는 15분간 13,000 rpm에서 원심분리 하고, 원심분리 후 상층액을 새로운 tube에 옮겼다. 추출물 찌꺼기를 완전히 제거하기 위해 다시 한번 5분간 13,000 rpm에서 원심분리하여 상층액을 새로운 tube로 옮겼다. FT-IR 스펙트럼 분석에 사용하기 위해 추출된 추출물은 -20°C에서 냉동 보관하여 사용하였다(
Song et al. 2014).
FT-IR (Fourier transform infrared) 스펙트럼 조사는 Tensor II (Bruker Optics GmbH, Ettlingen, Germany)과 DTGS (Deuterated triglycine sulfate) 검출기를 사용하였다(
Song et al. 2014). 추출된 각각의 시료는 5 µL씩 5반복으로 384-well ZnSe plate에 분주하여, 37°C hot plate에서 약 20-30분간 건조한 후 HTS-XT (Bruker Optics GmbH) 고효율 자동화 장치를 이용하여 스펙트럼을 측정하였다. 스펙트럼은 4000-400 cm
-1 범위에서 4 cm
-1 간격으로 128회 반복 측정되었고, 측정된 스펙트럼의 평균 스펙트럼을 분석에 사용하였다. Bruker 에서 제공하는 OPUS Lab (ver. 7.0, Bruker Optics Inc.)를 사용하여 FT-IR 스펙트럼 조사 및 데이터 변환을 하였고, baseline 교정을 위해 FT-IR 스펙트럼 분석 영역의 양 끝점(800-1800 cm
-1)의 흡광도를 0으로 조정하였다. 실험상의 오차를 최소화하기 위하여 각 스펙트럼을 동일 면적으로 normalization을 실시하였으며, mean centering 과정을 거쳐 2차 미분하여 스펙트럼의 전처리 과정을 실시하였다(
Song et al. 2014). 가공된 FT-IR 스펙트럼 데이터는 NIPALS 알고리즘(
Wold 1966)을 이용하여 R 프로그램(version 3.1.2)을 사용하여 PCA (Principal component analysis)와 PLS-DA (Partial least squares discriminant)분석을 수행하였다. 또한, HCA (hierarchical clustering analysis) 분석하였으며 유사도 지수로 UPGMA (unweighted pair group method with arithmetic mean analysis)를 사용한 Euclidean distance를 측정하여 각 시료의 유연관계를 덴드로그램으로 나타냈다(
Fiehn et al. 2000,
Trygg et al. 2007).
FT-IR 스펙트럼 데이터를 기반으로 대사물질을 통한 원산지 예측을 위해서 PLS regression 분석을 적용하여 확립하였다. 원산지 예측을 위해 2개의 변수 X와 Y를 나누고 X 변수에는 FT-IR 스펙트럼 데이터를 Y 변수에는 원산지 지역 번호를 그룹화 시키고 각각의 정보를 연결시켜 PLS regression을 실시하였다. 예측 모델의 예측 능력을 테스트하기 위해 트레이닝 세트를 만들어 모델 구축에 사용하였고, 트레이닝 세트는 테스트 세트에 사용되지 않았다. X 변수와 Y 변수간의 측정 모델을 만들기 위하여 상관관계를 예측한 후 회귀계수를 사용하여 상관관계를 계산하였다. 전체의 데이터는 임의의 두 부분으로 나눴고, 먼저 트레이닝 세트를 선발 후 트레이닝 세트에 사용되지 않은 데이터를 테스트 세트로 사용하여 예측 모델을 구축하는데 사용되었다. PLS 모델의 예측 능력은 실측 값과 PLS 예측 값 사이의 정확도를 10 bootstrap 테스트하여 나타냈고, RMSEP (Root Mean Square Error of Prediction)와 MSEP (Mean Square Error of Prediction)를 측정하여 예측의 정확도를 확인하였다(
Liu et al. 2006,
Terhoeven-Urselmans et al. 2010).
결과 및 고찰
들깨의 FT-IR 스펙트럼 비교 분석
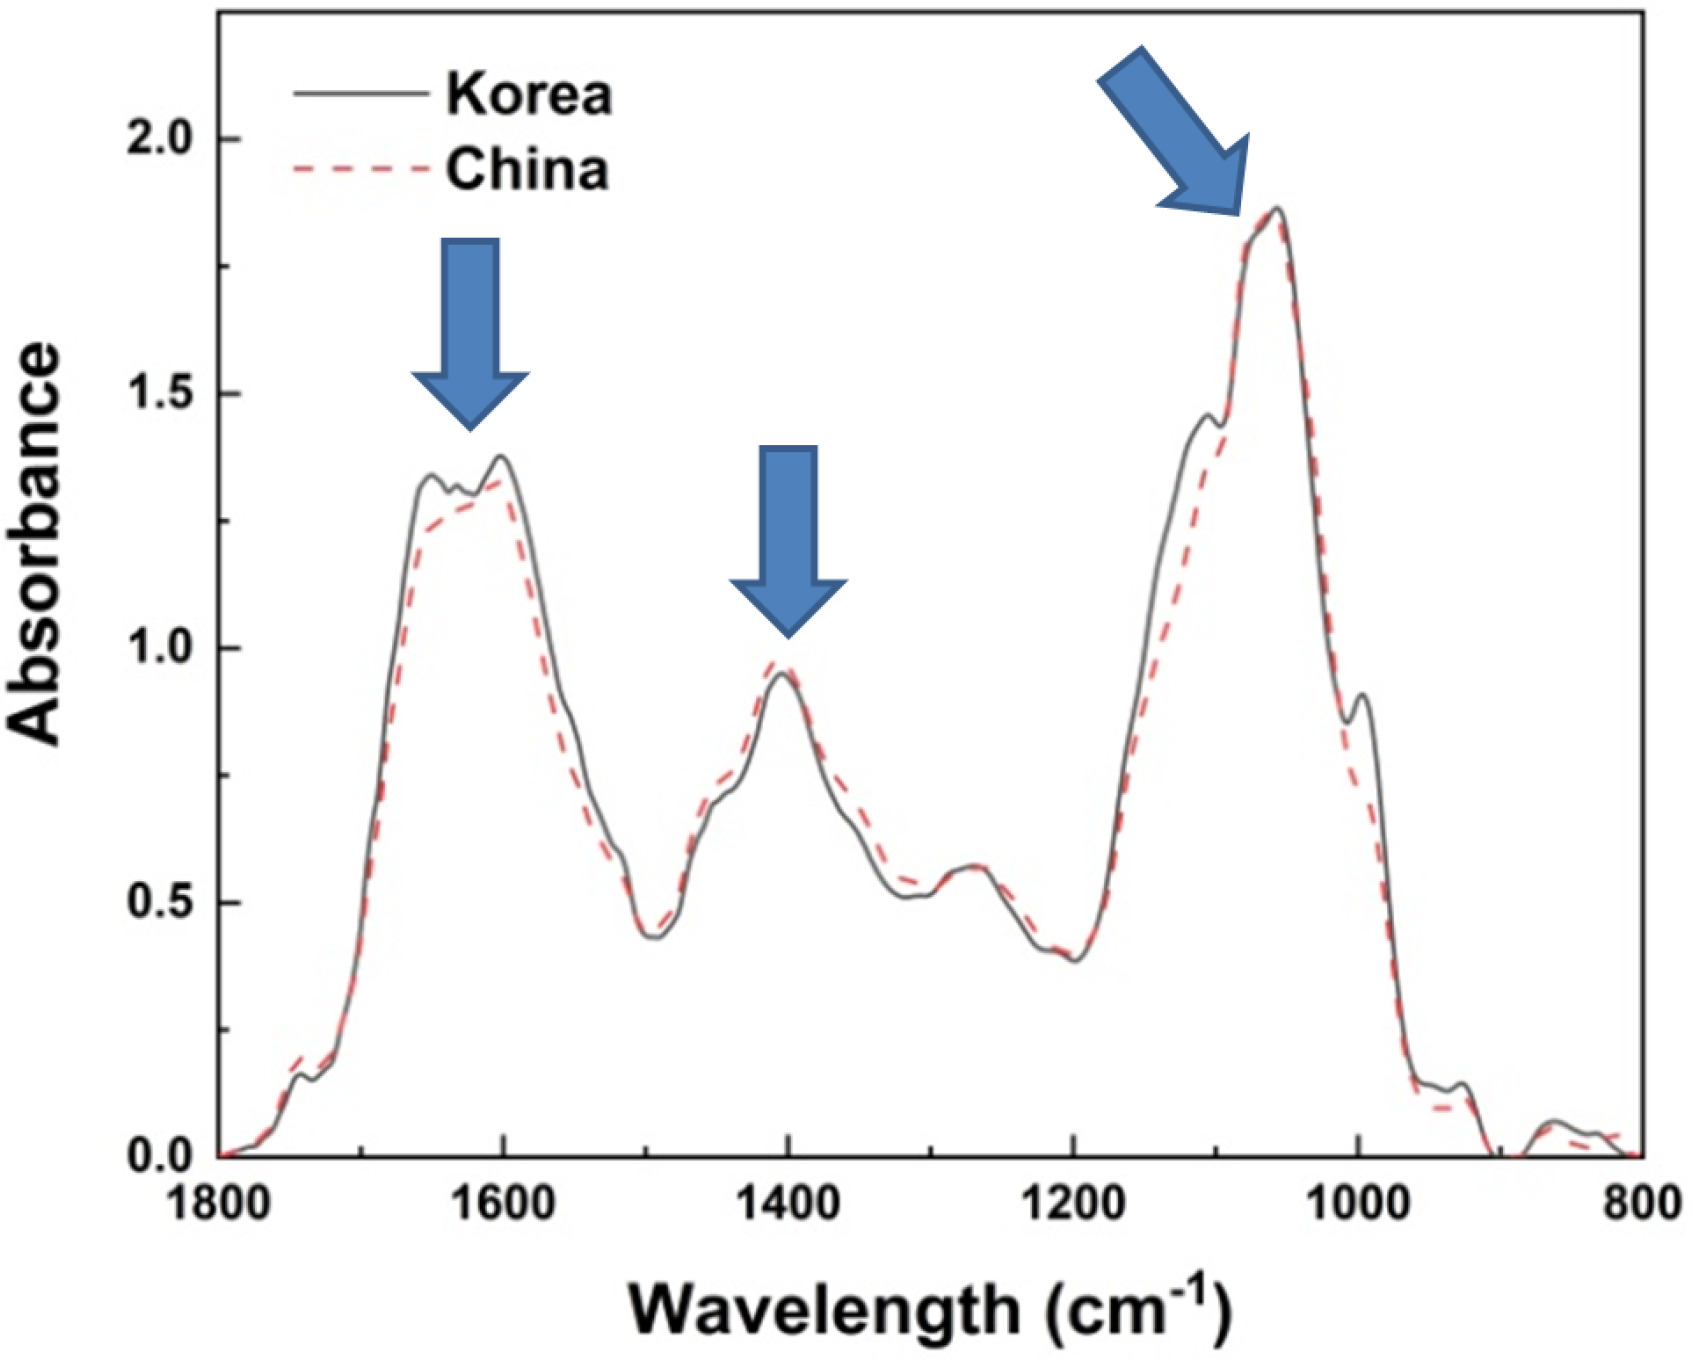
들깨의 원산지 식별을 위해 FT-IR 스펙트럼 데이터로부터 다변량통계분석을 통해 들깨의 원산지별 유연관계를 분석하였다. 각각의 품종들은 FT-IR 스펙트럼 1750-1500, 1500-1300, 1150-950 cm
-1 상에서 특정적인 스펙트럼 패턴 변화가 나타났다(
Fig. 1). FT-IR 스펙트럼의 특정적인 주요 부위는 각각 특정 화합물들을 나타내는데, 1750-1500 cm
-1 부위에서는 주로 Amide I 과 II을 포함하는 아미노산 및 단백질계열의 화합물들의 질적, 양적 정보를 나타내고(P=O, C=O, N-H, C-C 그리고 C= C), 1500-1300 cm
-1 부위에서는 phosphodiester group을 포함한 핵산 및 인지질의 정보가 반영이 되고(CH
2와 P=O), 그리고 1100-950 cm
-1 부위에서는 단당류나 복합 다당류를 포함하는 carbohydrates 계열의 화합물들이 질적, 양적 정보가 반영(C-O, C-C 그리고 C-O-C)되어 나타낸다(
Parker 1983,
Dumas & Miller 2003,
Wolkers et al. 2004,
Yee et al. 2004,
D’Souza et al. 2008,
Lopez-Sanchez et al. 2010). 이처럼 FT-IR 스펙트럼 상의 질적, 양적 차이는 들깨가 함유하고 있는 아미노산이나 단백질, 지방산, 그리고 탄수화물계통의 화합물들의 차이가 현저하게 나타남을 의미한다. 따라서, FT-IR 스펙트럼 분석은 주요 대사체의 질적, 양적 변화를 분석하여 원산지 식별 수단으로써 활용이 가능할 것이다.
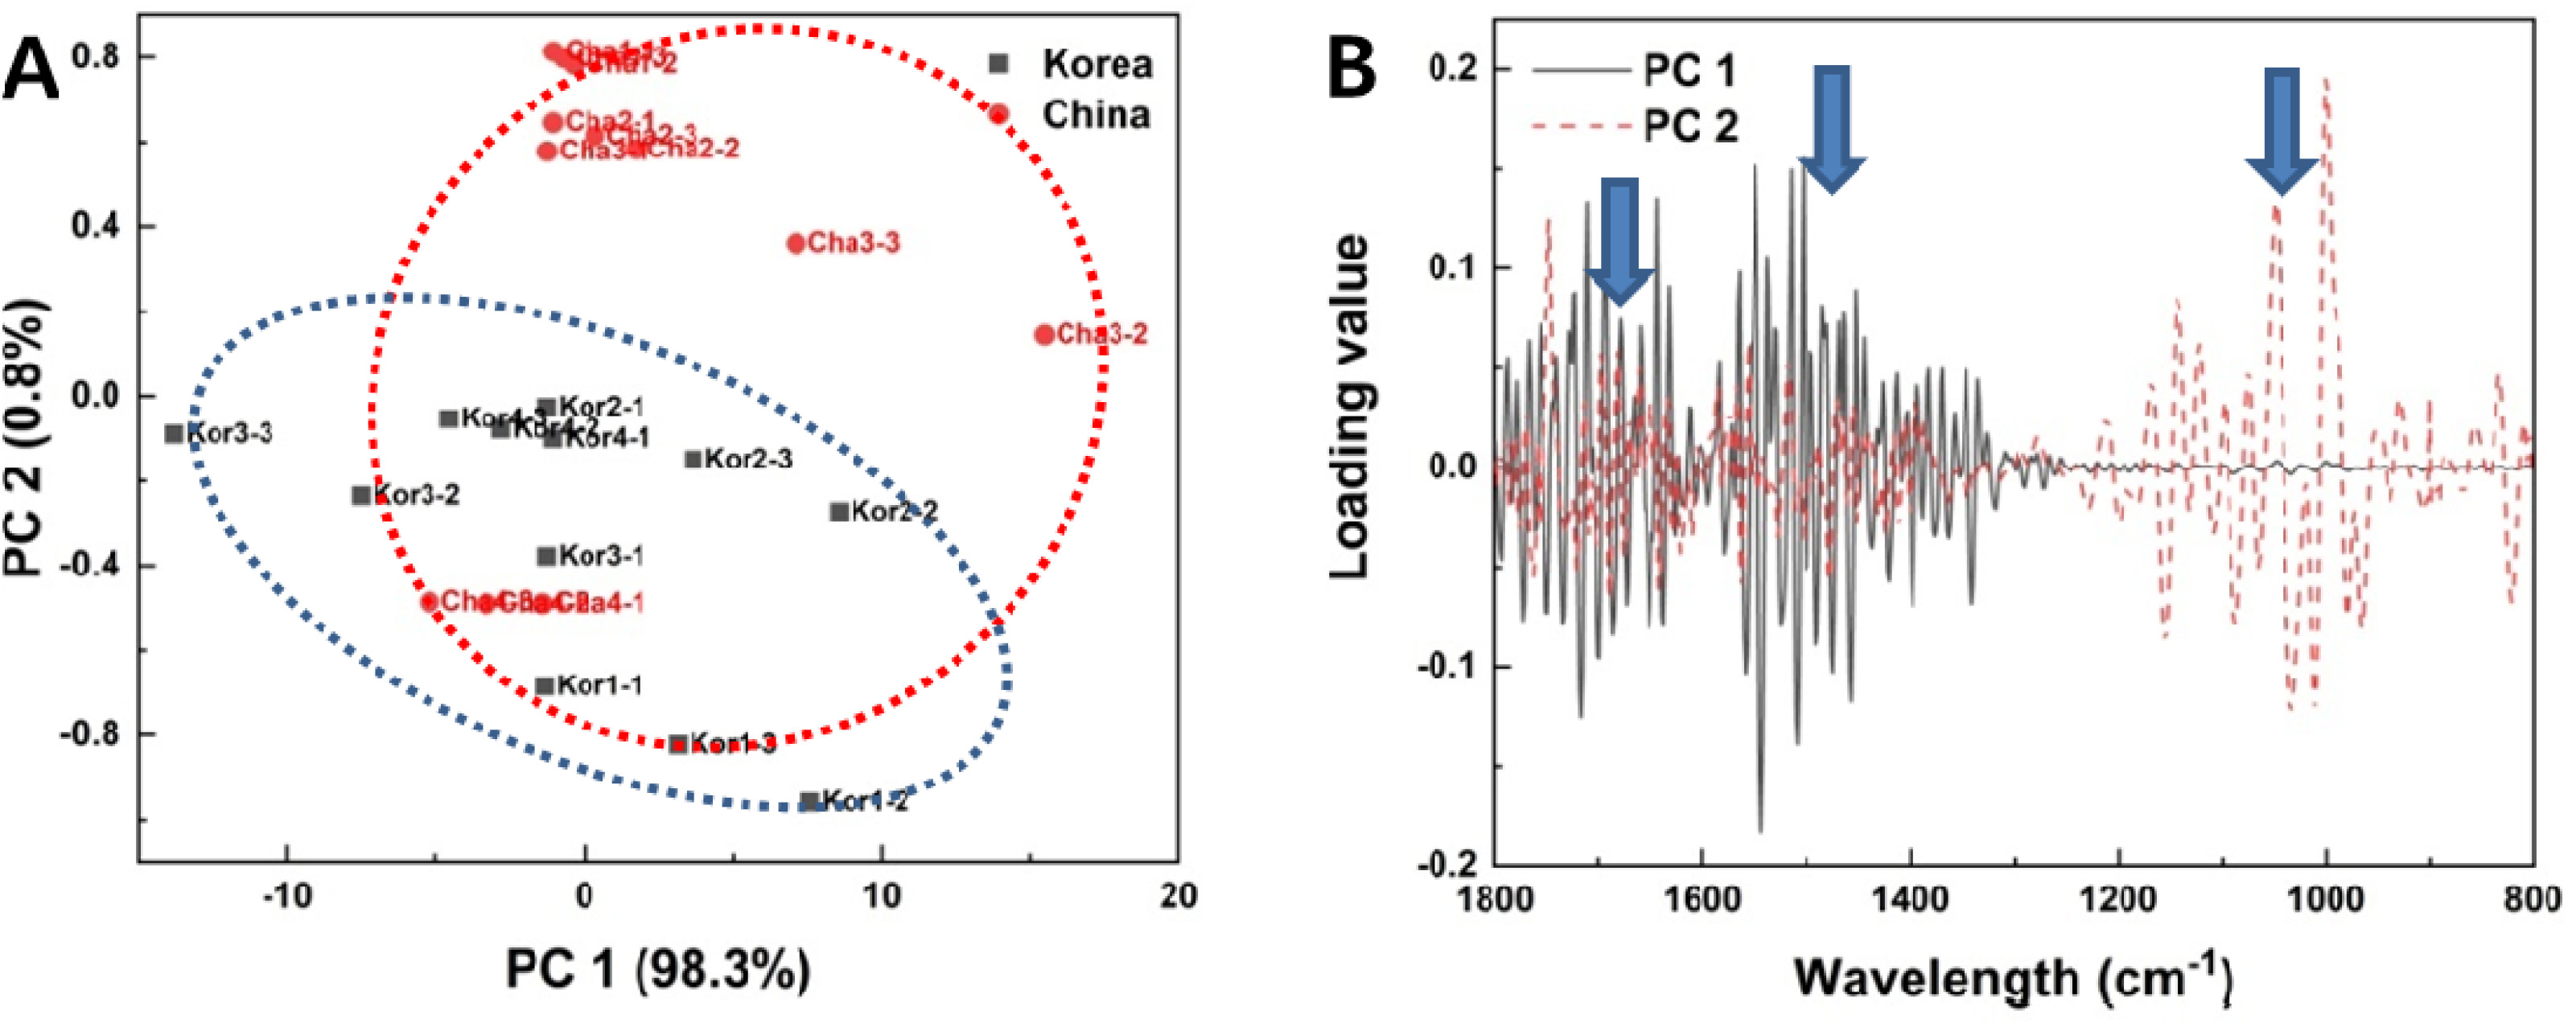
들깨의 FT-IR 스펙트럼 데이터를 PCA 분석한 결과 PC 1과 2의 설명력이 98.3%와 0.8%로 각각 나타났다(
Fig. 2A). 들깨의 경우에도 중국산 품종(china)이 상단에 위치하였고, 국산 품종(korea)이 하단에 위치하였다(
Fig. 2A). 이처럼 들깨 품종은 주로 상하로 중국산 품종과 국산 품종이 구분되는 것으로 나타나며, 전체적인 중국산 품종의 분포가 국산 품종에 비해 넓게 형성되는 것을 확인 할 수 있었다(
Fig. 2A). 아직까지 FT-IR 스펙트럼 데이터를 이용한 들깨 품종의 원산지 식별이 분석이 없었지만, 두과작물의 품종간 식별(
Song et al. 2012), 배추 계통 식별을 통한 F1 판별(
Ahn et al. 2016), 아티초크의 품종간 식별이 가능한 것으로 보고되었다(
Kim et al. 2016). 따라서, 들깨의 FT-IR 스펙트럼 데이터를 이용한 대사체 분석을 통해 원산지 간의 차이와 유사성을 확인할 수 있다. 이상의 방법을 이용한 밭작물에 대한 원산지 품종 육성에 빠르고 정확한 선택을 할 수 있을 것이다.
들깨의 FT-IR 스펙트럼 데이터 식별에 중요하게 작용한 FT-IR 스펙트럼 부위를 확인하였다(
Fig. 2B). FT-IR loading value를 확인한 결과, 1700-1500, 1500-1300 그리고 1100-950 cm
-1 부위임에서 PC 1과 2를 분류하는 중요한 기준임을 알 수 있었다(
Fig. 2B). FT-IR 스펙트럼상에서 차이를 나타냈던 부위(
Fig. 1)와 loading value 상에서 나타난 부위가 일치하였고, 이 부위가 나타내는 아미노산 및 단백질계열의 화합물, 핵산 및 인지질 그리고 carbohydrates 계열 질적, 양적 차이가 나타남을 의미하며 원산지 식별에 중요한 역할을 하는 것으로 알 수 있었다(
Schulz & Baranska 2007)(
Fig. 2B).
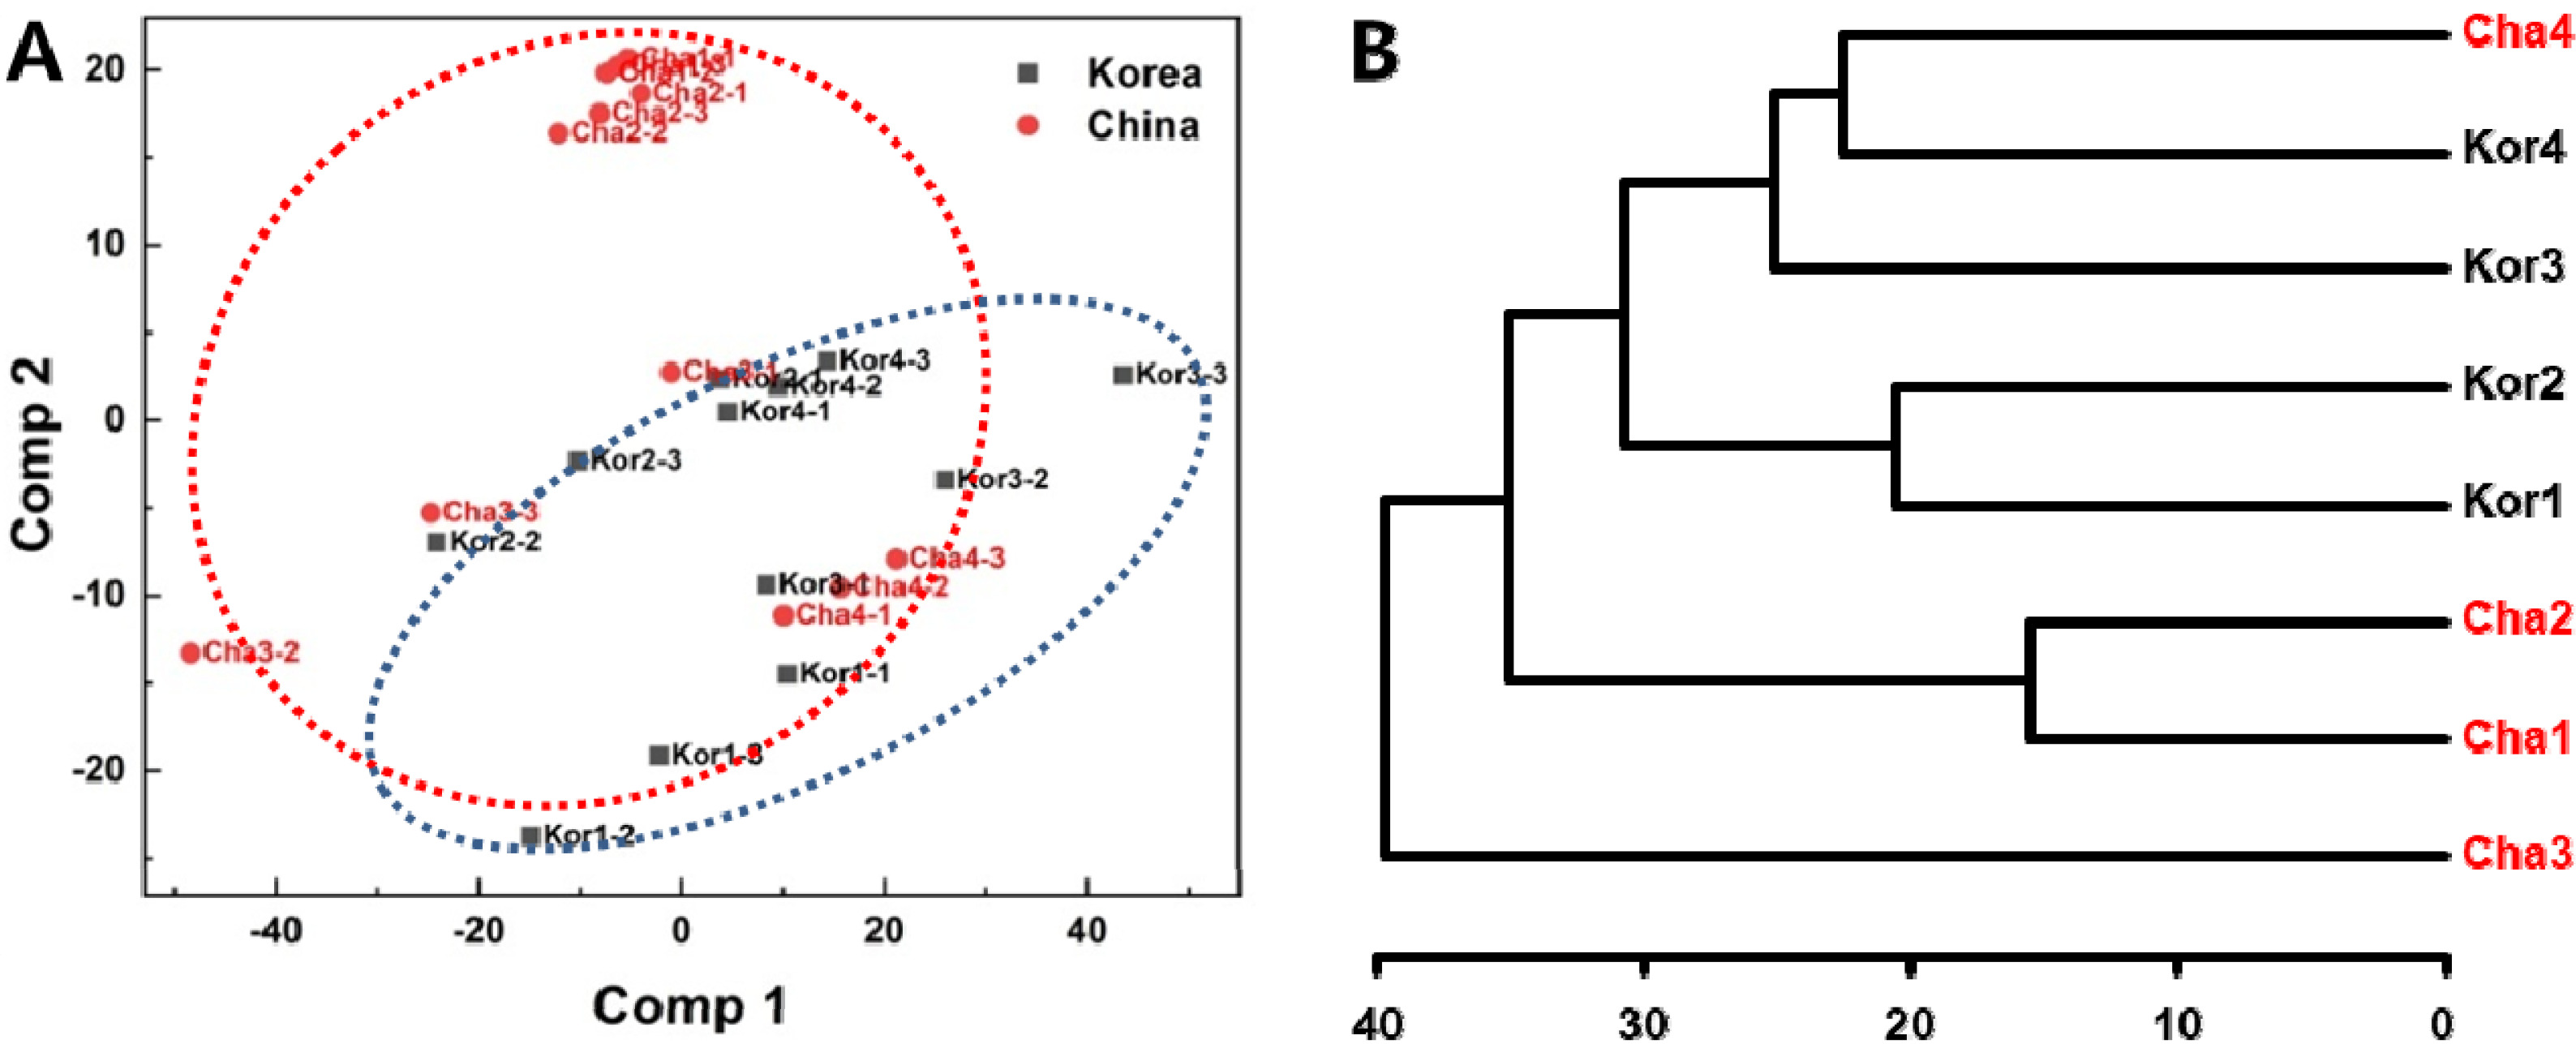
PLS-DA 분석의 경우 PCA 분석 보다 들깨 원산지 식별이 뚜렷하게 나타났다(
Fig. 3A). PLS-DA score plot을 보면 중국 품종이 상단에 위치하고, 국산 품종이 하단에 위치하는 것을 확인할 수 있었다. 하지만, 중국 품종 중 ‘China 4’ 품종에 경우 PCA와 같이 국산 품종과 동일한 그룹에 속하는 것으로 보아 국산 품종과 유사한 대사체를 형성하는 것으로 판단된다(
Fig. 3A). 이 결과, 들깨의 FT-IR 스펙트럼 데이터를 이용한 PLS-DA 분석으로 들깨의 원산지 식별이 가능함을 알 수 있었다.
HCA dendrogram 분석 결과를 보면 국산 들깨 품종과 중국산 들깨 품종이 서로 구분되어 식별되는 것을 확인할 수 있었다(
Fig. 3B). 하지만, 중국 들깨 품종 중 ‘Cha4’의 경우만 국산 들깨 품종과 유의하게 나타났지만, 다른 품종들은 각 지역별로 유의성을 나타냈다. 이것은 각각의 대사체 정보가 재배 지역에 따라 다르게 나타나고 지역별 유사성이 높은 것으로 판단된다. 이상의 연구 결과로 FT-IR 스펙트럼 데이터를 이용한 재배 지역 구분이 가능함을 알 수 있었다. 또한, 현재까지 FT-IR 스펙트럼 데이터를 통해 들깨에서 재배 지역 구분을 실시한 경우가 없어 비교가 불가능하지만, 다른 작물에서는 다양한 대사체 분석을 통해 품종 식별을 한 사례가 보고되어 있다. 우리나라 고유 한지를 연구하기 위해 닥나무에 NIR과 MIR 스펙트럼을 이용하여 원산지 판별에 이용하였고(
Jang et al. 2019), IR-MS를 이용하여 안정동위원소인 질소, 탄소, 산소의 비율을 통해 고춧가루와 콩의 원산지 식별을 하였으며(
Oh et al. 2021), 근적외선분광분석기와 에너지 분산형 X선 형광분석기를 이용해 무기 성분을 분석하여 청국장의 원산지를 식별하였다(
Kang et al. 2016). 또한, 콩 원산지 식별을 위해 ED-XRF를 이용하여 무기성분 함량을 분석하여 원산지 판별을 실시한 것으로 보고된 바 있다(
Lee et al. 2020b).
따라서 본 연구에서 확립된 FT-IR 스펙트럼 데이터를 이용한 들깨의 원산지 식별 기술은 품종, 원산지의 신속한 선발 수단으로 활용이 가능할 것으로 기대되며 육종을 통한 품종개발 가속화에 기여 할 수 있을 것으로 예상된다.
들깨 원산지간 Classification, prediction 그리고 cross- validation
원산지간 들깨로부터 품종간 PLS-DA 식별이 bootstrap test를 통해 적용 가능성을 확인하였다(
Table 1). Bootstrap test의 정확도는 99%로 나타냈고,
p값(
p<0.01)은 통계적으로 유의하였다. 또한, RMSEP (Root Mean Square Error of Prediction)은 0.23, MSEP (Mean Square Error of Prediction)는 0.005로 예측값에 대한 정확도를 나타냈다(
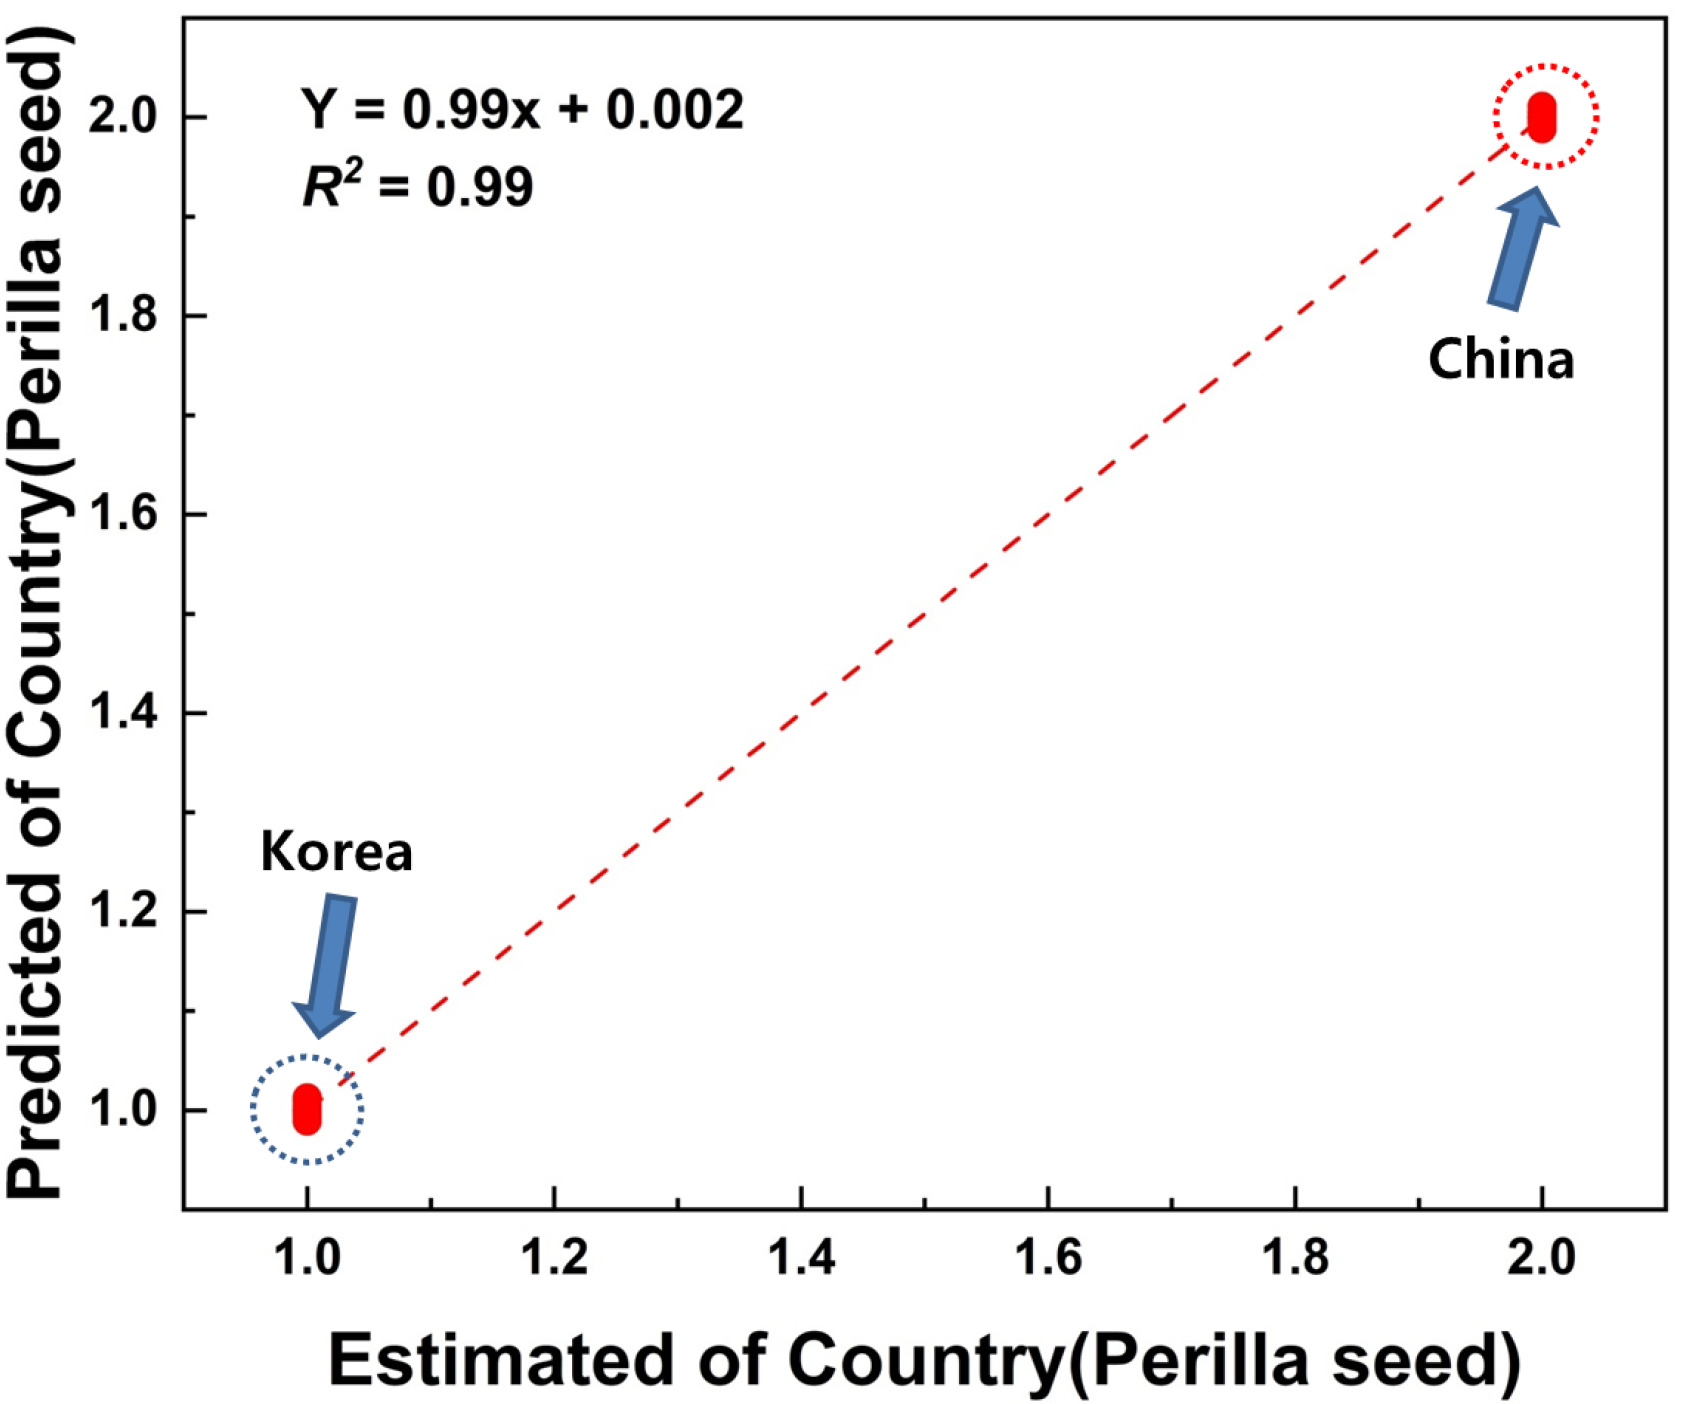
Table 1). 이러한 결과는 들깨 품종간의 지역적 차이를 PLS 모델링을 통해 높은 정확도로 명확히 구별 할 수 있다는 것을 나타냈다. 본 연구에서는 국산 4종과 중국산 4종 들깨 품종을 테스트하였고, 테스트를 통해 정확하게 예측하고 자신의 그룹으로 분류 되었다(
Fig. 4). FT-IR 스펙트럼의 특정 화합물인 Amide I 과 II을 포함하는 아미노산 및 단백질계열의 화합물들(P=O, C=O, N-H, C-C 그리고 C=C), phosphodiester group을 포함한 핵산 및 인지질(CH
2와 P=O), 그리고 단당류나 복합 다당류를 포함하는 carbohydrates 계열의 화합물들(C-O, C-C 그리고 C-O-C)이 질적, 양적 정보가 반영되어 나타낸다(
Parker 1983,
Dumas & Miller 2003,
Wolkers et al. 2004,
Yee et al. 2004,
D’Souza et al. 2008,
Lopez-Sanchez et al. 2010). 이처럼 FT-IR 스펙트럼 상의 질적, 양적 차이는 들깨가 함유하고 있는 아미노산이나 단백질, 지방산, 그리고 탄수화물계통의 화합물들의 차이가 나타남에 따라 품종과 지역간에 차이를 식별할 수 있다. 따라서 지역간 예측 정확도는 새로운 지역의 시료를 다양한 통계 연산을 사용하여 FT-IR 스펙트럼의 재현성을 나타낼 수 있다.
본 연구에서 확립된 다변량통계분석을 이용한 들깨의 원산지 식별 기술은 품종의 원산지 신속 선발 수단으로 활용이 가능할 것으로 기대되며 수입 개방화에 따른 국내 생산자와 소비자 보호를 위해 공정한 유통질서를 확립할 것으로 예상된다.
적 요
본 연구는 FT-IR 스펙트럼 데이터를 이용하여 국산 들깨와 중국산 들깨의 대사체 수준에서 원산지 판별을 실시하였다. FT-IR 스펙트럼 데이터는 다변량통계 분석을 통해 PCA, PLS-DA 그리고 HCA 분석하였다. FT-IR 스펙트럼의 1,700 - 1,500, 1,500 - 1,300 그리고 1,100 - 950 cm-1 부위는 주로 아미노산, 단백질, 핵산, 지질 그리고 당을 나타낸다. 이러한 대사체를 이용해 PCA를 분석한 결과, 국산 들깨와 중국산 들깨는 각각의 그룹을 형성하면서 원산지 식별이 가능했다. 또한, PLS-DA에서도 원산지에 따라 그룹을 형성하는 것을 볼 수 있었다. 따라서, 대사체 수준에서 원산지간 차이를 확인할 수 있었으며, 이를 통해 신속한 식별을 통해 원산지 식별에 이용이 가능할 것으로 판단된다.
사 사
본 연구는 농촌진흥청 AGENDA 연구사업(ATIS 과제번호: PJ013483042022) 및 농촌진흥청 국립식량과학원 전문연구원 과정 지원 사업에 의해 이루어진 것임.
Fig. 1Representative FT-IR spectral from Perilla seed of main cultivar. FT-IR spectral ranges showed quantitative information of protein/amide I, II (1500-1700 cm-1), phosphodiester group (1300- 1500 cm-1), and sugar compound (950-1100 cm-1).
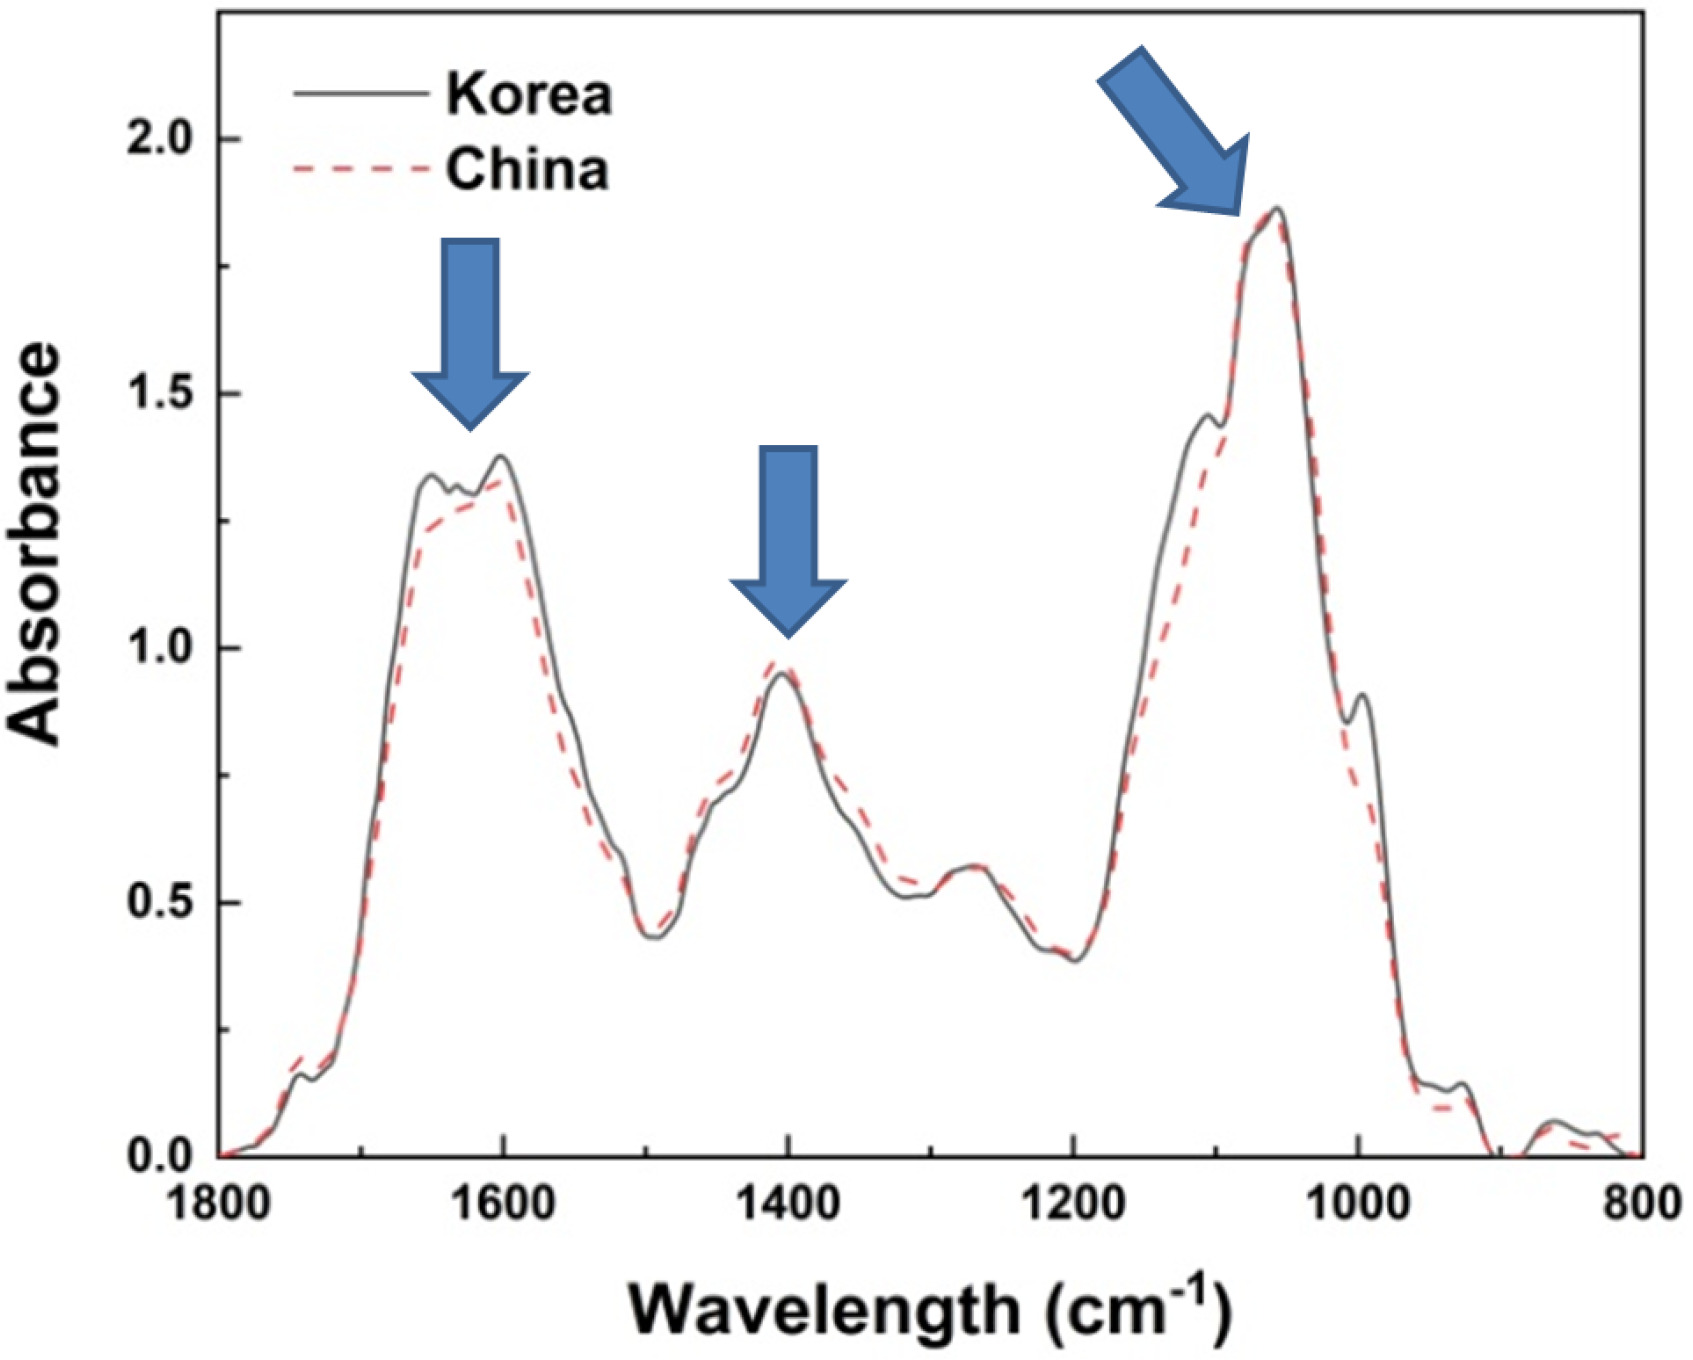
Fig. 2PCA score plot (A) and loading value plot (B) of PCA analysis from FT-IR data of Perilla seed. Dotted shapes represent significant FT-IR spectral region for metabolic discrimination of each country.
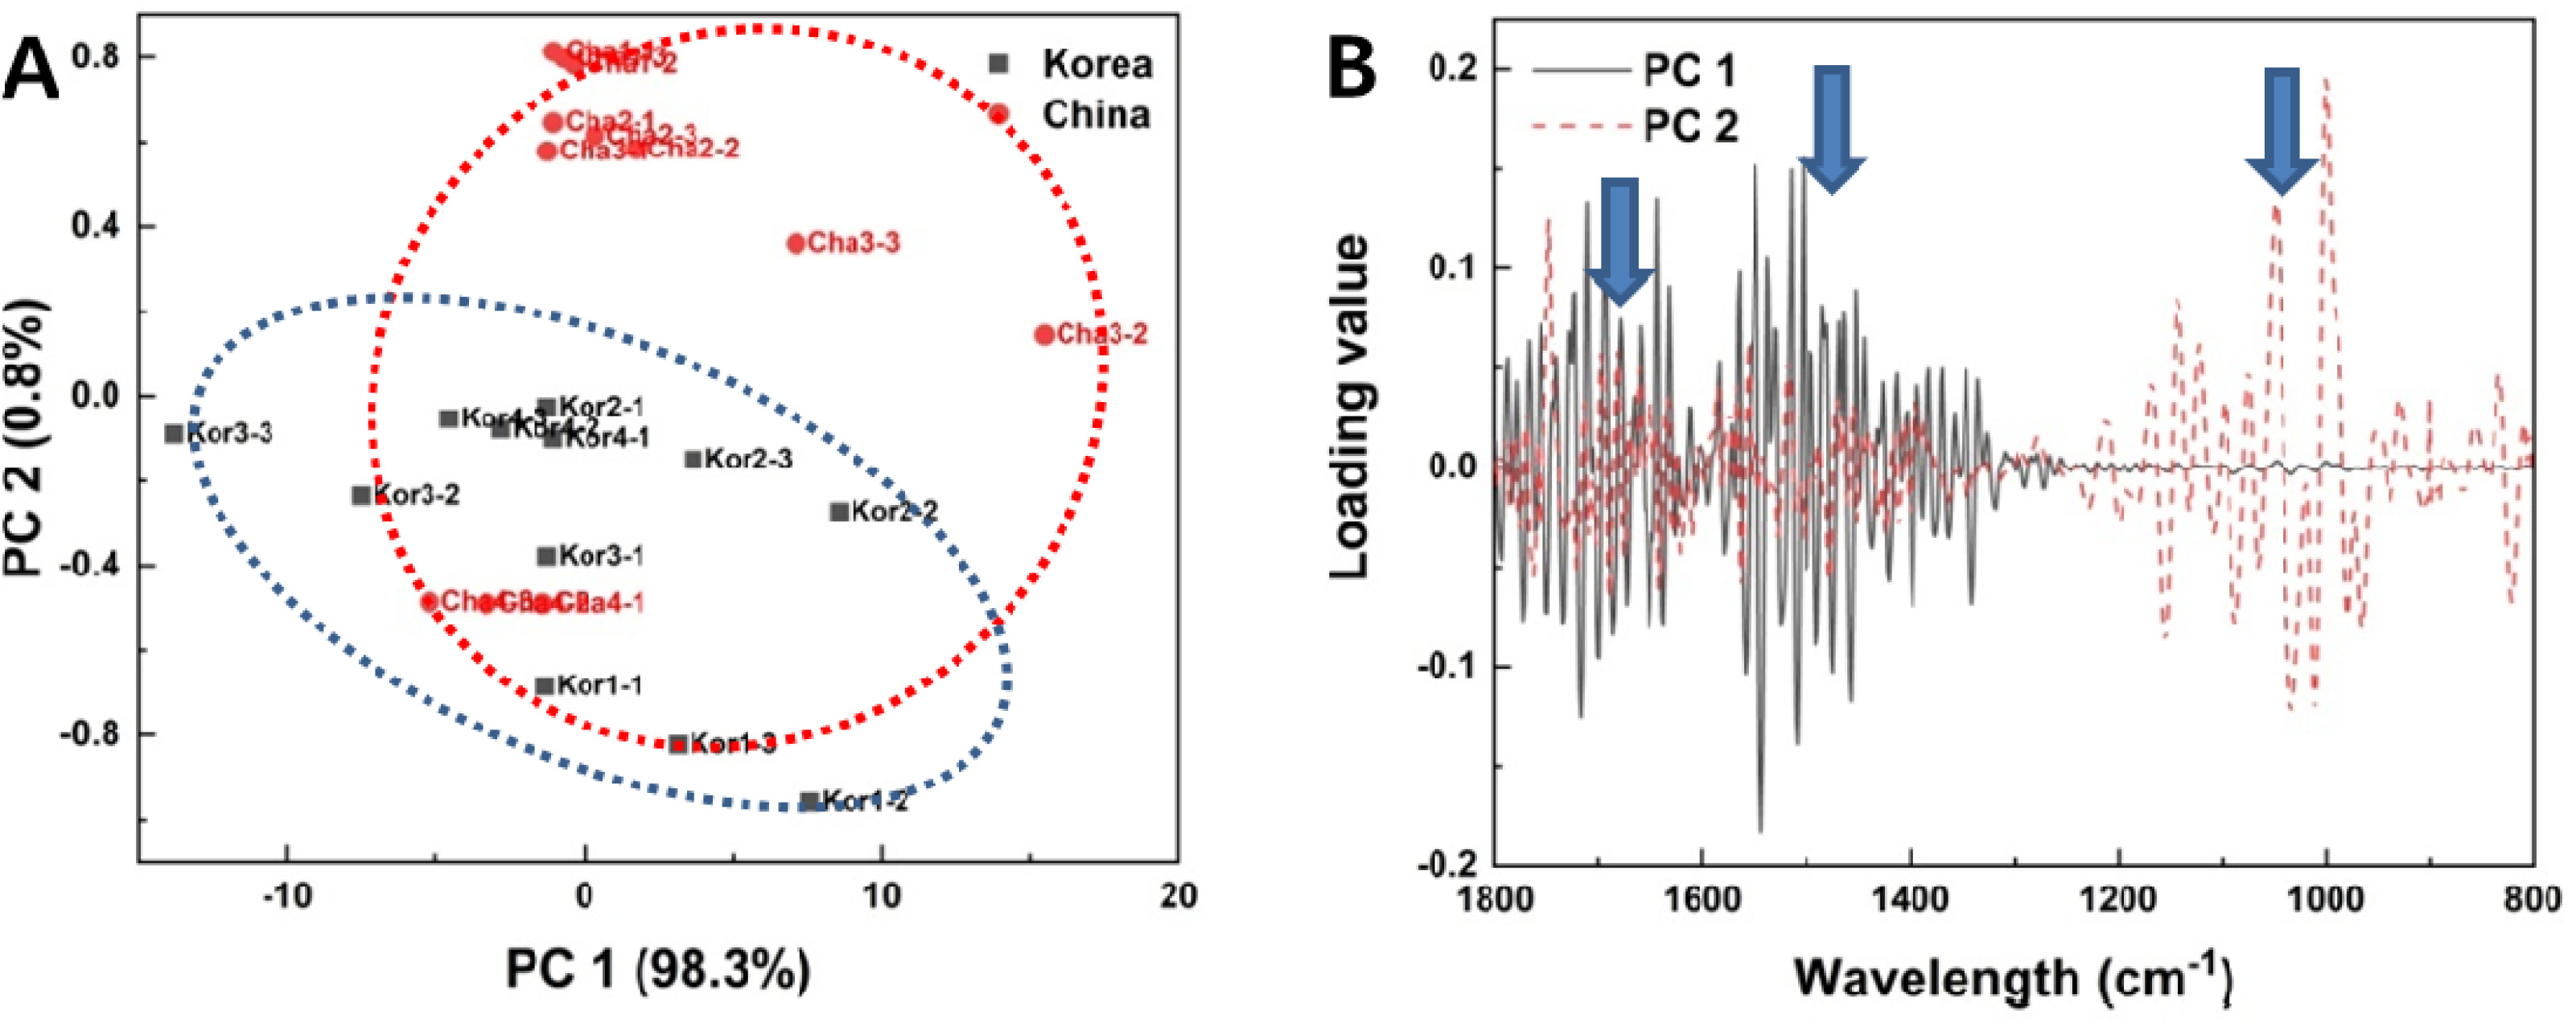
Fig. 3PLS-DA score plot (A) and Hierarchical dendrogram (B) of FT-IR data from Perilla seed. Dotted shapes represent significant FT-IR spectral region for metabolic discrimination of each country.
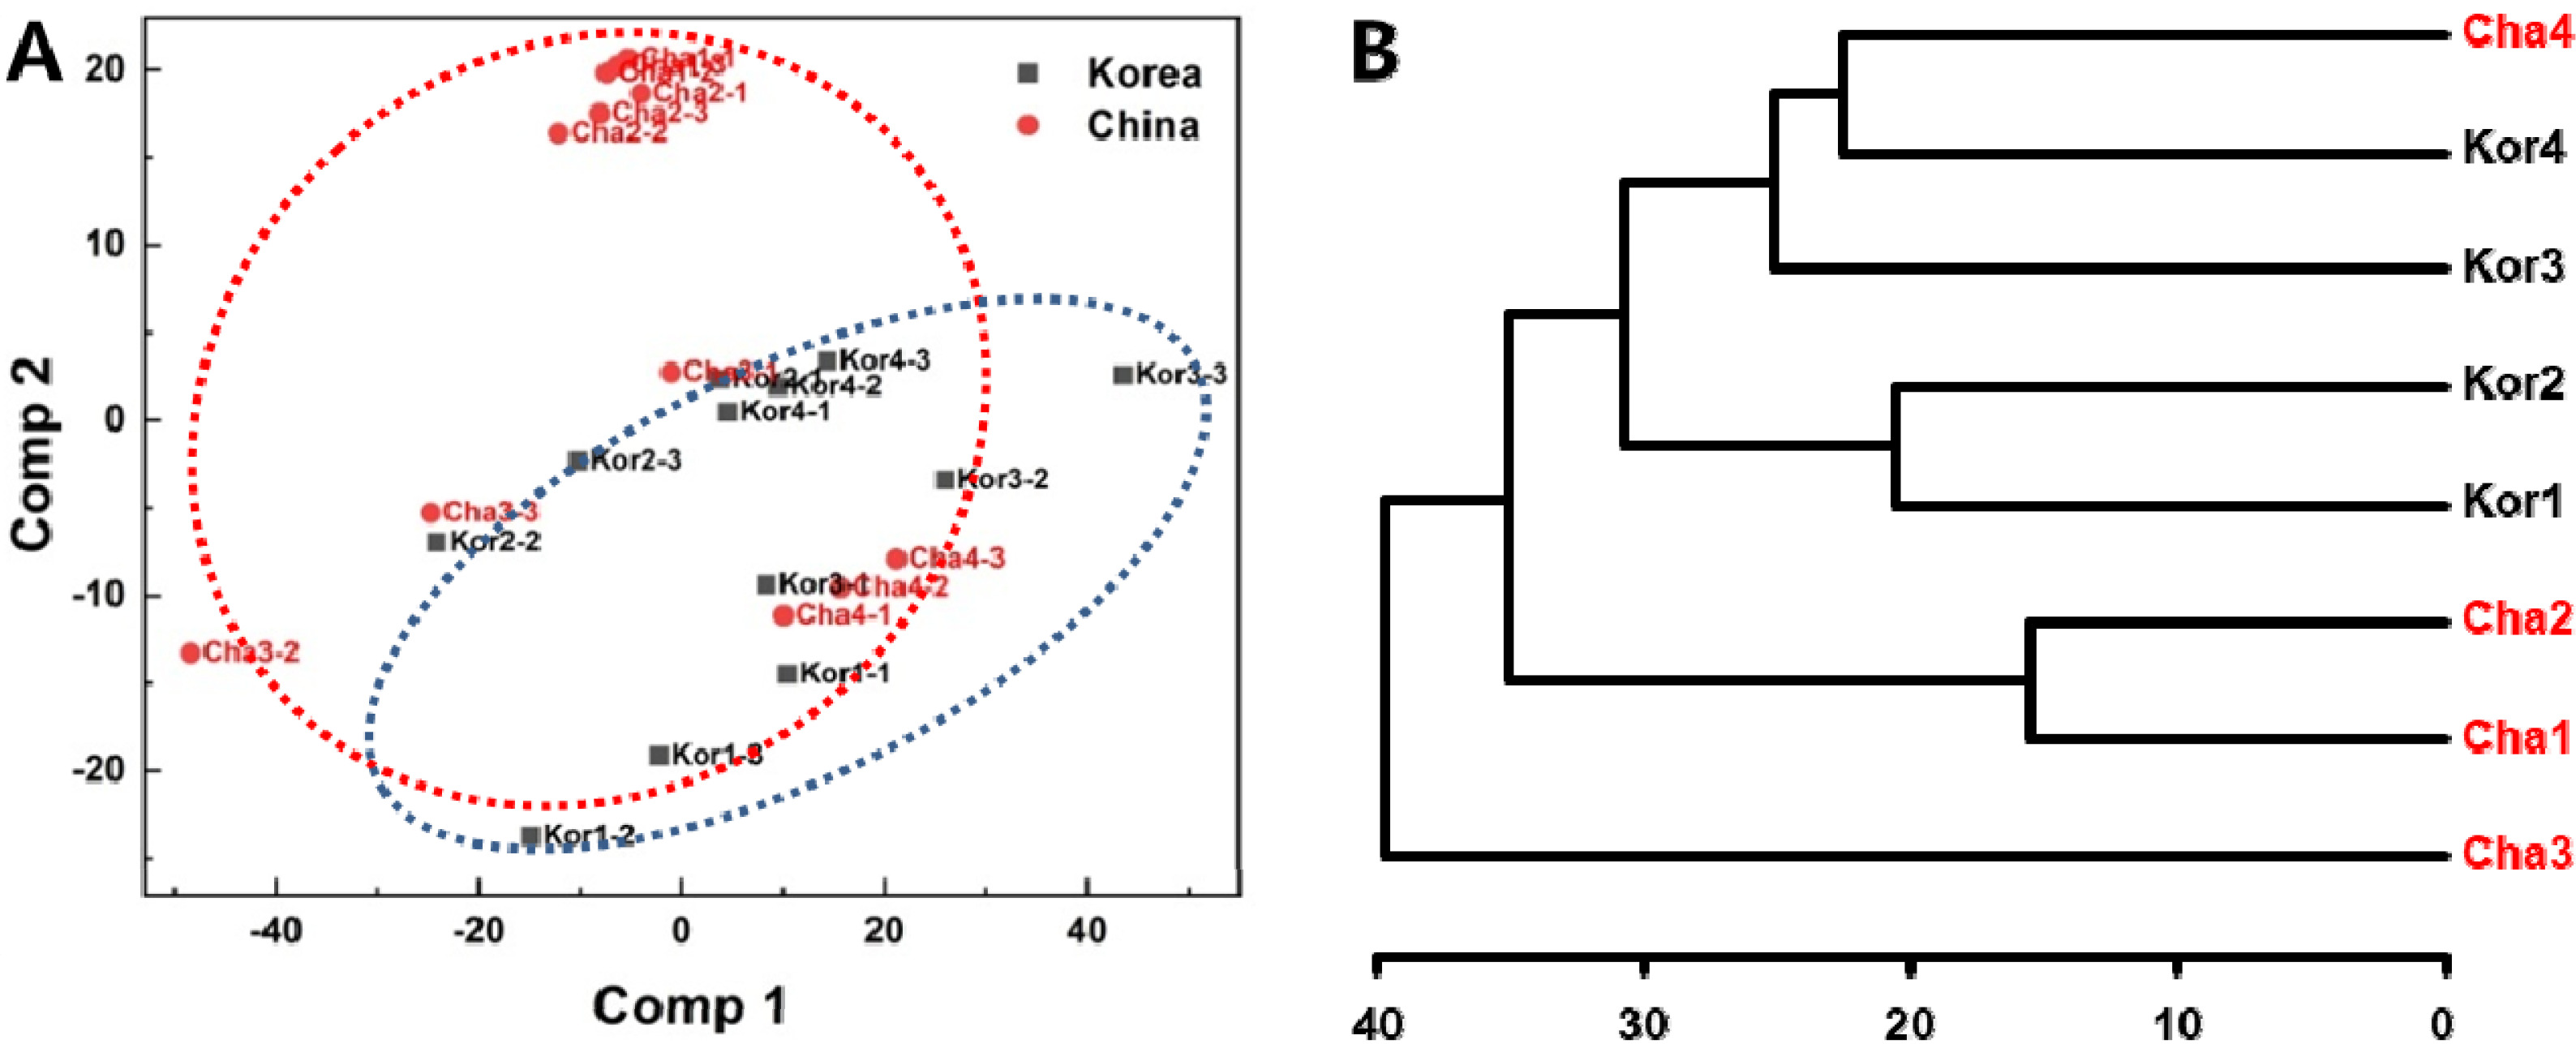
Fig. 4Linear regression analysis between estimated and predicted values of Perilla seed by PLS regression model from FT-IR spectral data. Regression coefficient values (R2) was 0.99.
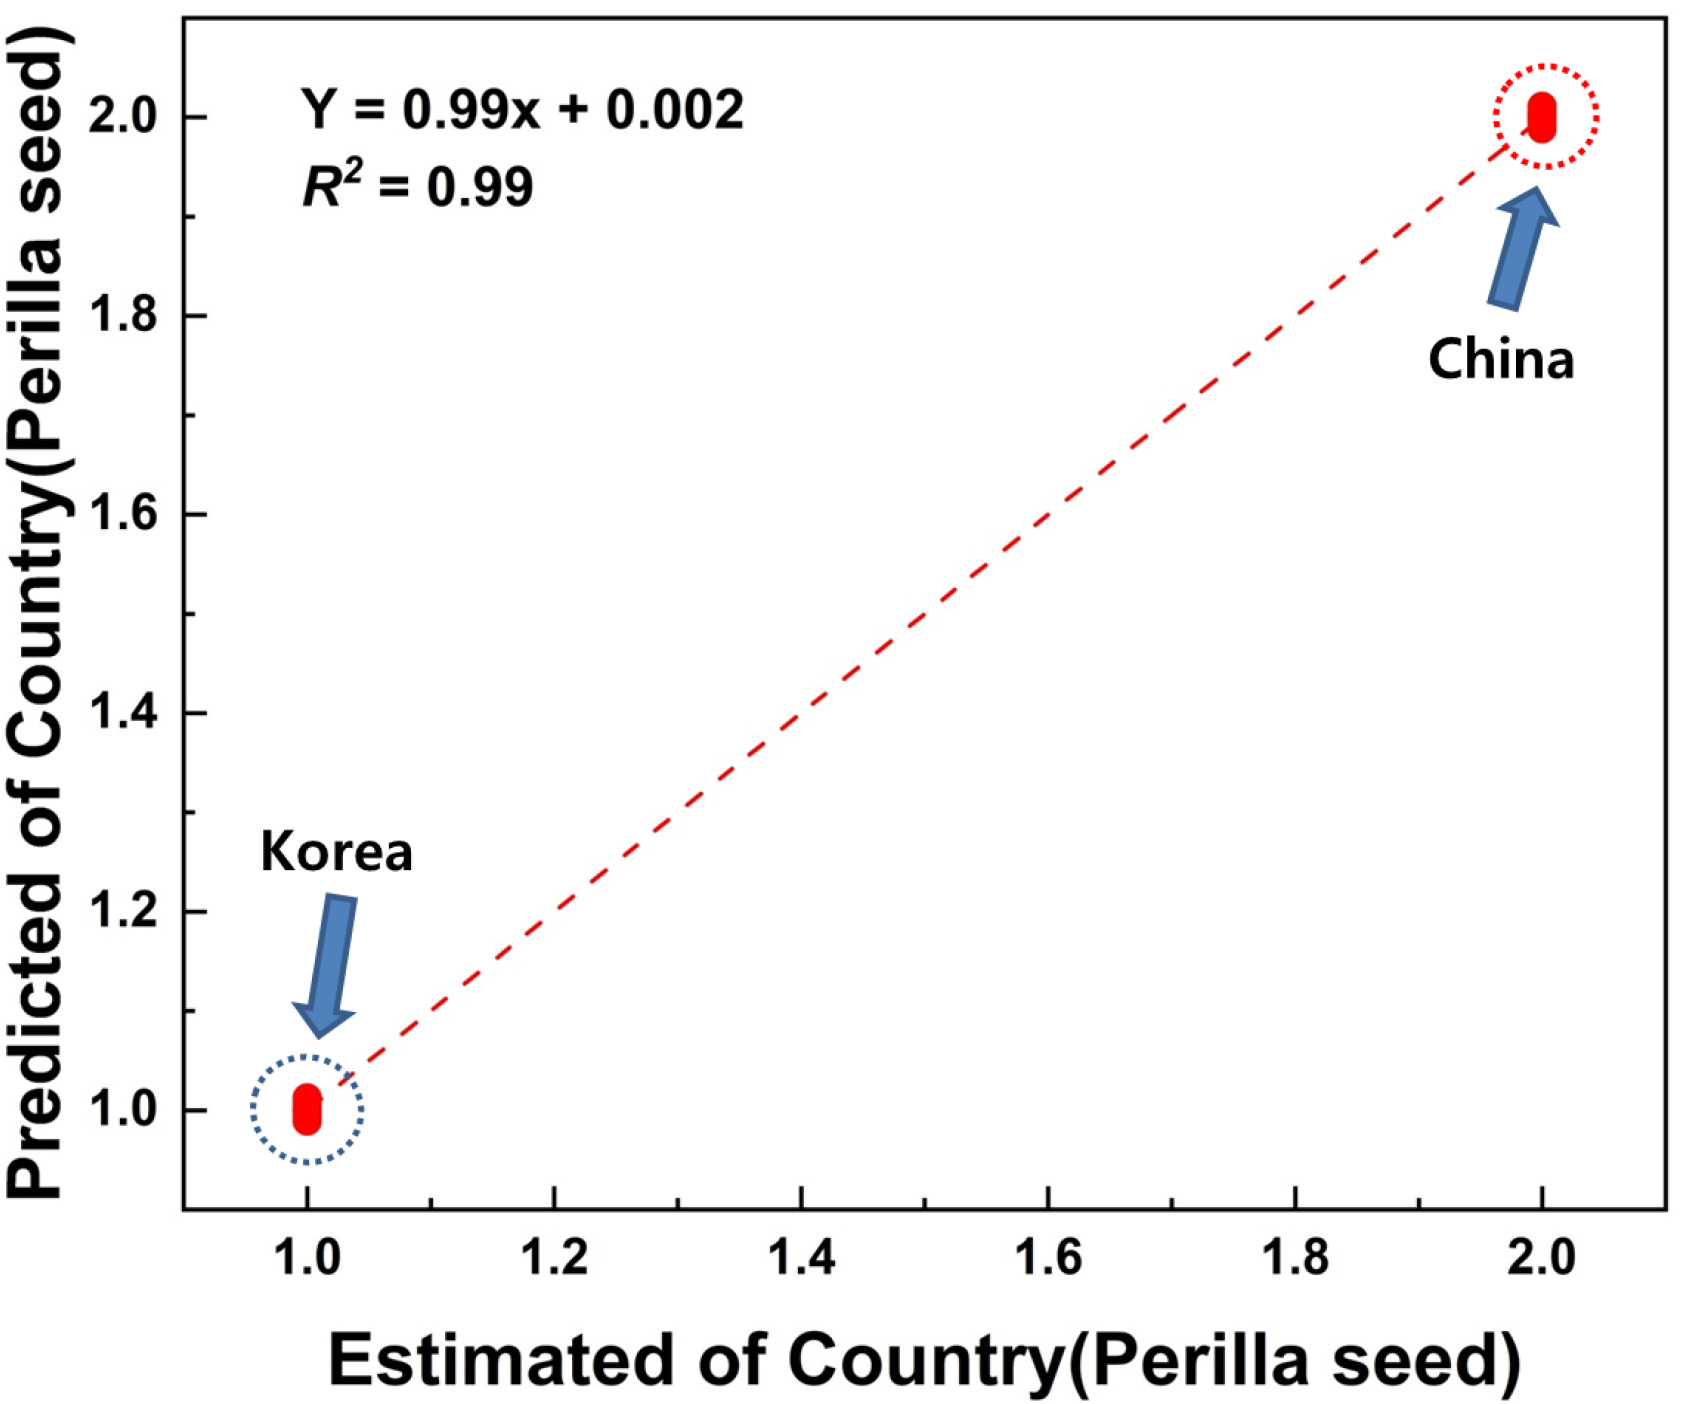
Table 1Summary of the PLS-DA classification results from FT-IR spectral data of Perilla seed.
Table 1
|
Prediction |
Total |
|
Kor1 |
Kor2 |
Kor3 |
Kor4 |
Kor5 |
Kor6 |
Cha1 |
Cha2 |
Cha3 |
Cha4 |
Cha5 |
Cha6 |
|
Cross validated |
Count |
Kor1 |
3 |
|
|
|
|
|
|
|
|
|
|
|
3 |
|
Kor2 |
|
3 |
|
|
|
|
|
|
|
|
|
|
3 |
|
Kor3 |
|
|
3 |
|
|
|
|
|
|
|
|
|
3 |
|
Kor4 |
|
|
|
3 |
|
|
|
|
|
|
|
|
3 |
|
Kor5 |
|
|
|
|
3 |
|
|
|
|
|
|
|
3 |
|
Kor6 |
|
|
|
|
|
3 |
|
|
|
|
|
|
3 |
|
Cha1 |
|
|
|
|
|
|
3 |
|
|
|
|
|
3 |
|
Cha2 |
|
|
|
|
|
|
|
3 |
|
|
|
|
3 |
|
Cha3 |
|
|
|
|
|
|
|
|
3 |
|
|
|
3 |
|
Cha4 |
|
|
|
|
|
|
|
|
|
3 |
|
|
3 |
|
Cha5 |
|
|
|
|
|
|
|
|
|
|
3 |
|
3 |
|
Cha6 |
|
|
|
|
|
|
|
|
|
|
|
3 |
3 |
|
Total |
3 |
3 |
3 |
3 |
3 |
3 |
3 |
3 |
3 |
3 |
3 |
3 |
36 |
References
- 1. Ahn MS, Lim CJ, Song SY, Min SR, Lee IH, Nou IS, Kim SW. 2016. Rapid discrimination system of Chinese cabbage (Brassica rapa) at metabolic level using Fourier transform infrared spectroscopy (FT-IR) based on multivariate analysis. J Plant Biotechnol 43: 383-390.
- 2. Akula R, Ravishankar GA. 2011. Influence of abiotic stress signals on secondary metabolites in plants. Plant Signal Behav 6: 1720-1731.
- 3. Argyri AA, Jarvis RM, Wedge D, Xu Y, Panagou EZ, Goodacre R, Nychas GJE. 2013. A comparison of Raman and FT-IR spectroscopy for the prediction of meat spoilage. Food Control 29: 461-470.
- 4. Bastiena P, Vinzi VE, Tenenhaus M. 2005. PLS generalised linear regression. Computational Stat. Data Analysis 48: 17-46.
- 5. Chen Y, Xie M, Zhang H, Wang Y, Nie S, Li C. 2012. Quantification of total polysaccharides and triterpenoids in Ganoderma lucidum and Ganoderma atrum by near infrared spectroscopy and chemometrics. Food Chem 135: 268-275.
- 6. Choung MG. 2005. Comparison of major characteristics between seed perilla and vegetable perilla. Korean J Crop Sci 50: 171-174.
- 7. Dumas P, Miller L. 2003. The use of synchrotron infrared microspectroscopy in biological and biomedical investigations. Vib Spectrosc 32: 3-21.
- 8. D'Souza L, Devi P, Shridhar MPD, Naik CG. 2008. Use of fourier transform infrared (FTIR) spectroscopy to study cadmium-induced changes in Padina Tetrastromatica (Hauck). Anal Chem Insights 3: 135-143.
- 9. Fiehn O, Kopka J, Drmann P, Altmann T, Trethewey R, Willmitzer L. 2000. Metabolite profiling for plant functional genomics. Nat Biotechnol 18: 1157-1161.
- 10. Gallardo-Velázquez T, Osorio-Revilla G, Loa MZ, Rivera- Espinoza Y. 2009. Application of FTIR-HATR spectroscopy and multivariate analysis to the quantification of adulterants in Mexican honeys. Food Res Int 42: 313-318.
- 11. Gu SY, Choi NY, Son YJ, Park JY, Choi SG, Lee MH, Kim HJ. 2019. Metabolomic analysis of perilla seeds harvested from Korea and China. Korean J Food Sci Technol 51: 411-419.
- 12. Höskuldsson A. 1988. PLS regression methods. J Chemometrics 2: 211-228.
- 13. Jang KJ, Jung SY, Go IH, Jeong SH. 2019. Discrimination model for cultivation origin of paper mulberry bast fiber and Hanji based on NIR and MIR spectral data combined with PLS-DA. Anal Sci Technol 32: 7-16.
- 14. Kang DJ, Moon JY, Lee DG, Lee SH. 2016. Identification of the geographical origin of cheonggukjang by using fourier transform near-infrared spectroscopy and energy dispersive X-ray fluorescence spectrometry. Korean J Food Sci Technol 48: 418-423.
- 15. Kim CH, Seong KC, Jung YB, Lim CK, Moon DG, Song SY. 2016. Establishment of discrimination system using multivariate analysis of FT-IR spectroscopy data from different species of artichoke (Cynara cardunculus var. scolymus L.). Korean J Hortic Sci Technol 34: 328-334.
- 16. Kim SN, Song BR, Ju JH. 2015. Antioxidant activities of Perilla frutescens britton seed extract and its inhibitory effects against major characteristics of cancer cells. J. Korean Soc Food Sci Nutr 44: 208-215.
- 17. Krishnan P, Kruger NJ, Ratcliffe RG. 2005. Metabolite fingerprinting and profiling in plants using NMR. J Exp Bot 56: 255-265.
- 18. Lee AY, Lee MH, Lee SH, Cho EJ. 2017. Alpha-Linolenic Acid from Perilla frutescens var. japonica Oil Protects Aβ- Induced Cognitive Impairment through Regulation of APP Processing and Aβ Degradation. J Agric Food Chem 65: 10719-10729.
- 19. Lee MH, Kim JI, Kim SU, Oh EY, Pae SB, Hwang CD, Song DY, Oh KW, Ha TJ, Jung CS, Kwak DY. 2020a. Development of Perilla cultivar 'Sodam' with high alpha- linolenic acid content and upright growth with narrow branch angle for edible seeds. Korean J Breed Sci 52: 140-144.
- 20. Lee JH, Kang DJ, Jang EH, Hur SH, Shin BK, Han GT, Lee SH. 2020b. Discrimination of geographical origin for soybeans using ED-XRF. Korean J Food Sci Technol 52: 125-129.
- 21. Leopold LF, Leopold N, Diehl HA, Socaciu C. 2011. Quantification of carbohydrates in fruit juices using FTIR spectroscopy and multivariate analysis. Spectroscopy 26: 93-104.
- 22. Li H, Zhang Z, He D, Xia Y, Liu Q, Li X. 2017. Ultrasound- assisted aqueous enzymatic extraction of oil from perilla seeds and determination of its physicochemical properties, fatty acid composition and antioxidant activity. Food Sci Technol Campinas 37: 71-77.
- 23. Liu Y, Ying Y, Yu H, Fu X. 2006. Comparison of the HPLC method and FT-NIR analysis for quantification of glucose, fructose, and sucrose in intact apple fruits. J Agric Food Chem 54: 2810-2815.
- 24. Lopez-Sanchez M, Ayora-Canada MJ, Molina-Diaz A. 2010. Olive fruit growth and ripening as seen by vibrational spectroscopy. J Agric Food Chem 58: 82-87.
- 25. Mevik BH, Wehrens R. 2007. The pls package: Principal component and partial least squares regression. R. J Stat Software 18: 1-24.
- 26. Oh HJ, Ko GA, Yang MY, Kim YJ. 2021. Stable isotope ratio analysis for origin authentication of red pepper powders and soybeans. J Korean Soc Food Sci Nutr 50: 570-576.
- 27. Parker FS. 1983. Applications of infrared, Raman and resonance Raman spectroscopy in biochemistry. Plenum Press, New York, USA.:
- 28. Schulz H, Baranska M. 2007. Identification and quantification of valuable plant substances by IR and Raman spectroscopy. Vib Spectrosc 43: 13-25.
- 29. Seong ES, Seo EW, Chung IM, Kim MJ, Kim HY, Yoo JH, Choi JH, Kim NJ, Yu CY. 2015. Growth characteristics and phenol compounds analysis of collected Perilla frutescens resources from china and japan. Korean J Med Crop Sci 65: 9031-9040.
- 30. Song SY, Ha TJ, Jang KC, Kim IJ, Kim SW. 2012. Establishment of rapid discrimination system of leguminous plants at metabolic level using FT-IR spectroscopy with multivariate analysis. J Plant Biotechnol 39: 121-126.
- 31. Song SY, Jie EY, Ahn MS, Kim DJ, Kim IJ, Kim SW. 2014. Discrimination of African yams containing high functional compounds using FT-IR fingerprinting combined by multivariate analysis and quantitative prediction of functional compounds by PLS regression modeling. Korean J Hortic Sci Technol 32: 105-114.
- 32. Terhoeven-Urselmans T, Vagen TG, Spaargaren O, Shepherd KD. 2010. Prediction of soil fertility properties from a globally distributed soil mid-infrared spectral library. Soil Sci Soc Am J 74: 1792-1799.
- 33. Trygg J, Holmes E, Londstedt T. 2007. Chemometrics in metabonomics. J Proteomes Res 6: 467-479.
- 34. Wold H. 1966. Estimation of principal components and related models by iterative least squares. pp 391-420. In: Krishnaiah KR. (Ed). Multivariate Analysis. Academic Press, New York, USA.
- 35. Wold S, Sjöström M, Eriksson L. 2001. PLS-regression: A basic tool of chemometrics. Chemometr Intell Lab Syst 58: 109-130.
- 36. Wolkers WF, Oliver AE, Tablin F, Crowe JH. 2004. A fourier transform infrared spectroscopy study of sugar glasses. Carbohydr Res 339: 1077-1085.
- 37. Yee N, Benning LG, Phoenix VR, Ferris FG. 2004. Characterization of metal-Cyanobacteria sorption reactions: A combined macroscopic and infrared spectroscopic investigation. Environ Sci Technol 38: 775-782.
- 38. Yuan J, Wang C, Chen H, Zhou H, Ye J. 2013. Prediction of fatty acid composition in Camellia oleifera oil by near infrared transmittance spectroscopy (NITS). Food Chem 138: 1657-1662.