적요
Gluten proteins in wheat grains are generally considered one of the most important factors in determining dough properties and bread quality. In this study, wheat protein quality characteristics were investigated in 607 varieties collected from seven countries grown in a South Korean wheat breeding field for two years. The average protein content was 12.2±1.86%, and the sodium dodecyl sulfate-sediment volume (SDSS) was 46.9±8.39 mL. HI-LINE had the highest protein content (18.3±0.35%) and SDSS (76.7±1.98 mL), while both NE 84557 and Iksan 374 showed small deviations in protein content and SDSS. Protein content and SDSS values were higher in Ax2*+By8 and By9+Dy10 combinations at Glu-A, Glu-B1, and Glu-D1 loci of high molecular weight gluten subunit (HMW-GS) than in other combinations. However, no difference in Glu-A3 and Glu-B3 loci in LMW-GS was observed. Furthermore, in HMW-GS, the composition of Glu-D1 Dy10 and Dy12 had a greater effect on protein quality than Glu-B1 By8 and By9 when the allele of Glu-A1 had Ax2*. Significant differences were found between Dy10 and Dy12 genes of the HMW-GS Glu-D1 and between protein content and SDSS, but not among others. These results suggest that Glu-D1 is extremely important for improving protein quality in HMW-GSs. As a result of this study, HMW-GS allele selection using functional markers, protein content, and SDSS investigation are expected to enable the development of varieties with high protein quality that are stable amid various environmental changes.
서 언
밀은 일반 곡물들과 달리 제분 후 밀가루 형태로 이용하며, 종실내 함유되어 있는 밀 단백질의 함량 및 질적 조성에 따라 다양한 가공 적성을 나타내기 때문에 단백질 함량과 질적 특성이 매우 중요하다. 글루텐 단백질은 일반적으로 반죽 특성과 제빵 품질 등 질적 특성을 결정하는 가장 중요한 요소 중 하나로(
MacRitchie 1987,
MacRitchie 1992,
Weegels et al. 1996) Sodium dodecyl sulfate polyacrylamide gel electrophoresis (SDS-PAGE) 에서의 이동성에 따라 고분자량 글루테닌 소단위(HMW-GS)와 저분자량 글루테닌 소단위(LMW-GS)로 분리된다(
Bietz et al. 1975,
Payne & Corfield 1979). HMW-GS는 밀의 최종 사용 품질에 영향을 미치는 주요 요소이며(
Payne et al. 1980,
Gianibelli et al. 2001) 전체 종자 저장 단백질의 약 10%를 나타낸다. 6배체 일반 밀에는 이론상 6개의 HMW-GS가 존재하며 소수의 밀 품종을 제외하고 6배체의 거의 모든 밀 품종은 품종에 따라 3-5개의 HMW-GS가 발현된다(
Johansson et al. 1993,
Margiotta et al. 1996,
Anjum et al. 2000). LMW-GS는 전체 종자 저장 단백질의 약 1/3과 글루테닌의 60%를 차지하며(
Bietz & Wall 1973), HMW-GS와의 상호작용을 통해 밀 품질에 상당한 영향을 미친다고 알려져 있다(
Gupta et al. 1994a,
Luo et al. 2001,
Maruyama-Funatsuki et al. 2004,
He et al. 2005).
Glu-A1 유전자좌에 존재하는 HMW-GS 대립유전자
A1a (
1) 및
A1b (
2*)는
A1c (
Null) 보다,
Glu-B1 유전자좌에 존재하는
B1b (
7+8),
B1c (
7+9) 및
B1i (
17+18)은
B1d (
6+8) 및
B1e (
20+20) 보다 밀가루 반죽과 제빵 적성에 좋다고 보고되었다(
Payne et al. 1987). 그리고
Glu-D1 유전자좌에 존재하는
D1d (
5+10)은
D1a (
2+12)에 비해 반죽의 글루텐 강도(
Ng & Bushuk 1987,
Horvat et al. 2006), 밀가루 품질(
Jiang et al. 2019) 및 제빵 품질에 더 좋다고 보고되었다(
Brönneke et al. 2000,
Horvat et al. 2006). 가공 품질에 대한
Glu-D1의
D1d (
5+10) 및
D1a (
2+12)의 효과가 더 분명하지만 더 정확한 평가를 위해
Glu-A1 및
Glu-B1의 다른 대립유전자와의 조합의 평가도 필수적이다. LMW-GS는 1번 염색체의 단완에 있는
Glu-3 유전자좌
Glu-A3,
Glu-B3 및
Glu-D3에 의해 암호화된다(
Gupta & Shepherd 1990). 그리고 x-type과 y-type 두가지만 가지는 HMW-GS와 달리 LMW-GS는 각 유전체별로 발현하는 개수가 계통마다 다르고 관찰된 밴드 패턴의 복잡성과 LMW-GS와 글리아딘의 이동성의 중첩으로 인해 LMW-GS의 기능과 이러한 단백질의 대립유전자 변이가 밀 품질에 미치는 영향에 대한 연구는 HMW-GS보다 훨씬 어렵다(
Gupta et al. 1994a,
Maruyama-Funatsuki et al. 2004).
Glu-A3 유전자좌에 존재하는
A3b와
A3d는 밀가루 반죽 특성이 강하고 제빵적성에 좋다고 알려져 있으나(
Gupta et al. 1991,
Ito et al. 2011,
Zhang et al. 2012,
Jin et al. 2013)
A3e는 반죽 특성이 약하고 제빵적성이 좋지 않다(
Eagles et al. 2002,
Zhang et al. 2012).
Glu-B3 유전자좌에 존재하는
B3b는 강한 반죽 특성(
Gupta et al. 1991,
1994b), 우수한 제빵 품질(
Zhang et al. 2012)을 나타낸다고 알려졌고,
B3g 또한 제빵 적성이 우수하고(
Zhang et al. 2012), 높은 침전가 값을 나타내며(
Si et al. 2013), 믹소그래프에서 강한 반죽특성을 나타낸다고 보고되었다(
Jin et al. 2013).
Glu-D3의 유전자좌에 존재하는 대립유전자들은
Glu-A3와
Glu-B3 대립유전자들에 비해 반죽 특성에서 작은 역할을 한다고 보고 하였다(
Zhang et al. 2012).
반죽 및 가공 특성이 좋은 밀 계통 육성을 위해서는 HMW-GS, LMW-GS의 유전자 조성 평가 및 선발이 중요한데, 글루텐 단백질 조성의 대립 유전자를 구별할 수 있는 많은 유전자 마커가 개발되어 신속한 유전자 분석을 가능하게 하였다. HMW-GS의
Glu-1A 유전자좌에서
Ax2*를 구별하는 PCR 마커(
Liu et al. 2008)와,
Glu-1Bx의
Bx7,
Bx7OE,
Bx7*,
Bx14,
Bx17,
Bx20 (Butow et al. 2003,
Ragupathy et al. 2008,
Xu et al. 2008,
Espi et al. 2012,
Geng et al. 2014)를 구별하는 마커,
Glu-1By의
By8,
By9,
By16,
By18 선별 마커가 보고되었고(
Lei et al. 2006,
Liang et al. 2015, Franket al. 2017),
Glu-1Dx의
Dx2와
Dx5,
Glu-1Dy의
Dy10과
Dy12를 선별할 수 있는 마커가 보고되었다(
Liu et al. 2008). LMW-GS는
Glu-A3 유전자좌의
A3a,
A3b,
A3ac,
A3d,
A3e,
A3f,
A3g 대립유전자를 선별할 수 있는 마커가 보고되었고(
Wang et al. 2010),
Glu-B3 유전자좌의
B3a,
B3b,
B3c,
B3d,
B3e,
B3f,
B3g,
B3h,
B3i 대립유전자를 선별하는 마커가 보고되었으며(
Wang et al. 2009),
Glu-D3 유전자좌의
D3a,
D3b,
D3c,
D3d,
D3e 대립유전자(
Zhao et al. 2007a,
Zhao et al. 2007b)를 선별하는 마커가 보고되어 활용되고 있다.
우리나라의 밀 육종 프로그램에서는 각 가공 용도에 맞는 품질특성을 지닌 계통을 육성하는 것이 목표이며, 단백질 함량 및 질적 특성 그리고 종실 경도에 따라서 강력분, 중력분, 박력분 용도를 구분하여 육종 하고 있다. 이처럼 용도별 밀 계통을 선발하기 위해서는 선발 지표로 밀가루 품질인 단백질 함량과 단백질의 질적 특성을 측정하는 SDS-sedimentation(침전가)이 중요하다. 세계 각국에서 대량의 밀 육종 시료의 품질 분석을 하기 위해 밀 원맥의 반사스펙트럼을 측정하여 비파괴 간이 분석할 수 있는 근적외선 분광분석기(NIR)를 활용하고 있다(
Abrams et al. 1987,
Williams & Norries 1987,
Clarke et al. 1992). 우리나라에서도 밀 계통의 효율적인 간이 품질 분석을 위해 NIR을 이용하여 단백질 함량, 침전가 등 몇 가지 항목에 대하여 검량선을 작성하였고, 대량의 시료를 빠른 시간 내 분석하여 육종 계통 및 시험 시료의 품질을 평가하는데 공식적으로 활용하고 있다(Kim et al. 2008a,
Kim et al. 2008b).
본 연구에서는 밀 단백질 함량과 침전가에 대한 글루텐 단백질 관련 유전자의 대립형질의 효과를 구명하기 위해 다양한 국가에서 수집한 밀 607자원을 국내환경에서 재배하여 밀 원맥의 단백질 함량과 침전가를 NIR을 이용하여 조사하였고, HMW-GS 및 LMW-GS의 유전자형을 분자 마커로 평가하였다. 밀 유전자원의 NIR 검정 결과와 글루텐 마커 검정 결과를 종합해서 분석하여 밀 육종 프로그램에서 환경 변화에 안정적인 자원을 선발하여 교배모본으로 활용하고 고품질 밀 계통 육성 및 품종 개발의 자료로 이용하고자 하였다.
재료 및 방법
공시 재료
국내 육성 품종 및 계통을 포함하여 북한, 중국, 일본, 멕시코, 미국, 몽골에서 수집한 7개국 총 607자원(
Sohn et al. 2020)을2016년과 2017년 2개년간 국립식량과학원(전라북도 완주군) 전작 포장에서 재배한 원맥을 사용하였으며, 재배 방법은 농촌진흥청 표준재배법(RDA 2012)에 준하였다. 파종은 조파(줄뿌림)로 휴폭(25 cm)×파폭(5 cm)×휴장(4 m) 간격으로 2반복하였고, 시비량은 ha 당 91 kg (N), 74 kg (P
2O
5), 39 kg (K
2O)를 시용하였으며, 질소는 파종기에 40%, 생육재생기에 60% 분시 하였다. 수확은 출수 후 45일에 하였으며, 수확 후 탈곡 된 원맥을 자연 건조 후에 2.0 mm 체로 정선하였다.
밀 원맥의 품질 분석은 근적외선분광기(NIR, Foss, Denmark)를 이용하여 단백질 함량비와 침전가 값(SDS-sedimentation volume)을 측정하였다(
Kim et al. 2016). 측정 방법은 NIR tube에 원맥 10 g을 넣고 근적외선분광기로 시료에 대한 반사 스펙트럼을 측정한 뒤, 측정된 스펙트럼 값을 기존에 개발된 단백질(
R2=93.6, RMSECV=0.67)과 침전가(
R2=94.3, RMSECV=3.27) 검량 곡선에 대입하여 3 반복 측정하였다.
식물체의 어린잎을 채취하여 액체 질소로 급속 냉동시킨 후 plastic grinder를 이용하여 분쇄하였다. Genomic DNA는 200 mg 잎 분말로부터 식물 Genomic DNA prep kit (Solgent, Korea)을 이용하여 추출하였고, 추출된 Genomic DNA는 Nanodrop 1000 spectrophotometer (Thermo Scientific, Wilmington, USA)를 이용하여 정량 하였다. PCR 분석은 VerityTM Dx 96-Well Thermal Cycle (Applied Biosystem, USA)를 이용하였고, PCR 반응을 위해 100 ng Genome DNA, PCR buffer, 2 pmole primer 그리고 200 μΜ dNTP에 1 unit의 Tag polymerase (Genetbio Prime DNA polymerase, Korea)를 사용하였다. 조건은 94℃에서 5분간 pre-denaturation을 수행한 후, denaturation 94℃에서 30초, annealing 57℃에서 30초, extension 72℃에서 30초 과정을 35회 반복하였다. 이후 final extension 72℃에서 5분간 진행하였다. PCR 산물은 1.2% agarose gel에서 전기영동 후 젤 이미지 시스템(Davinch-K, Korea)으로 이미지를 획득하였다
글루테닌 유전자형 분석
글루테닌 유전자형은 HMW-GS (High molecular weight glutenin subunits) 관련 6개(
Ax2*,
Bx7OE,
By8,
By9,
Dy10,
Dy12) 유전자와 LMW-GS (Low molecular weight glutenin subunits) 관련 6개(
A3a,
A3d,
A3f,
B3b,
B3c,
B3g), 총 12개의 유전자를 잘 알려진 판별 마커를 이용하여 분석하였다(
Table 1). 유전자형은 11개의 마커를 이용하여 분석하여 agarose gel에서 증폭되는 밴드는 ‘1’, 증폭되지 않으면 ‘0’으로 값을 표기하였다. 그리고 ‘1’과 ‘0’은 각각 ‘a’와 ‘b’로 변환하여 결과값의 판별 마커의 다형성을 일관되게 설명하였다.
데이터의 통계적 분석은 R software (ver. 3.5.1)을 이용하여 분산분석(ANOVA)을 실시하고 Duncan 검정으로 유의성을 검정하고 상관관계는 피어슨의 상관계수를 이용하였다. 모든 시험은 3회 반복으로 실시하였으며, 분산분석은 단백질과 침전가의 품질 값과 글루테닌 marker에 대한 유전자형의 정량적 변수를 이용하였으며, 피어슨의 상관계수는 전체 607개의 밀 자원의 단백질 함량, 침전가 값 평균과 12개의 글루테닌 유전자형에서 유의수준 p<0.05 수준으로 실시하였다.
결과 및 고찰
밀 자원의 단백질 함량과 침전가 분석
글루텐 강도는 밀의 품질에 상당한 영향을 미치며(
Rubenthaler et al. 1990,
Addo et al. 1991,
Slade & Levine 1994,
Kweon et al. 2011), 침전가(SDS-Sedimentation Volume) 값과 글루텐 함량은 글루텐 강도를 평가하는 중요한 지표로 사용되고 있다(
Axford et al. 1978,
Peña-Bautista 2002,
He et al. 2004). 본 연구에서는 2년간 607개 밀 자원의 품질 특성인 단백질 함량과 침전가 값(
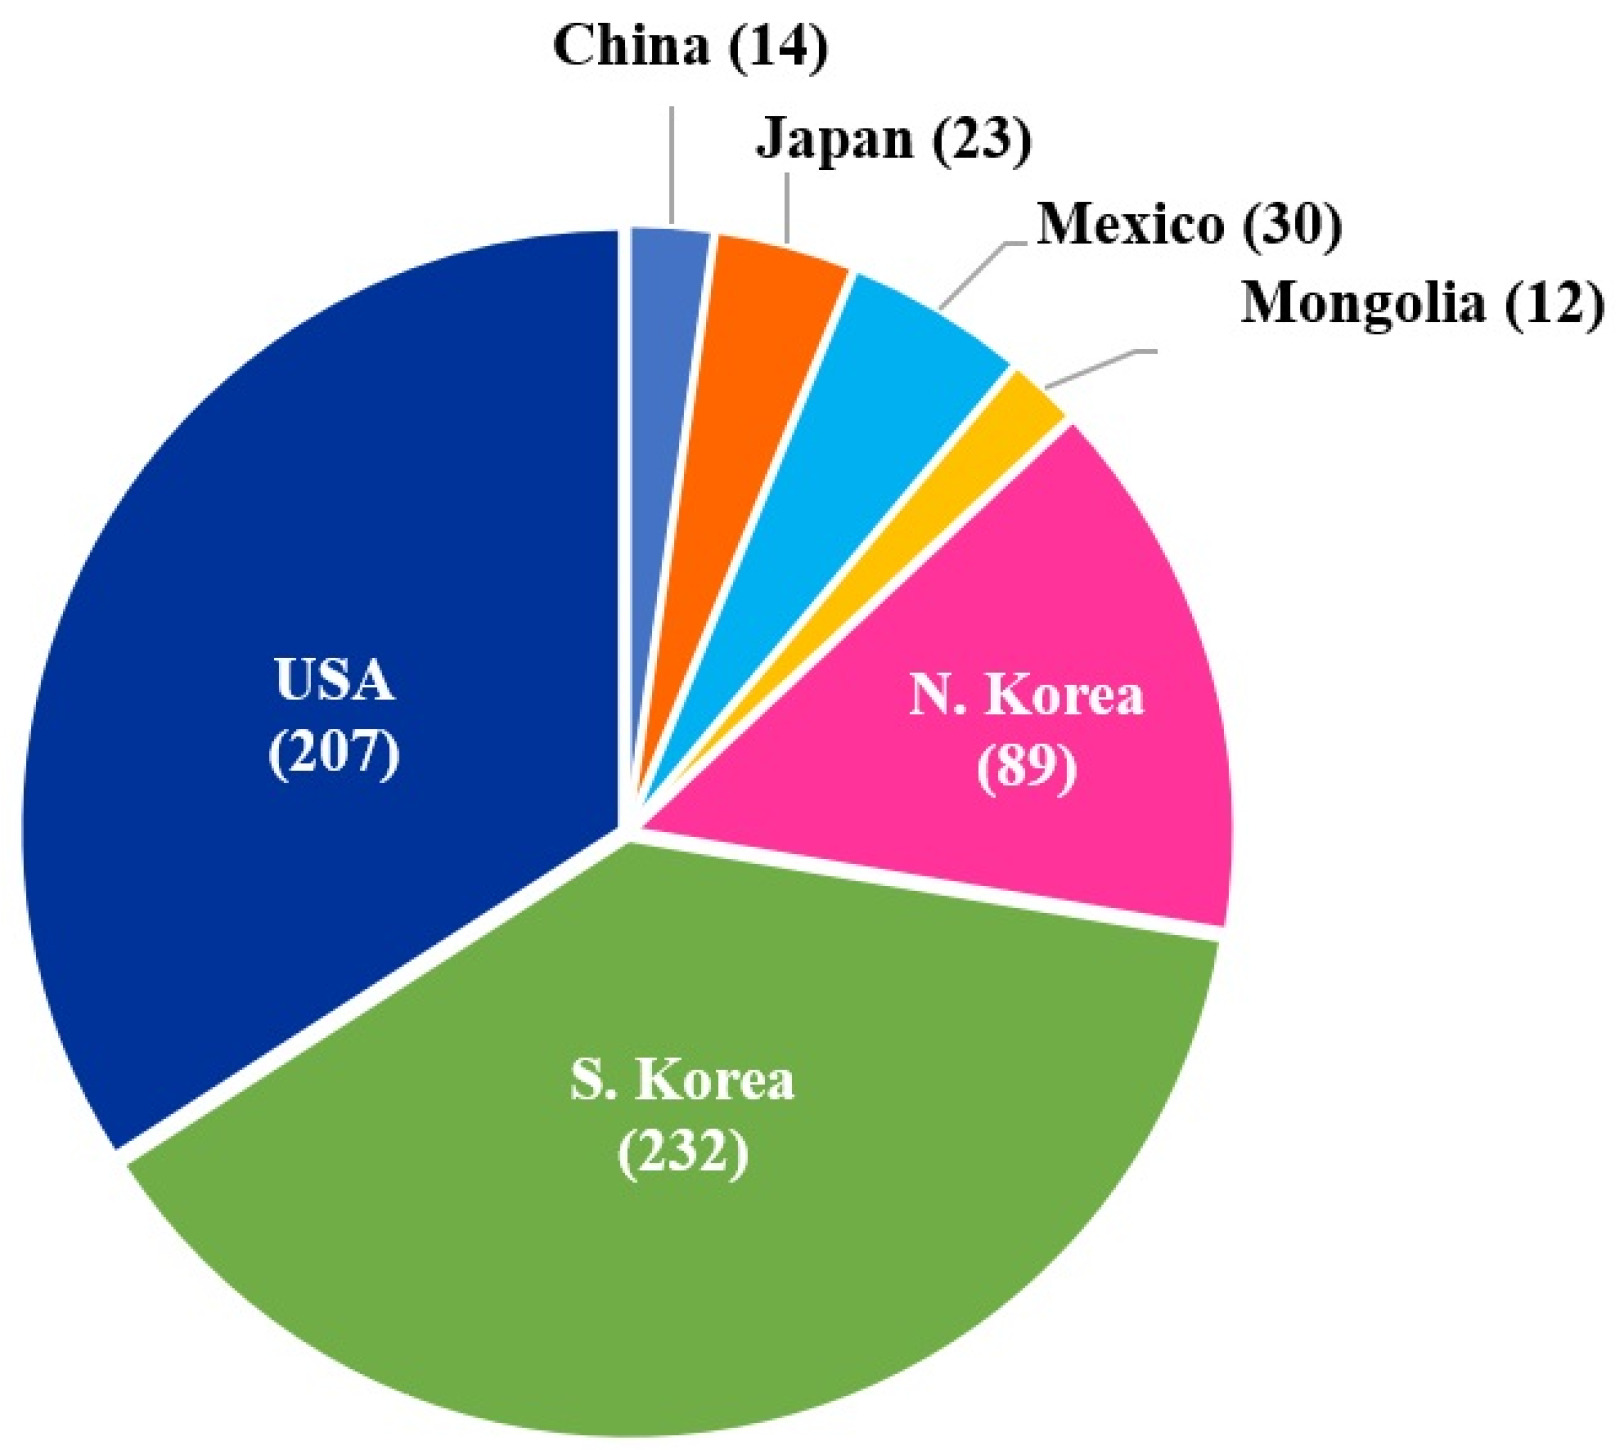
Table 2)을 측정하였다. 7개 나라에서 수집한 전체 밀 607자원의 국가별 분포는 몽골 12점(1.98%), 중국 14점(2.3%), 일본 23 점(3.79%), 멕시코 30점(4.94%), 북한 89점(14.66%), 미국 207점(34.1%), 국내 232점(38.22%)으로 구성되었다(
Fig. 1). 607자원의 2016년 평균 단백질 함량은 12.5±1.96%였으며 2017년 평균 단백질 함량은 11.9±2.71%였다(
Table 2). 단백질 함량은 분산분석 결과 2016년에는 국내자원과 비교하여 미국자원이 유의하게 높은 값을 나타냈으나 다른 국가와는 유의성을 나타내지 않았다. 멕시코자원과 몽골자원의 평균 단백질 함량 값은 미국자원과 비슷하거나 높았지만 유의성을 나타내지 않은 것은 자원수가 많지 않기 때문으로 판단된다. 그리고 2017년도에는 국내자원에 비해 북한자원과 미국자원이 유의하게 낮게 나왔으며 다른 국가자원과는 유의성을 나타내지 않았다. 그러나 미국과 북한자원의 연차간 단백질 함량 값의 차이가 커서 단백질 함량 값 비교는 의미를 나타내지 못하였다(
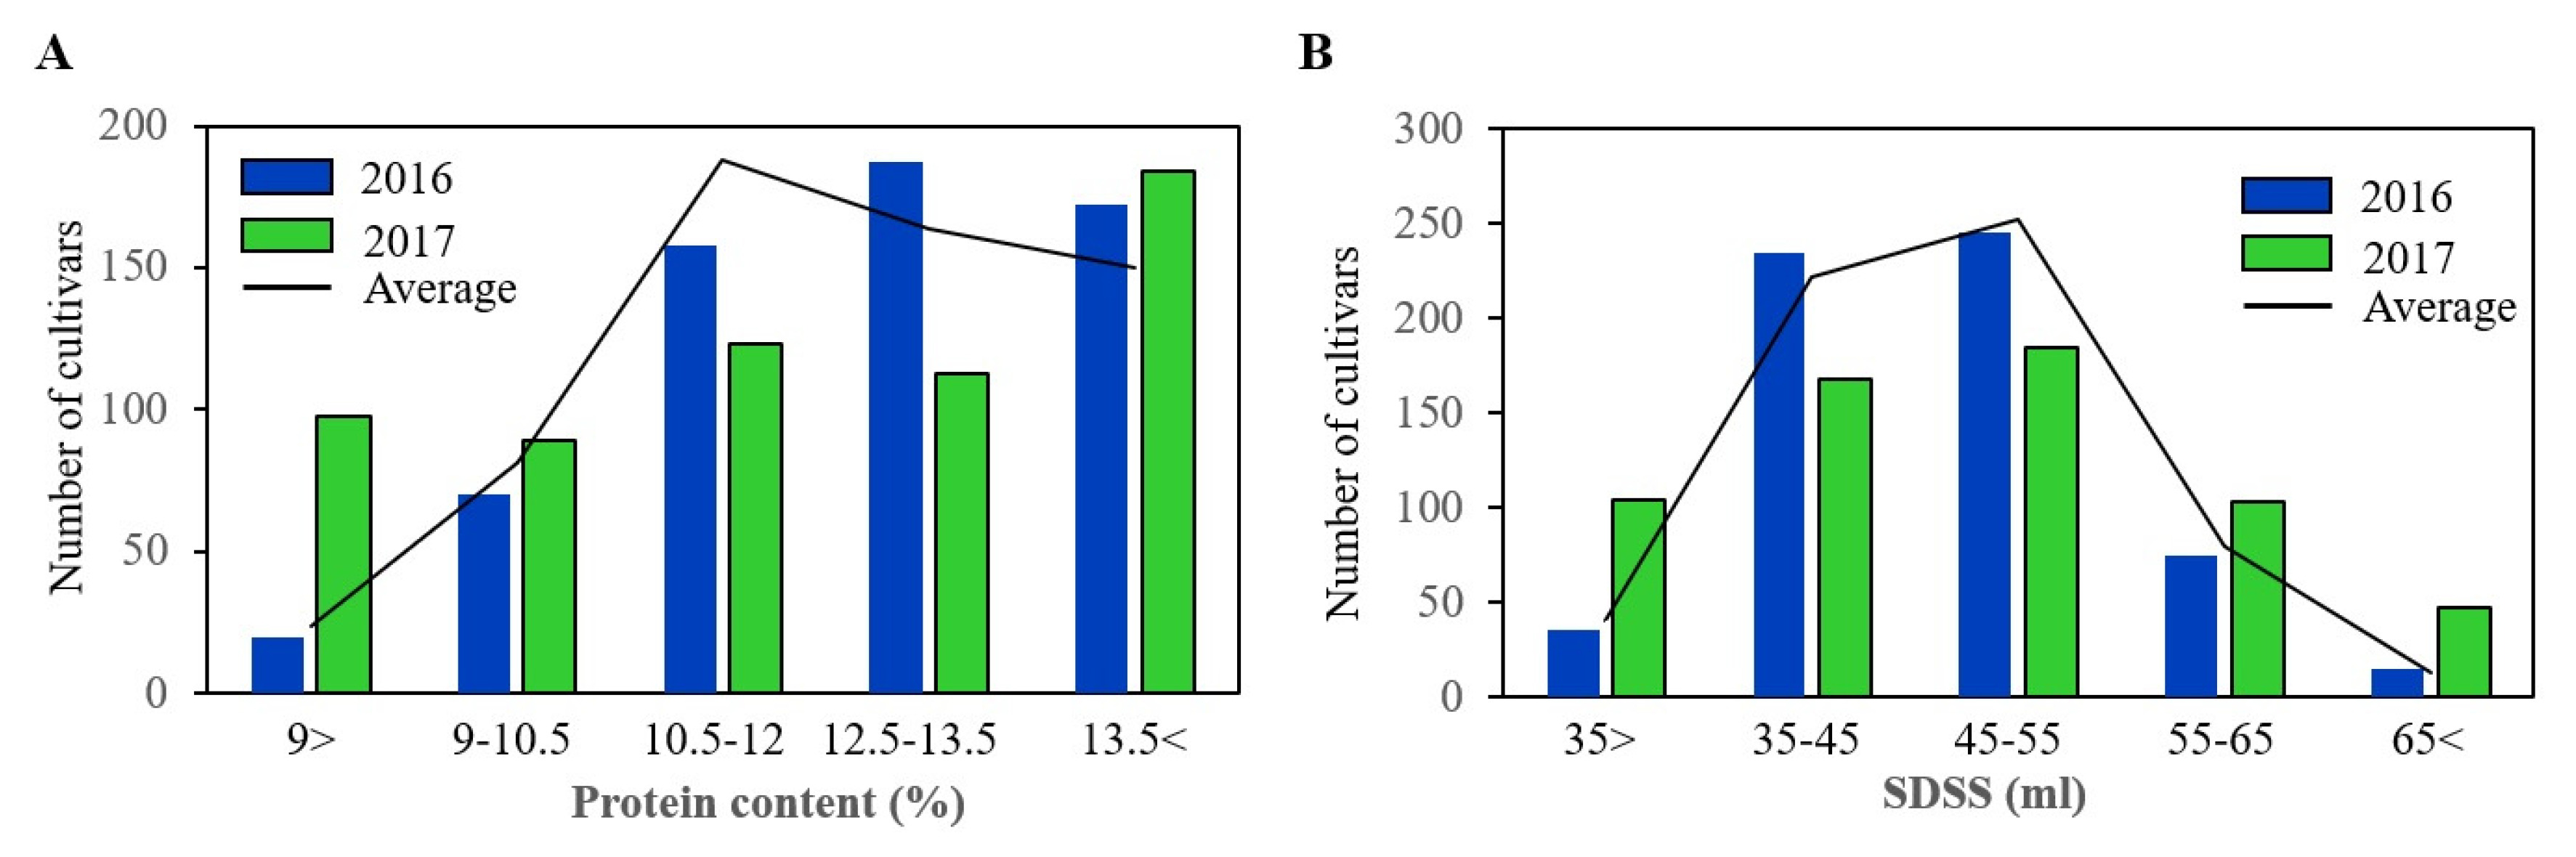
Table 2). 전체 자원의 단백질 함량은 2년 평균 12.2±1.86%로 품종간18.3%-7.6% 범위를 보였으며 품종간 차이가 컸다(
Fig. 2A). HI-LINE(미국)이 가장 높은 단백질 함량(18.3±0.35%)을 나타냈으며 국내 육성계통 Iksan 354가 가장 낮은 단백질 함량(7.6±1.91%)을 나타냈다(
Table 3). 연차간 자원들의 단백질 함량의 변이 평균은 1.86% 이며, 가장 큰 변이를 나타낸 자원은 TAM 108 (미국) 로 8.91% 차이가 났으며, 변이가 가장 적은 자원은 2개년간 단백질 함량 편차가 없는 NE 84557 (미국)과 Iksan 374이었다.
침전가 값은 가공 및 최종 제품 품질을 예측할 목적으로 오랫동안 사용되어 왔다(
Cubadda et al. 2007,
Morris et al. 2007,
Caballero et al. 2008,
Clarke et al. 2010,
Kang et al. 2010,
Oelofse et al. 2010). 607자원의 2016년 침전가 값은 46.7±8.41 mL이었으며 2017년 침전가 값은 47.0±12.22 mL이었다(
Table 2). 침전가 값은 분산분석(ANOVA) 결과 2016년에는 국내자원에 비해 북한자원이 유의미하게 낮게 나왔으며 다른 국가자원과는 유의성을 나타내지 않았다. 멕시코자원과 일본자원의 침전가 값이 북한자원과 비슷하거나 낮게 나왔지만 유의성을 나타내지 못한 것은 자원수가 적기 때문으로 판단된다. 그리고 2017년도에는 국내자원과 비교하여 미국자원, 북한자원, 멕시코자원이 유의미하게 낮게 나왔으나 다른 국가자원과는 유의성을 나타내지 않았다. 2년간 미국자원, 북한자원과 멕시코자원의 침전가 값이 국내자원보다 낮았으나 미국자원은 연차간 차이가 컸다(
Table 2). 2년간 침전가 값의 평균은 46.9±8.39 mL로 품종간 76.7-30.1 mL범위를 나타내 품종간 큰 차이를 보였다(
Fig. 2B). 침전가 값이 가장 높은 자원은 단백질 함량이 가장 높았던 HI-LINE으로 76.7±1.98 mL이었고, 가장 낮은 자원은 Kenya Heroe (미국) 로 30.1±11.81 mL이었다(
Table 4). 침전가 값의 평균 표준편차는 8.39 mL 로 국내 재래종 Namhae Collection04 자원이 24.4 mL 차이로 가장 큰 차이를 보였고, 국내 육성계통 Iksan 374는 2년동안 차이가 없었다(
Table 4). 단백질 함량의 변이가 가장 적은 NE 84557과 Iksan 374의 침전가 값의 연차 간 차이는 각각 2.12 mL과 0.0 mL로 나타났으며, 침전가 값의 차이가 가장 적은 두 자원인 NE 84557과 Iksan 374의 단백질 함량의 연차 간 차이는 없었다.
밀 607자원들 중에서 연차 간 단백질 함량의 표준편차가 1.0% 내외인 자원은 167자원이며, 침전가 값의 표준편차가 5.0 mL 내외인 자원은 197자원이었다. 2016년도에 전체 품종의 단백질 함량의 평균은 12.5%, 침전가 값은 46.7 mL이였으며, 2017년도에는 전체 품종의 단백질 함량이 11.9%, 침전가 값은 47.0 mL로 나타났으며, 평균 단백질 함량은 2017년도에 비해 2016년도가 0.6% 높았고 침전가 값은 비슷한 수준을 보였다.
밀 자원의 글루테닌 단백질 기능 마커 평가
우리는 먼저 글루테닌 유전자 조성이 단백질 함량과 침전가 값에 미치는 영향을 조사하고자 밀 607 자원의 HMW-GS
Glu-A1,
Glu-B1,
Glu-D1 관련 유전자 조성과 LMW
Glu-A3와
Glu-B3 유전자 조성을 유전자 판별 마커로 분석하여 각 나라별로
Table 5에 나타내었다. 본 연구에 이용된 HMW-GS 기능 마커는
Glu-A1의
Ax2* 유전자와,
Glu-B1의
Bx7OE,
By8과
By9 유전자, 그리고
Glu-D1 Dy10과
Dy12 유전자 마커를 사용하였고, LMW-GS 기능 마커는
Glu-A3의
A3a,
A3d와
A3f 유전자,
Glu-B3의
B3b,
B3c와
B3g유전자 마커를 사용하였으며 그 결과는
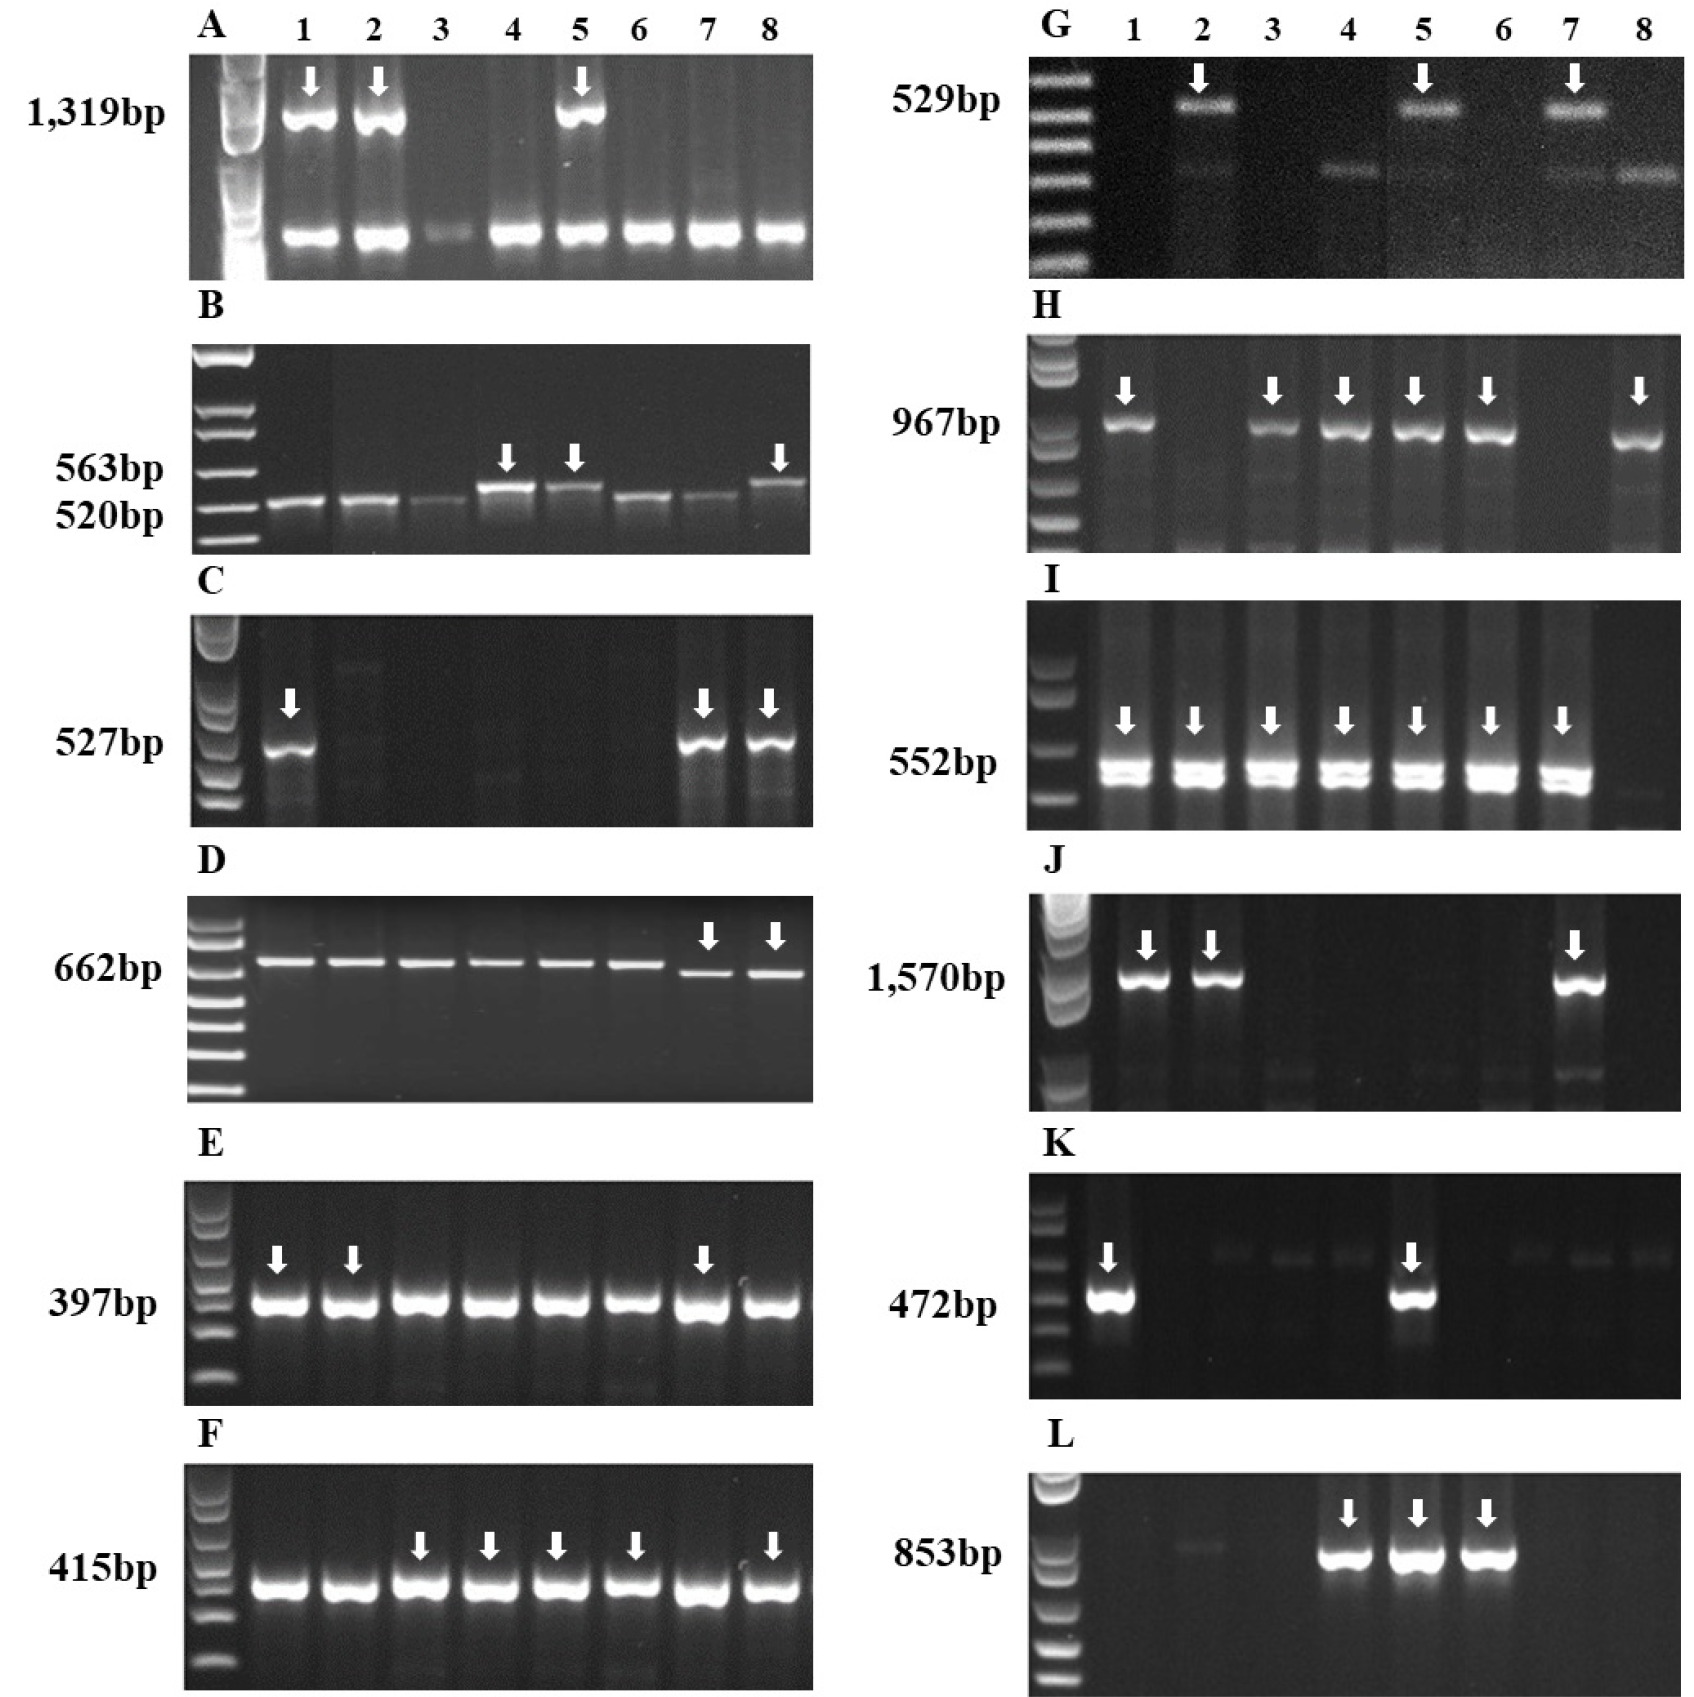
Fig. 3에서 보는 바와 같다.
국내 자원에서 Glu-1A유전자좌의 Ax2* 대립유전자를 지닌 자원은 71 점으로 30.6% 였으며 Glu-1B의 Bx7OE 대립유전자는 검출되지 않았다. Glu-1B유전자좌의 By8 대립유전자는 130점으로 56.03% 였으며, By9 대립유전자는 15점(6.47%)으로 비율이 매우 낮았다. Glu-1D의 Dy10 대립유전자는 88점으로 37.93% 였으며 Dy12 대립유전자는 143점으로 61.64%였다. 미국 자원 중 Ax2* 대립유전자를 가진 자원이 108점으로 52.17% 였으며 Bx7OE 대립유전자는 전체 7자원중 6점이 미국 자원이었다. 그리고 미국자원은 By8 대립유전자(27.54%) 자원비율이 By9 대립유전자(2.42%) 자원비율보다 높았고, Dy10 대립유전자(49.28%)와 Dy12 대립유전자(48.79%) 비율은 비슷하였다. 중국자원은 By8 대립유전자(71.43%)와 Dy10 대립유전자(64.29%) 비율이 높았고, 북한자원은 Ax2* 대립유전자의 비율이 7.87%로 매우 낮았으며, Dy12 (65%)의 비율은 상대적으로 높았다. 중국, 일본, 멕시코 자원에서는 By9 대립유전자가 검출되지 않았으며, 몽골 자원에서는 By8 대립유전자가 검출되지 않았는데, 분석된 해당 국가의 자원 수가 적었기 때문에 검출되지 않은 것으로 판단된다.
국내자원의 LMW-GS Glu-A3유전자좌의 A3a, A3d, A3f 대립유전자를 포함하는 자원은 각 10점(4.31%), 59점(25.43%), 4점(1.73%)로 A3d 대립유전자를 포함하는 자원 비율이 높았으며, Glu-B3의 B3b, B3c, B3g의 비율은 각 17점(7.33%), 2점(0.86%), 22점(9.48%)으로 모두 낮았다. 북한과 중국은 A3a의 비율이 각 18점(20.22%)과 4점(28.57%)으로 높았으며 몽골은 A3f 대립유전자와 B3g 대립유전자를 지닌 자원이 4점(33.33%)으로 비율이 높았다. 반면 일본, 미국, 멕시코, 중국, 몽골에서는 B3c 대립유전자는 검출되지 않았으며, 멕시코자원과 몽골국 자원에서는 B3b대립유전자가 검출되지 않았고, 일본자원에서는 A3a 대립유전자가, 중국자원에서는 A3d와 A3f 대립유전자가 검출되지 않았는데, 평가된 LMW-GS 조성이 한정적이고, 해당 국가별 자원 수가 적었기 때문에 검출되지 않은 것으로 판단된다.
HMW-GS 대립유전자와 단백질 품질 관계
빵 품질은 단백질 함량뿐만 아니라 글루텐 단백질 조성에 의해서도 결정된다(
Chaudhary et al. 2016). 제빵 특성 지표 중 하나인 침전가 값의 양적 특성은
Glu-1,
Glu-A3,
Glu-B3 및
Gli-B1과 같은 글루테닌 및 글리아딘 유전자형과 밀접하게 관련되어 있다(
Payne & Lawrence 1983,
Payne et al. 1984,
Shewry et al. 2003,
Maucher et al. 2009,
Reif et al. 2011,
Deng et al. 2015,
Guo et al. 2020). 우리는 HMW-GS의 유전자 조성이 단백질 함량과 침전가 값에 미치는 영향을 조사하고자 유전자 조성별 단백질 함량과 침전가 값을
Table 6에 나타내었다.
Glu-A1의
Ax2* 유전자 판별 마커에 다형성 밴드를 보인 자원은 총 209점으로 단백질 함량은 12.3±1.89%, 침전가 값은 46.9± 8.70 mL를 보였으며, 다형성 밴드를 보이지 않은 398점의 단백질 함량은 12.1±1.85%, 침전가 값은 46.9±8.24 mL를 나타냈다.
Glu-B1의
Bx7OE,
By8,
By9 유전자 판별 마커에 다형성 밴드를 보인 자원은 각각 7점, 254점 47점으로 단백질 함량은 각각 12.0±2.32%, 12.3±1.77%, 12.3±2.13%로 측정되었다. 그리고 침전가 값은 각각 45.5±7.59 mL, 47.9±7.92 mL, 48.2±9.61 mL을 나타냈다.
Glu-B1의
Bx7OE,
By8,
By9 유전자 판별 마커에 다형성 밴드를 보이지 않은 자원은 각각 600점, 353점, 560점이었으며, 단백질 함량은 각각 12.2±1.86%, 12.1±1.93%, 12.2±1.84%를 보였으며, 침전가 값은 각각 47.0±8.41 mL, 46.3±8.67 mL, 46.8±8.28 mL을 보였다.
Glu-D1의
D1d (Dx5+Dy10)은
D1a (Dy2+Dy12)에 비해 높은 글루텐 강도(
Ng & Bushuk 1987,
Horvat et al. 2006)와 밀가루 품질을 보인다(
Gianibelli et al. 2001,
Jiang et al. 2019,
Chen et al. 2021).
Glu-D1의 경우,
Dy10과
Dy12 유전자 판별 마커에 다형성 밴드를 보인 자원은 각각 255점, 345점이였으며, 단백질 함량은 각각 12.5±1.90%와 12.0±1.83%를 나타냈고, 침전가 값은 각각 48.2±8.86 mL와 46.0±8.00 mL을 나타냈다. 그리고
Glu-D1의
Dy10과
Dy12 유전자 판별 마커에 다형성 밴드를 보이지 않은 자원은 각각 352점과 262점이였으며, 단백질 함량은 각각 12.0±1.82%와 12.5±1.87%를 나타냈고, 침전가 값은 각각 46.0±7.93 mL와 48.2±8.75 mL을 나타냈다. 전체 607 자원에서
Ax2* 유전자형인 자원은 34.4% 였으며,
Bx7OE 유전자형인 자원은 1.15%로 빈도가 매우 낮았다. 그리고
By8과
By9 유전자형인 자원은 각각 41.85%와 7.74%로
By8의 빈도가 훨씬 높았으며,
Dy10과
Dy12 유전자형인 자원은 각각 42.01%과 56.84%로 모두 높은 빈도를 보였다(
Table 6).
본 실험에서는 HMW-GS
Glu-D1의
Dy10과
Dy12 유전자형 사이와 단백질 함량과 침전가 값 사이에서만 통계적으로 유의한 상관이 있었고, 그 외에 다른
Glu-A1,
Glu-B1,
Glu-D1 유전자좌의 대립유전자들과 단백질 함량 및 침전가 값 사이에서는 통계적으로 유의한 상관은 나타나지 않았다(
Table 7). 그 이유로는
Glu-D1에서 발현하는 HMW-GS 유전자의 조성은 대부분
D1a (
2+12),
D1b (
3+12),
D1c (
4+12),
D1f (
2.2+12) 또는
D1d (
5+10) (
Payne & Lawrence 1983) 로 구성되어 있어 본 연구에서 분석한
Dy10와
Dy12로
Glu-D1의 HMW-GS 조성을 구분할 수 있기 때문이다. 그리고 Dy10을 지닌
D1d (5+10)의 조성이 Dy12를 지닌 다른 조성들에 비해 빵 품질에 대한 글루텐 단백질의 효과가 더 분명하다고 알려져 있기는 하나(
Anjum et al. 2007), 하나의 글루텐 유전자 조성만으로는 자원들 간 단백질 함량과 침전가의 차이를 확인할 수 없었던 것으로 판단된다.
LMW-GS 또한 밀 단백질 품질에 중요 하지만 HMW-GS보다 더 다양하고 복잡하다. LMW-GS가 단백질 함량과 침전가 값에 미치는 영향을 조사하기 위해 밀 607 자원의
Glu-A3와
Glu-B3 유전자 조성별 단백질 함량과 침전가 값을 조사하였다(
Table 8).
Glu-A3의
A3a,
A3d, 그리고
A3f 유전자의 판별마커에 다형성 밴드를 보인 자원은 각각 40점, 99점, 33점이었으며, 단백질 함량은 각각 11.7±1.81%, 12.0±1.84%, 11.6±2.02%를 나타냈고, 침전가 값은 각각 45.2±6.96 mL, 47.2±8.14 mL, 44.4±8.64 mL을 나타냈다. 그리고 다형성 밴드를 보이지 않은 자원은 각각 567점, 508점, 574점으로 단백질 함량은 각각 12.2±1.87%, 12.2± 1.87%, 12.2±1.85%를 나타냈고, 침전가 값은 각각 47.1±8.48 mL, 46.9±8.45 mL, 47.1±8.36 mL을 나타냈다.
A3a와
A3f 유전자형에서 다형성을 보이지 않는 자원에 비해 다형성을 보이는 자원에서 단백질 함량과 침전가 값이 약간 낮게 나왔으나(
Table 8) 통계분석에서는 유의하지 않았다(
Table 7). 그리고,
Glu-B3의
B3b,
B3c,
B3g 유전자 판별 마커(
Wang et al. 2009)에 다형성 밴드를 보인 자원은 각각 81점, 6점, 86점이었으며, 단백질 함량은 각각 12.2±1.98%, 12.1±2.05%, 11.8±1.86%를 나타냈고, 침전가 값은 각각 46.7±8.09 mL, 45.1±11.18 mL, 44.8±8.35 mL을 나타냈다. 그리고 다형성 밴드를 보이지 않은 자원은 각각 526점, 601점, 521점으로 단백질 함량은 12.2±1.85%, 12.2±1.87%, 12.3±1.86%를 나타냈고, 침전가 값은 47.0±8.45 mL, 46.9±8.37 mL, 47.3±8.36 mL을 나타냈다.
B3g 유전자형에서도 다형성을 보이지 않는 자원에 비해 다형성을 보이는 자원에서 단백질 함량과 침전가 값이 약간 낮게 나왔으나(
Table 8) 통계분석에서는 유의하지 않았다(
Table 7). 그리고 침전가 값에 대한 다른 대립유전자의 영향은 유의하지 않았다. 전체 607 자원에서
A3a,
A3d,
A3f 유전자형을 가진 자원은 각각 6.6%, 16.3%, 5.44% 였으며,
B3b,
B3c,
B3g 유전자형을 가진 자원은 각각 13.34%, 0.99%, 14.07%를 보여
B3b유전자형의 빈도가 매우 낮았다(
Table 5).
본 실험에서 사용된 LMW-GS의 Glu-A3, Glu-B3관련 대립 유전자형(A3a, A3f, B3g)에서 다형성을 보이지 않는 자원에 비해 다형성을 보이는 자원의 단백질 함량과 침전가 값이 약간 낮게 나왔으나 통계분석에서는 유의하지 않았다. 그 이유는 LMW-GS 하나의 유전자가 단백질 함량과 침전가 값을 설명할 수 있을 정도로 영향력이 크지 않으며, HMW-GS 유전자 조합도 매우 중요하기 때문으로 판단된다. 결론적으로 개별의 글루테닌 조성보다는 HMW-GS와 LMW-GS 조합이 중요하다고 판단된다.
HMW-GS 대립 유전자 조합별 단백질 품질
HMW-GS의
Glu-A1,
Glu-B1 및
Glu-D1 유전자좌에서 6개의 유전자(
Ax2*,
Bx7OE,
By8,
By9,
Dy10,
Dy12) 판별 마커에 다형성 밴드를 나타낸 자원의 단백질 함량과 침전가 값을
Table 9에 정리하였다. 3개의 HMW-GS 유전자좌에서 총 6개의 대립유전자 조합(AC: Allelic combination)을 확인하였다. 단백질 함량이 가장 높은 조합은 AC 1 (
Ax2*,
Bx7OE,
Dy10)로 13.8±0.54%를 나타냈고, 가장 낮은 조합은 AC 2 (
Ax2*,
Bx7OE,
Dy12)로 10.6± 2.05%를 나타냈다. 침전가 값도 52.5±2.54 mL를 보인 AC 1이 가장 높게 나타났고, 41.9±8.77 mL를 보인 AC 2가 가장 낮은 조합으로 나타났다.
6개의 HMW-GS 조합에서 Glu-B1과 Glu-D1 유전자좌에서 조합별로 품질을 비교하였다. Glu-A1의 대립유전자는 Ax2*이고 Glu-D1의 대립유전자가 Dy10일 때 Glu-B1유전자좌의 대립유전자 By8 (AC 3)과 By9 (AC 5)는 비슷한 단백질 함량과 침전가 값을 보였다. Glu-D1의 대립유전자가 Dy12인 경우에는 By8과의 조합(AC 4)의 단백질 함량(12.2±1.87%)과 침전가 값(48.2±8.38 mL)은 대립유전자가 By9인 조합(AC 5)의 단백질 함량(11.1±1.44%)과 침전가 값(44.2±5.43 mL) 보다 약간 높았다. Glu-A1의 대립유전자는 Ax2*이고 Glu-B1의 대립유전자가 By8인 경우 Glu-D1의 대립유전자가 Dy10 (AC 3)인 조합이 단백질 함량(13.0±1.77%)과 침전가 값(50.5±8.47 mL)이 Dy12 (AC 4)인 조합의 단백질 함량(12.2±1.87%)과 침전가 값(48.2±8.38 mL) 보다 높았다. 그리고 Glu-A1의 대립유전자는 Ax2*이고 Glu-B1의 대립유전자가 By9인 경우에서도 Glu-D1의 대립유전자가 Dy10 (AC 5)인 조합의 단백질 함량(13.3±1.02%)과 침전가 값(49.8±5.09 mL)이 Dy12 (AC 6) 조합의 단백질 함량(11.1±1.44%)과 침전가 값(44.2±5.43 mL) 보다 높았다. 이 결과는 HMW-GS에서 Glu-A1의 대립유전자가 Ax2*를 지닌 경우에 Glu-B1의 By8 과 By9의 조성 보다 Glu-D1의 Dy10과 Dy12의 조성이 단백질의 품질에 더 큰 영향을 미치는 것으로 판단되며, 단백질 품질을 높이기 위해서는 HMW-GS의 Glu-D1 조성이 매우 중요하다는 것을 시사한다.
LMW-GS 유전자 조합별 단백질 품질
LMW-GS의
Glu-A3와
Glu-B3 유전자좌에서 6개의 대립유전자(
A3a,
A3d,
A3f,
B3b,
B3c,
B3g) 판별마커에 다형성 밴드를 나타낸 자원의 단백질 함량과 침전가 값은
Table 10에 정리하였다. 2개의 LMW-GS 유전자좌에서 총 7개의 유전자 조합을 확인하였다. 단백질 함량이 가장 높은 조합은 13.8±1.27%를 나타낸 AC 5 (
A3d+B3g)였고, 가장 낮은 조합은 10.6±0.82%를 나타낸 AC 6 (
A3f+B3b)이었다. 침전가 값이 가장 높은 조합 또한 53.3± 5.78 mL을 나타낸 AC 5였으며, 가장 낮은 조합은 39.6±6.81 mL을 나타낸 AC 4 (
A3d+B3c)였다.
Glu-A3의 A3a를 가진 자원들의 단백질 함량과 침전가 값은 B3b (AC 1)의 조합에서 13.0±2.22%와 44.8±5.12 mL를 보였고 B3g (AC 2)와의 조합에서는 11.4±3.36%와 47.4±14.08 mL을 나타내 AC 1의 조합이 AC 2 조합보다 높았다. Glu-A3의 A3d를 지닌 자원들은 B3g (AC 5)와의 조합에서 단백질 함량과 침전가 값이 13.8±1.27%과 53.3±5.78 mL를 나타냈으며, B3b (AC 3)와의 조합에서는 각각 13.3±3.18%와 51.4±12.29 mL, 그리고 B3c (AC 4)와의 조합에서는 11.2±0.87%과 39.6±6.81 mL를 나타냄으로써 B3g>B3b>B3c순으로 높았다. Glu-A3의 A3f를 지닌 자원들은 B3g (AC 7)와의 조합에서 단백질 함량과 침전가 값이 각각 11.5±1.57%와 39.6±6.24 mL를 보였고, B3b (AC 6)와의 조합에서는 단백질 함량과 침전가 값은 각각 10.6±0.82%와 42.5±2.19 mL를 보였다. A3f는 B3g와의 조합에서 B3b와의 조합보다 단백질 함량이 높고, B3b와의 조합에서는 B3g 보다 침전가 값이 높았다. Glu-B3의 B3b을 지닌 자원들의 단백질 함량과 침전가 값은 A3a (AC 1)와의 조합에서는 각각 13.0±2.22%와 44.8±5.12 mL를 보였으며, A3d (AC 3)와의 조합에서는 각각 13.3±3.18%와 51.4±12.29 mL를 보였다. 그리고 A3f (AC 6)와의 조합에서는 각각 10.6±0.82%와 42.5±2.19 mL를 보였고 단백질 함량과 침전가 값은 A3d>A3a>A3f순으로 높았다. Glu-B3의 B3g대립유전자를 지닌 자원들은 A3d (AC 5)와의 조합에서 단백질 함량과 침전가 값이 각각 13.8±1.27%와 53.3±5.78 mL를 보였고 A3f (AC 7)와의 조합에서 단백질 함량과 침전가 값은 각각 11.5±1.57%와 39.6±6.24 mL, 그리고 A3a (AC 2)와의 조합에서 단백질 함량과 침전가 값은 각각 11.4±3.36%와 47.4±14.08 mL를 보였다. B3g 대립유전자와의 조합에서 단백질 함량은 B3d>B3a=B3f 순이었고, 침전가 값은 B3d>B3a>B3f 순으로 높았다.
LMW-GS의 Gul-A3와 Glu-B3 대립 유전자 조합에서는 조성 차이에 따른 품질의 경향을 확인하기 힘들었다. 그 이유는 LMW-GS 유전자 조성이 매우 많아 본 실험에서 분석한 6개의 유전자에서 대립유전자 조합별 나타난 자원 수가 적었을 뿐만 아니라 LMW-GS 조성보다 HMW-GS 조성이 단백질 품질에 더 큰 영향을 미치기 때문이라고 판단된다. 따라서, 추후에는 글루테닌 조성이 다른 각각의 NILs (Near isogenic lines)를 다양하게 육성하여 품질 분석을 수행한다면 각각의 글루테닌 조성이 품질에 미치는 영향을 보다 정확하게 비교 분석할 수 있을 것으로 판단된다.
고품질 밀 자원의 글루텐 유전자 조성
자원들의 2년간 단백질 함량과 침전가 평균의 분포는
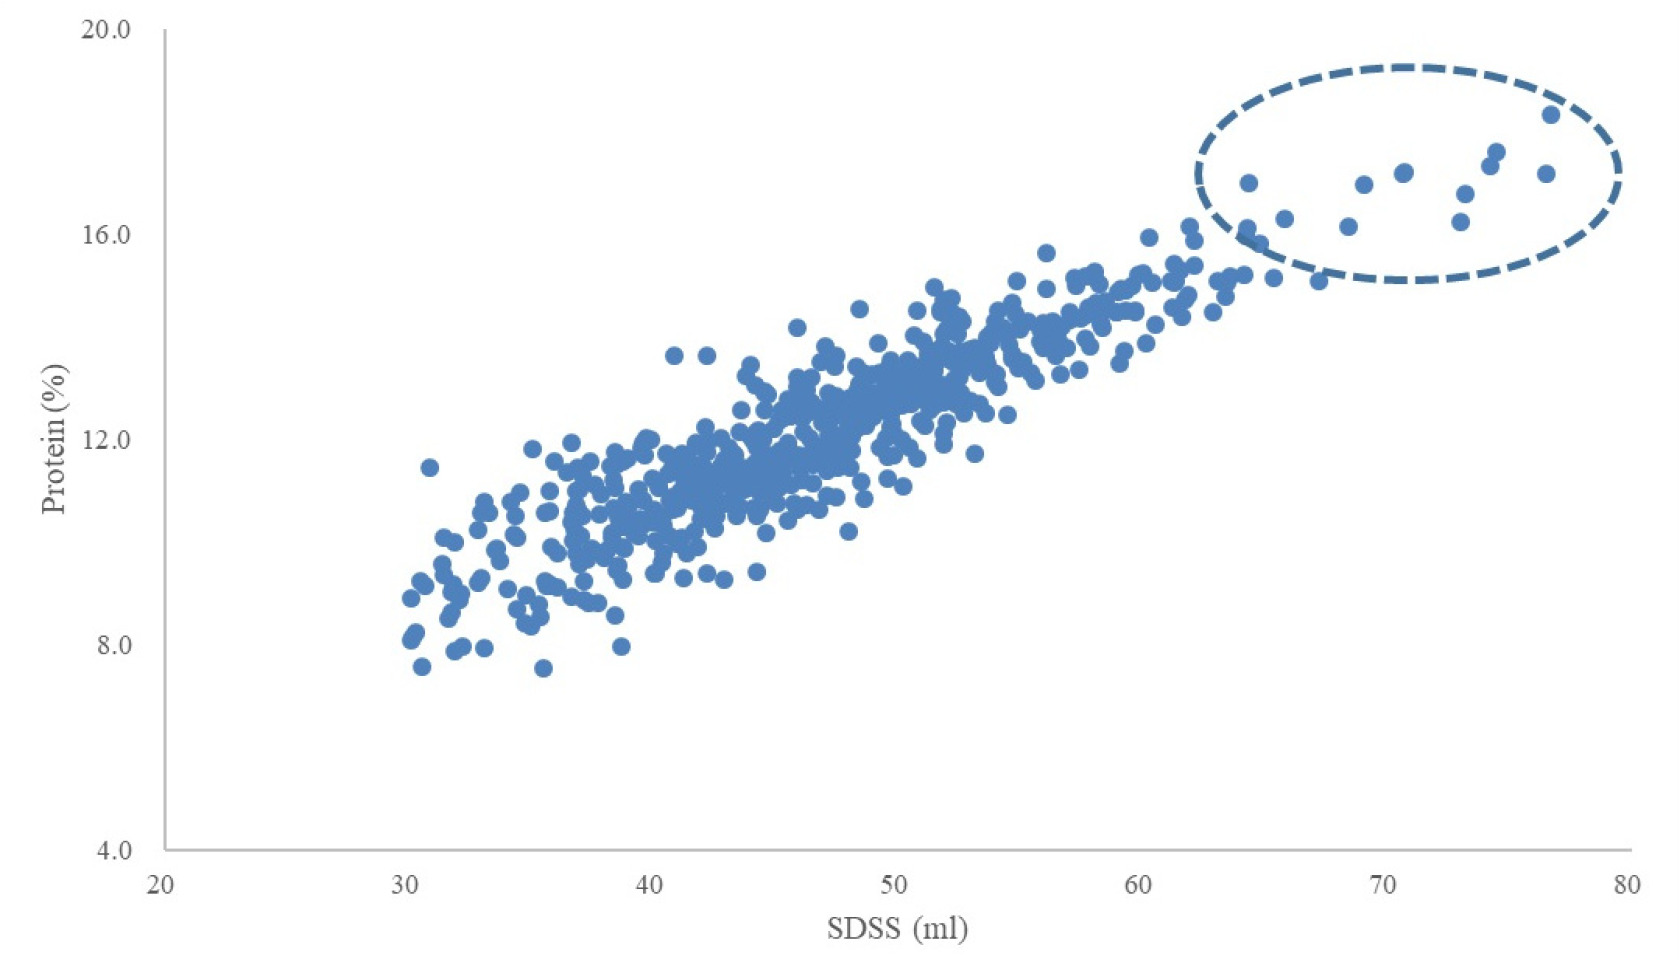
Fig. 4에 나타난 바와 같다. 고단백질 및 강한 반죽 특성을 지닌 자원을 선발하기 위해 단백질 함량은 16.0% 이상이면서 침전가 값이 60.0 mL 이상인 자원들을 그룹화 하여 총 14점을 확인하였다. 14점의 글루텐 조성을 분석한 결과
Glu-A1의
Ax2*를 지닌 자원은 5점이었고,
Glu-B1의
By8을 지닌 자원은 5점,
Glu-D1의
Dy10과
Dy12를 지닌 자원은 각각 8점과 6점으로 나타났다. 또한, 품질 안정성이 높은 자원을 선발하기 위해 단백질 함량과 침전가 값에 연차 간 차이를 보이는 자원들과 차이를 보이지 않는 자원들의 유전자 조성을 조사하였다. HI-LINE은 가장 높은 단백질 함량과 침전가 값을 보였으며 연차 간 단백질 함량과 침전가 값의 편차가 각각 0.35%와 1.98 mL로 연차 간 편차도 적어 단백질 품질이 우수한 자원으로 평가되었으며, 글루테닌 유전자 조성은
Ax2*,
By8, Dy10이였다. 그리고 연차간 가장 낮은 편차를 보인 Iksan 374의 단백질 함량과 침전가 값은 각각 13.3±0%과 54.0 mL를 나타내어 평균 이상이었으나, NE 84557은 11.2±0%와 43.3±2.12 mL를 나타내어 평균 이하였다. Iksan 374와 NE 84557의 글루테닌 유전자 조성은 각각
Ax2*,
By8,
Dy10,
A3d와
By9,
Dy12였다.
단백질 함량과 침전가 값은 환경 및 유전적 요인 모두에 의해 영향을 받는 복잡한 양적 특성이다. NIR을 이용한 품질 분석방법과 글루테닌 조성을 선별 할 수 있는 마커 평가를 통해 밀 자원 및 육종 계통의 품질 특성과 글루텐 조성을 빠르게 평가하여, 품질 변이가 적고 글루테닌 유전자 조성이 우수한 자원을 육종자원으로 활용함으로써 다양한 환경변화에도 고품질이면서 품질 변이가 적은 품종을 개발하는데 유용하게 활용할 수 있을 것으로 기대한다.
적 요
본 연구에서는 7개국에서 수집한 607자원의 밀 단백질 품질을 유전자원의 NIR 검정 결과와 글루텐 마커검정 결과를 종합해서 분석하고자 하였다. 2년 평균 단백질 함량은 12.2±1.86%이고 침전가 값은 46.9±8.39 mL를 보였다. 단백질 함량은 국가자원별로 큰 차이가 없었으나 침전가 값은 북한자원, 미국자원, 멕시코자원에서 국내자원보다 낮았다. 167 품종이 연차간 단백질 함량의 차이가 1.0% 내외였고, 197 품종의 침전가 값의 차이는 5.0 mL 이내였다. 자원들의 단백질 함량과 침전가 값은 품종간 7.6-18.3%와 76.7-30.1 mL범위를 나타내 품종간 큰 차이를 보였다. HI-LINE이 단백질 함량과 침전가 값이 가장 높게 나왔으며 연차간 편차도 적어 단백질 품질이 우수한 자원으로 평가되었다. 그리고 연차간 가장 낮은 편차를 보인 Iksan 374의 단백질 함량과 침전가 값은 각각 13.3±0%과 54.0 mL로 평균 이상이었으나, NE 84557은 11.2±0%과 43.3±2.12 mL로 평균 이하였다. 밀 607점의 자원 중에 Glu-A1의 Ax2* 유전자 판별 마커에 다형성 밴드를 보인 자원은 총 209자원으로 34.4%를 보였으며, Glu-B1의 Bx7OE 유전자형을 가진 자원은 7자원으로 1.15%를 보이며 낮은 빈도를 보였다. By8과 By9유전자 판별 마커에 다형성 밴드를 보인 자원은 각각 254점(41.85%)과 47점(7.74%)으로 By8의 유전자형 빈도가 By9 유전자형 빈도 보다 훨씬 높았다. 그리고 Glu-D1의 Dy10과 Dy12 유전자 판별 마커에 다형성 밴드를 보인 자원은 각각 255점(42.01%)과 345점(56.84%)으로 모두 높은 빈도를 보였다. 국내자원은 By8과 Dy12의 비율이 By9와 Dy10보다 높았다. Glu-D1의 Dy10과 Dy12 유전자 사이와 단백질 함량과 침전가 값 사이에서만 통계적으로 유의한 상관이 있었고, 그 외에 다른 Glu-A1, Glu-B1, Glu-D1 대립유전자들과 단백질 함량 및 침전가 값에서는 통계적으로 유의한 상관은 나타나지 않았다. LMW-GS의 A3a, A3d, A3f 유전자형을 가진 자원은 각각 6.6%, 16.3%, 5.44% 였으며, B3b, B3c, B3g 유전자형을 가진 자원은 각각 13.34%, 0.99%, 14.07%로 B3c유전자형의 빈도가 매우 낮았다. 국내자원은 Glu-A3d의 비율이 A3a와 A3f보다 높았으며 B3c유전자형의 비율이 매우 낮았다. 그리고 HMW-GS의 Glu-A1, Glu-B1 및 Glu-D1 유전자좌에서 6개의 유전자(Ax2*, Bx7OE, By8, By9, Dy10, Dy12) 판별 마커에 다형성 밴드를 나타낸 자원의 단백질 함량과 침전가 값이 가장 높은 조합은 AC 1 (Ax2*, Bx7OE, Dy10), 가장 낮은 조합은 AC 2 (Ax2*, Bx7OE, Dy12) 였다. HMW-GS에서 Glu-A1의 대립유전자가 Ax2*를 지닌 경우에 Glu-B1의 By8과 By9의 조성 보다 Glu-D1의 Dy10과 Dy12 조성이 단백질의 품질에 더 큰 영향을 미치는 것으로 판단되며, 단백질 품질을 높이기 위해서는 HMW-GS에서는 Glu-D1의 조성이 매우 중요하다는 것을 확인할 수 있었다. LMW-GS의 Glu-A3, Glu-B3유전자좌에서 대립 유전자형(A3a, A3f, B3g, B3b, B3c, B3g)에 의한 단백질 함량과 침전가 값의 차이는 통계적으로 유의하지 않았다. 고품질 자원을 선발하기 위해 단백질 함량은 16.0% 이상이면서 침전가 값이 60.0 mL 이상인 자원들을 그룹화 하여 총 14자원을 확인하였으며, 글루텐 조성을 분석한 결과 Glu-A1의 Ax2*를 지닌 자원은 5자원이었고, Glu-B1의 By8을 지닌 자원은 5자원, Glu-D1의 Dy10과 Dy12를 지닌 자원은 각각 8자원과 6자원으로 나타났다. 그 중 HI-LINE은 가장 높은 단백질 함량과 침전가 값을 보였으며 연차 간 단백질 함량과 침전가 값의 편차가 각각 0.35%와 1.98 mL로 연차 간 편차도 적어 단백질 품질이 우수한 자원으로 평가되었으며, 글루테닌 유전자 조성은 Ax2*, By8, Dy10이였다. 이러한 결과는 NIR 품질 분석과 글루테닌 유전자 판별 마커를 이용하여 글루테닌 단백질 질적 조성이 우수하면서 단백질 함량이 높은 밀 자원을 선발할 수 있고, 더 나아가 이상기후 등 다양한 환경변화에도 고품질이면서 안정성이 높은 밀 품종을 개발할 수 있을 것이다.
사 사
본 연구는 농촌진흥청 연구사업(과제명: 밀 유용형질 조기 집적 육종기술 개발, 과제번호: PJ014989032022)에 의해 이루어진 것임.
Fig. 1Distribution of 607 wheat genetic resources by country. S. Korea, South Korea; N. Korea, North Korea.
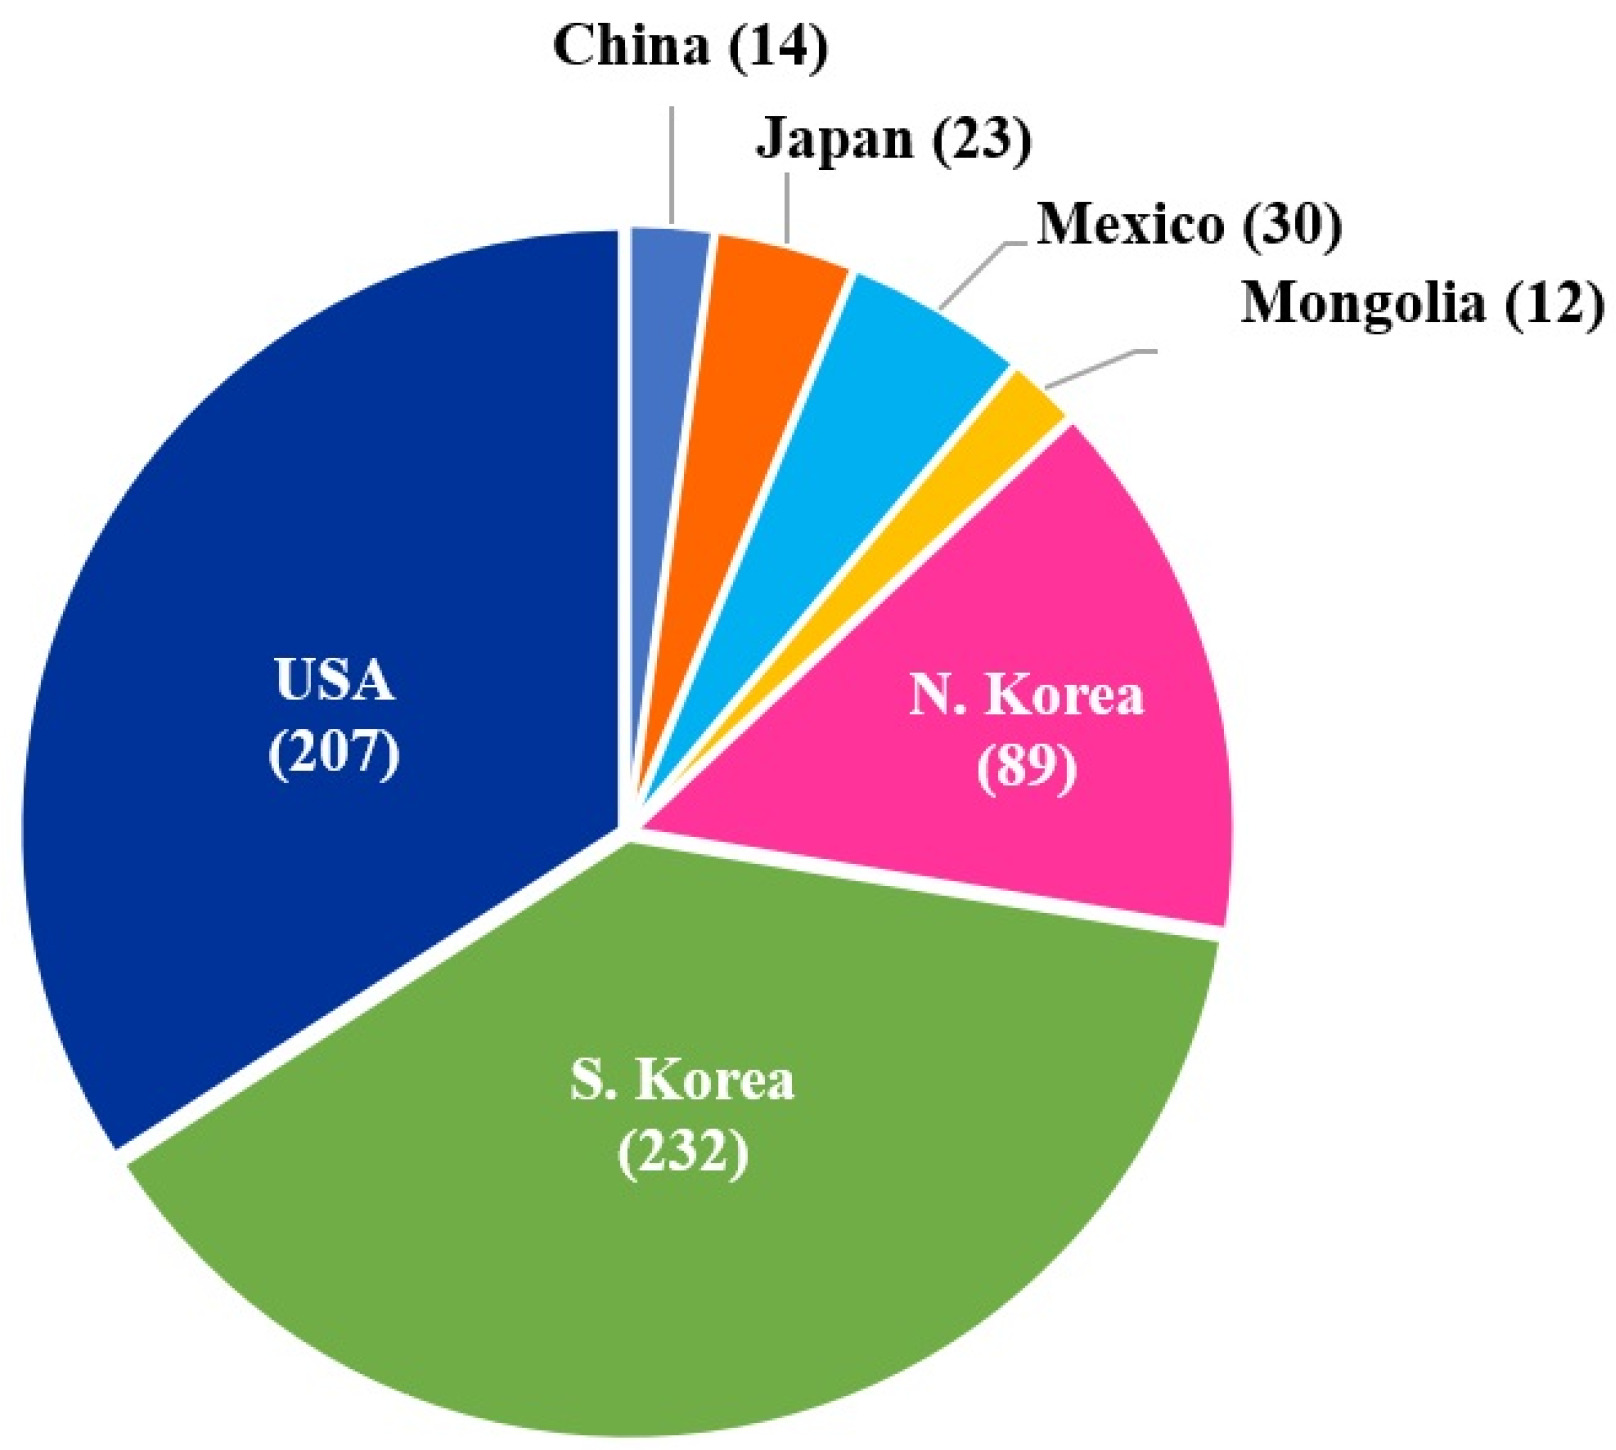
Fig. 2Frequency distribution of 607 wheat genetic resources for protein content (A) and SDS-sedimentation volume (B) for two years. The Y-axis represents the number of varieties and the X-axis represents the range of protein contents (%) or SDS-sedimentation volume (mL). SDSS, SDS-sedimentation volume.
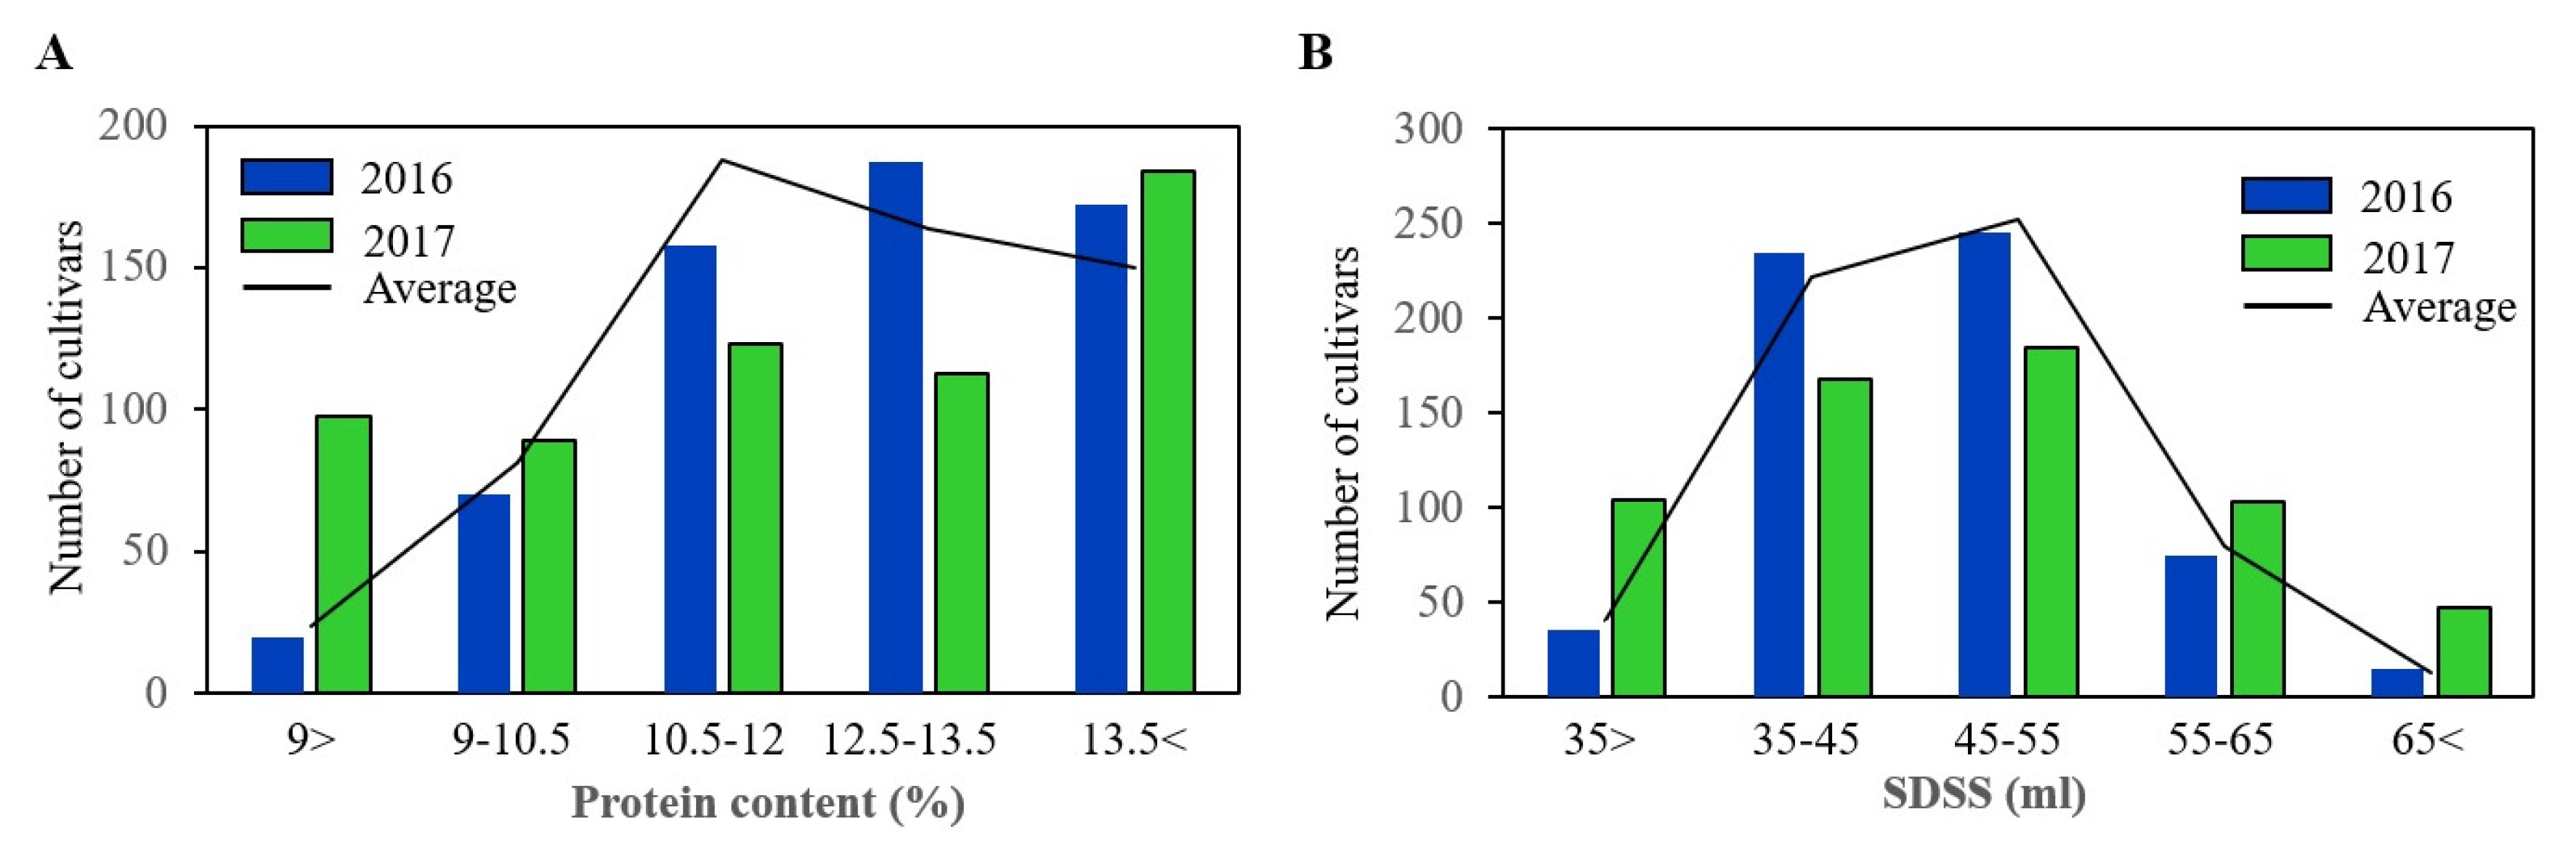
Fig. 3PCR products obtained by using the specific primer about glutenin subunits. A, Ax2* (1:Olgreu, 2: Alchan, 3: Gobun, 4: Namhae, 5: Keumkang, 6: Seodun, 7: Saeol, 8: Jinpum); B, Bx7OE (1: Inia 66, 2: Fillmore, 3: Arkan, 4: Mt 8195, 5: Chisholm, 6: Colt, 7: Monreo, 8: Ks85wgr01); C, By8 (1: Suwon 209, 2: Suwon 211, 3: Suwon 213, 4: Suwon 219, 5: Suwon 225, 6: Suwon 229, 7: Suwon 230, 8: Suwon 233); D, By9 (1: Iksan 315, 2: Iksan 316, 3: Iksan 317, 4: Iksan 318, 5: Iksan 319, 6: Iksan 320, 7: Iksan 321, 8: Iksan 322); E, Dy10 (1: Iksan 341, 2: Iksan 342, 3: Iksan 343, 4: Iksan 344, 5: Iksan 345, 6: Iksan 346, 7: Iksan 352, 8: Iksan 353); F, Dy12 (1: Iksan 341, 2: Iksan 342, 3: Iksan 343, 4: Iksan 344, 5: Iksan 345, 6: Iksan 346, 7: Iksan 352, 8: Iksan 353); G, A3a (1 Ten-yuk 12, 2: Yuk-soung 3, 3: Sanshiul San, 4: Hezuolmil 2, 5: HTRI 4973, 6: HTRI 2912, 7: HTRI 4979, 8: HTRI 4985); H, A3d (1: Sonora, 2: Tinamcu, 3: Peikinshiro, 4: Fontana, 5: Genaro 81, 6: Prina, 7: Kakatsi, 8: Milan); I, A3f (1: Buchanan, 2: Eltan, 3: Kmor, 4: Ajantha, 5: NE 82438, 6: NE 82533, 7: NE 84557, 8: Sws-52); J, B3b (1: Jeokpijeok, 2: Chukoku 81, 3: Jasun 1, 4: Hongso 25, 5: Shinjoongjang, 6: Suchon, 7: Sotaek, 8: Chinese spring); K, B3c (1: HTRI 15476, 2: HTRI 7094, 3: HTRI 9472, 4: Seuseon 8, 5: Seuyuk 1, 6: Seuyuk 28, 7: Seuyuk 44, 8: Seuyuk 109); L, B3g (1: Iksan 375, 2: Iksan 376, 3: Iksan 377, 4: Iksan 378, 5: Iksan 380, 6: Iksan 381, 7: Iksan 382, 8: Iksan 385).
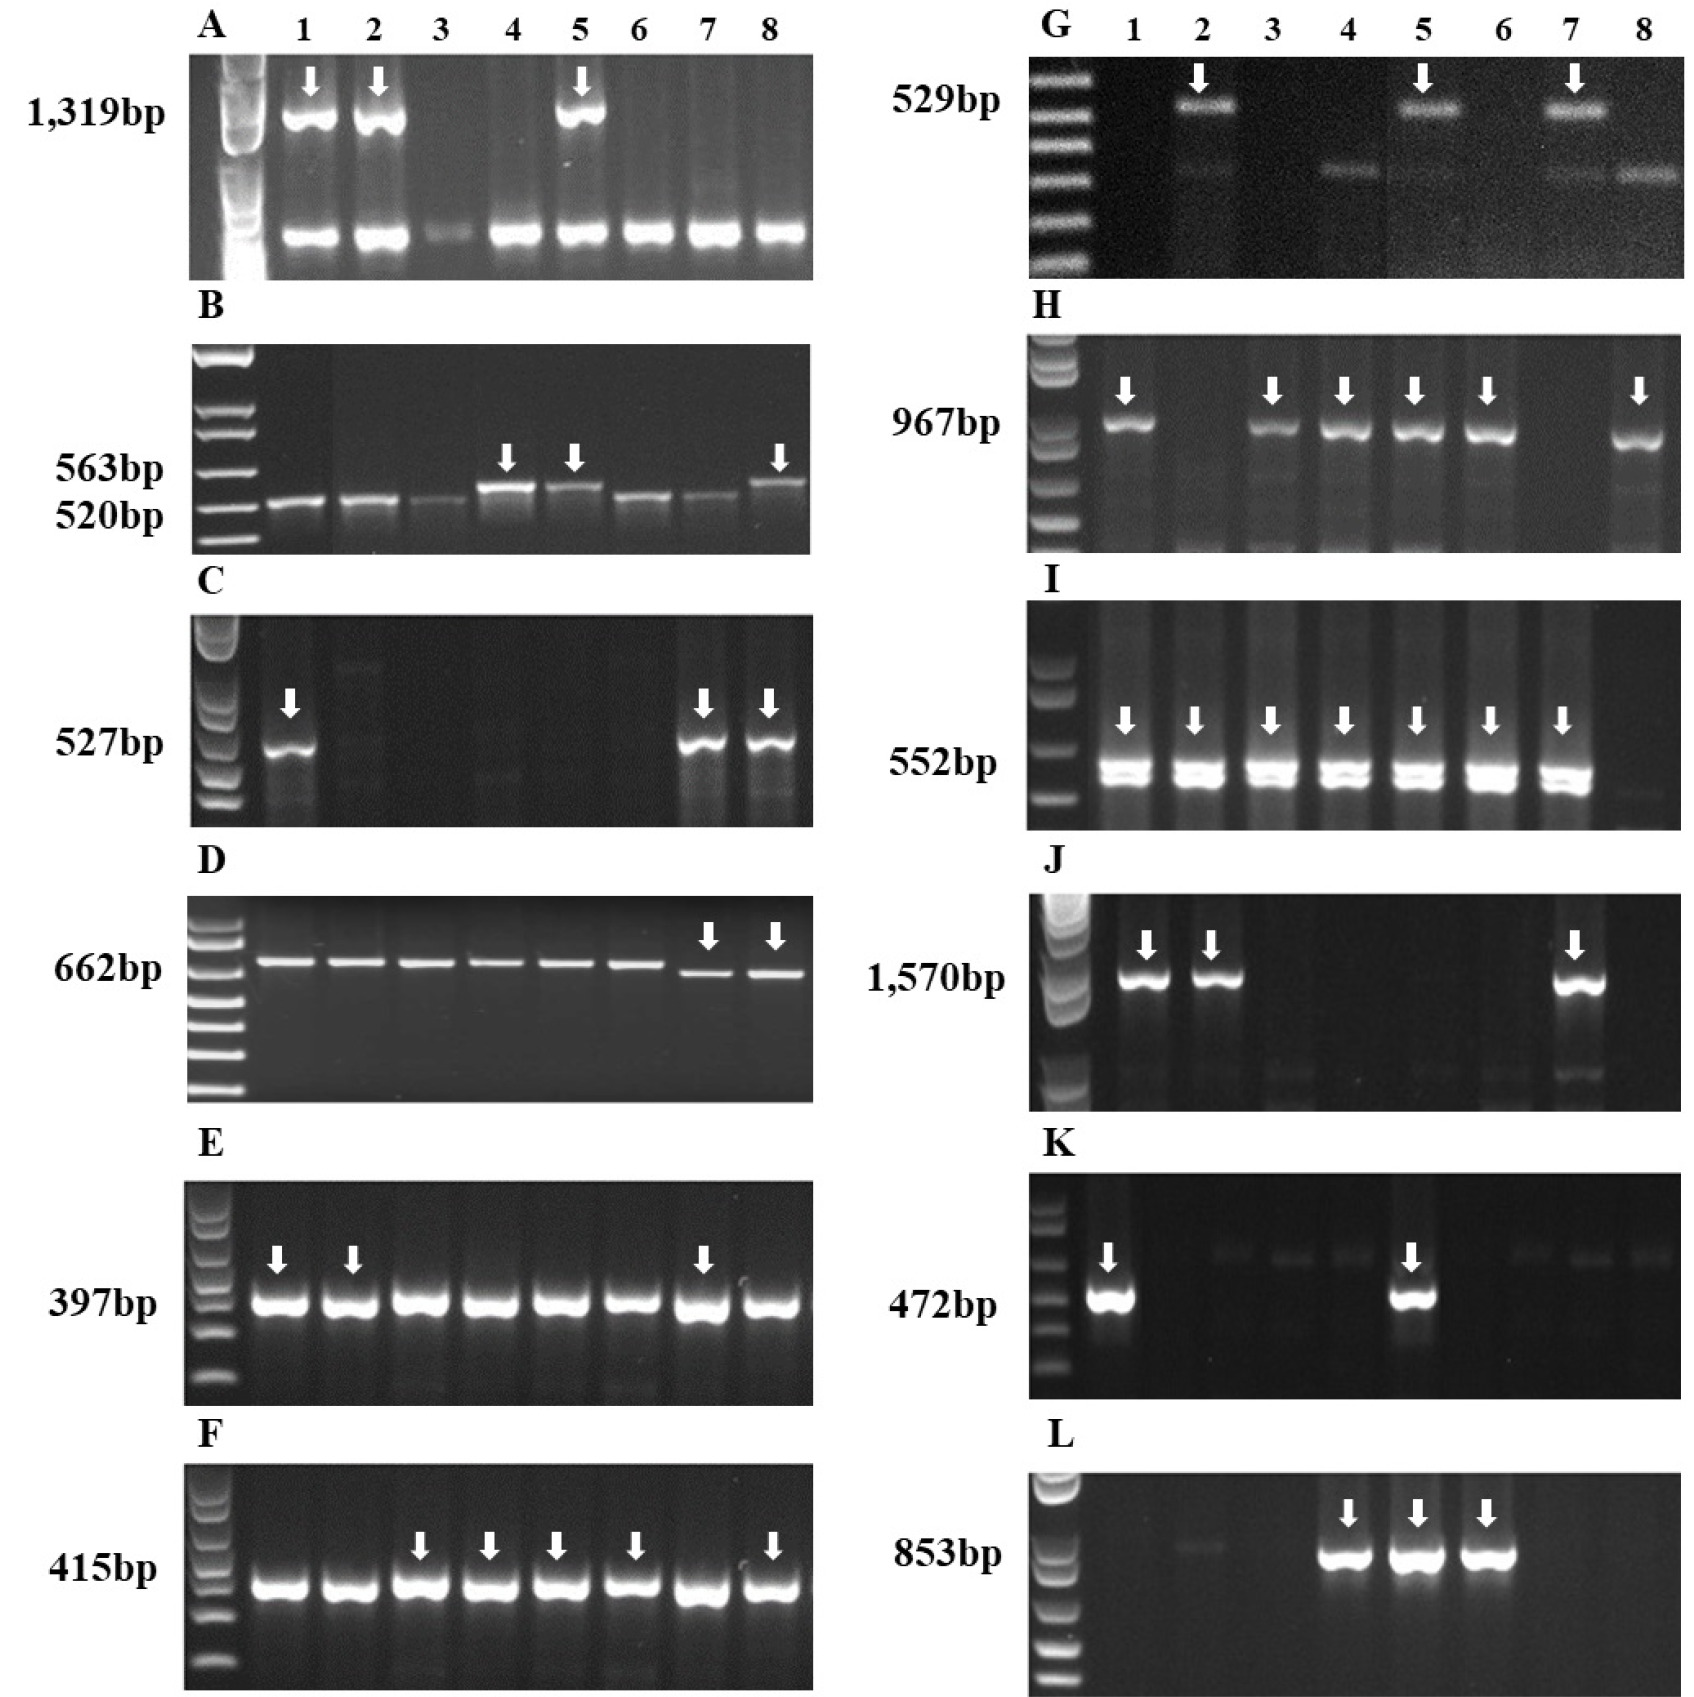
Fig. 4Distribution of protein content and SDS-Sedimentation volume average in 607 wheat genetic resources for two years.
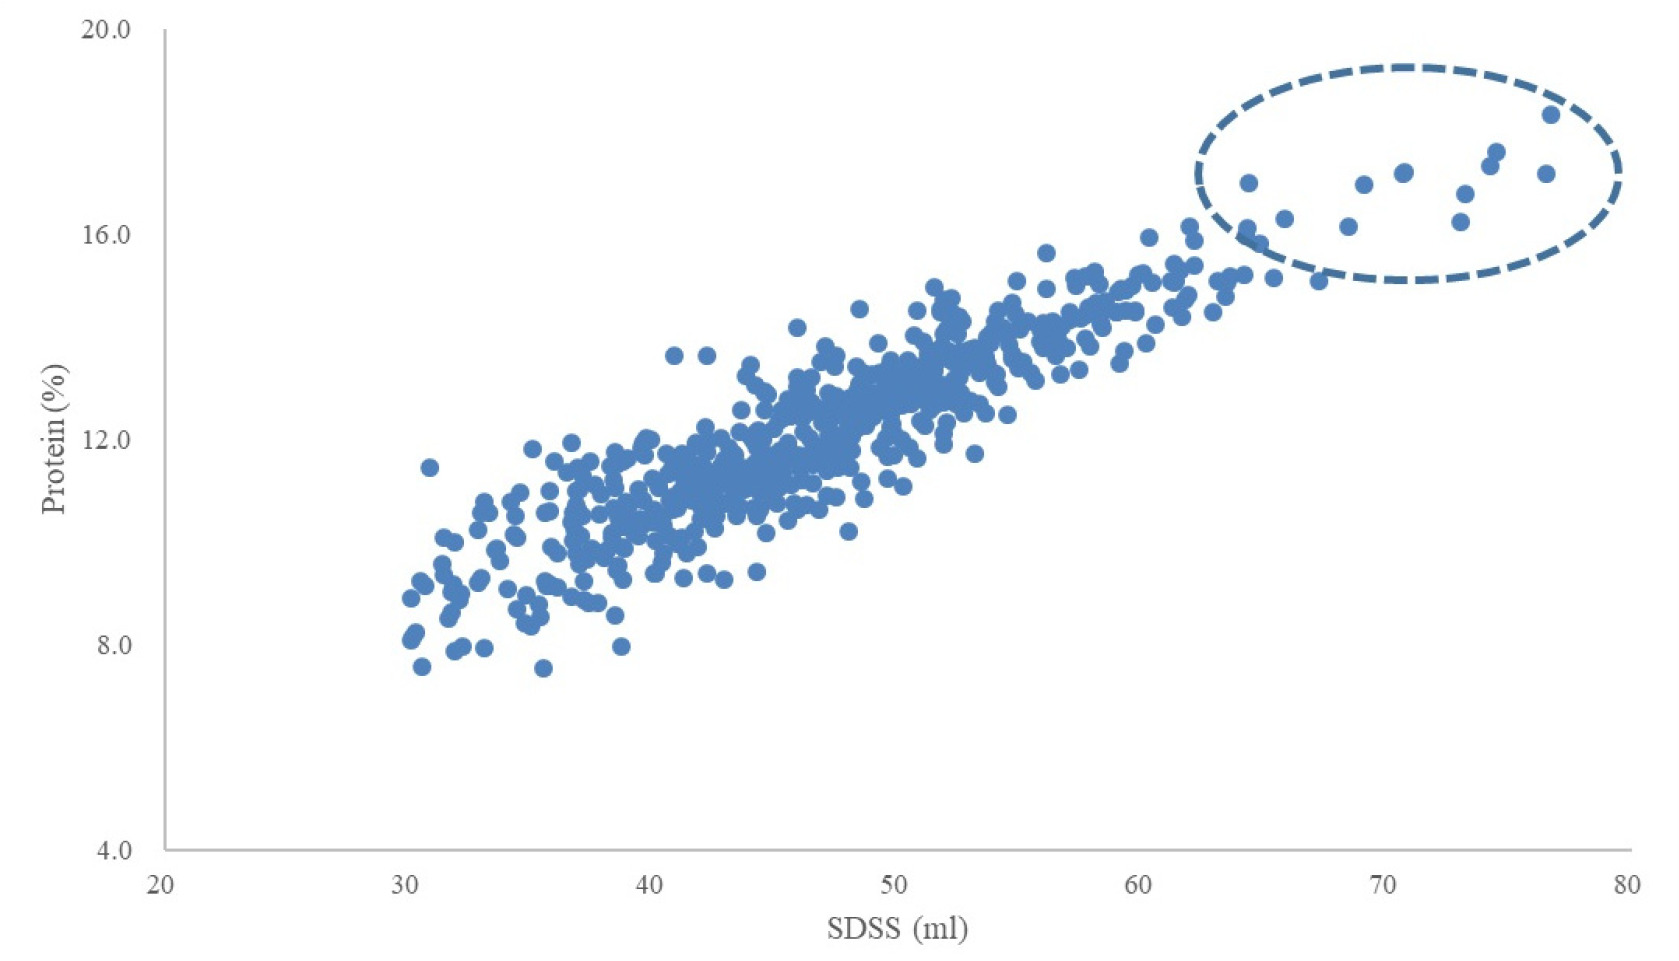
Table 1The information of functional markers to analyze for genetic polymorphism.
Table 1
|
No. |
Locus |
Gene |
Primer name |
Forward primer (5'-3') |
Reverse primer (5'-3') |
Reference |
|
1 |
GluA1
|
Ax2*
|
Ax2* |
ATGACTAAGCGGTTGGTTCTT |
ACCTTGCTCCCCTTGTCTTT |
Ma et al. 2003
|
|
2 |
GluB1
|
Bx7OE
|
MAR |
CCTCAGCATGCAAACATGCA |
CTGAAACCTTTGGCCAGTCA |
Butow et al. 2004
|
|
3 |
GluB1
|
By9
|
ZSBy8F5/R5 |
TTAGCGCTAAGTGCCGTCT |
TTGTCCTATTTGCTGCCCTT |
Lei et al. 2006
|
|
4 |
GluB1
|
By9
|
ZSBy9aF1/R3 |
TTCTCTGCATCAGTCAGGA |
AGAGAAGCTGTGTAATGCC |
Lei et al. 2006
|
|
5 |
GluD1
|
Dy10
|
UMN26 |
CGCAAGACAATATGAGCAAACT |
TTGCCTTTGTCCTGTGTGC |
Liu et al. 2008
|
|
6 |
GluD1
|
Dy12
|
UMN26 |
CGCAAGACAATATGAGCAAACT |
TTGCCTTTGTCCTGTGTGC |
Liu et al. 2008
|
|
7 |
GluA3
|
A3a
|
GluA3a |
AAACAGAATTATTAAAGCCGG |
GGTTGTTGTTGTTGCAGCA |
Wang et al. 2010
|
|
8 |
GluA3
|
A3d
|
GluA3d |
TTCAGATGCAGCCAAACAA |
TGGGGTTGGGAGACACATA |
Wang et al. 2010
|
|
9 |
GluA3
|
A3f
|
GluA3f |
AAACAGAATTATTAAAGCCGG |
GCTGCTGCTGCTGTGTAAA |
Wang et al. 2010
|
|
10 |
GluB3
|
B3b
|
GluB3b |
ATCAGGTGTAAAAGTGATAG |
TGCTACATCGACATATCCA |
Wang et al. 2009
|
|
11 |
GluB3
|
B3c
|
GluB3c |
CAAATGTTGCAGCAGAGA |
CATATCCATCGACTAAACAAA |
Wang et al. 2009
|
|
12 |
GluB3
|
B3g
|
GluB3g |
CCAAGAAATACTAGTTAACACTAGTC |
GTTGGGGTTGGGAAACA |
Wang et al. 2009
|
Table 2Protein content and SDS sedimentation volume by country of 607 wheat genetic resources over two years.
Table 2
|
Country |
Protein content (%) |
|
SDS-Sedimentation (mL) |
|
2016 |
|
2017 |
|
2016 |
|
2017 |
|
Mean |
SD |
|
Mean |
SD |
|
Mean |
SD |
|
Mean |
SD |
|
Total |
12.5 |
1.96 |
|
11.9 |
2.71 |
|
46.7 |
8.41 |
|
47 |
12.22 |
|
S. Korea |
12.2a
|
2.13 |
|
12.7a
|
2.46 |
|
47.48a
|
9.03 |
|
51.66a
|
11.42 |
|
N. Korea |
12.4a
|
1.76 |
|
11.8b
|
2.63 |
|
45.21b
|
7.13 |
|
46.02b
|
11.66 |
|
USA |
12.8b
|
1.86 |
|
10.9c
|
2.77 |
|
46.93ab
|
8.13 |
|
41.92c
|
11.67 |
|
Mexico |
12.8ab
|
1.87 |
|
12.3ab
|
2.35 |
|
45.39ab
|
8.02 |
|
46.87b
|
11.09 |
|
China |
12.3ab
|
1.38 |
|
12.3abc
|
1.72 |
|
47.05ab
|
8.45 |
|
48.27ab
|
8.24 |
|
Japan |
12.2ab
|
2.27 |
|
12.5ab
|
2.84 |
|
44.83ab
|
8.27 |
|
50.66ab
|
11.66 |
|
Mongolia |
13.1ab
|
0.74 |
|
11.9abc
|
2.47 |
|
49.01ab
|
4.48 |
|
48.16abc
|
10.94 |
Table 3Protein content of 607 wheat genetic resources over two years.
Table 3
|
cultivar |
2016 |
|
2017 |
Average
(2016-2017) |
SD
(2016-2017) |
|
Mean (%) |
SD (%) |
Mean (%) |
SD (%) |
|
HI-LINE |
18.1 |
0.36 |
|
18.6 |
1.69 |
18.3 |
0.35 |
|
Iksan 354 |
8.9 |
0.65 |
|
6.2 |
0.64 |
7.6 |
1.91 |
|
TAM 108 |
15.8 |
0.89 |
|
5.9 |
0.21 |
10.9 |
8.91 |
|
NE 84557 |
11.2 |
0.40 |
|
11.2 |
0.4 |
11.2 |
0.00 |
|
Iksan 374 |
13.3 |
1.09 |
|
13.3 |
0.50 |
13.3 |
0.00 |
|
Average |
12.5 |
1.96 |
|
11.9 |
2.71 |
12.2 |
1.86 |
Table 4SDS-sedimentation volume of 607 wheat genetic resources over two years.
Table 4
|
cultivar |
2016 |
|
2017 |
Average
(2016-2017) |
SD
(2016-2017) |
|
Mean (mL) |
SD (mL) |
Mean (mL) |
SD (mL) |
|
HI-LINE |
75.3 |
7.46 |
|
78.1 |
2.99 |
76.7 |
1.98 |
|
Kenya Heroe |
38.41 |
1.66 |
|
21.7 |
2.33 |
30.1 |
11.81 |
|
NE 84557 |
41.8 |
3.02 |
|
44.8 |
0.43 |
43.3 |
2.12 |
|
Namhae Collection04 |
34.0 |
2.10 |
|
68.5 |
0.83 |
51.3 |
24.4 |
|
Iksan 374 |
54.0 |
4.15 |
|
54.0 |
0.69 |
54.0 |
0.00 |
|
Average |
46.7 |
8.41 |
|
47.0 |
12.22 |
46.9 |
8.39 |
Table 5Glutenin marker ratio of 607 genetic resources.
Table 5
|
Country (resources) |
Glu-A1
|
|
Glu-B1
|
|
Glu-D1
|
|
Glu-A3
|
|
Glu-B3
|
|
Ax2*
|
|
Bx7OE
|
By8 |
By9 |
|
Dy10
|
Dy12
|
|
a
|
d
|
f
|
|
b
|
c
|
g
|
|
S. Korea (232) |
71 |
|
0 |
130 |
15 |
|
88 |
143 |
|
10 |
59 |
4 |
|
17 |
2 |
22 |
|
N. Korea (89) |
7 |
|
0 |
31 |
20 |
|
31 |
58 |
|
18 |
8 |
0 |
|
5 |
4 |
8 |
|
Japan (23) |
5 |
|
1 |
11 |
0 |
|
5 |
17 |
|
0 |
9 |
1 |
|
2 |
0 |
4 |
|
USA (207) |
108 |
|
6 |
57 |
5 |
|
102 |
101 |
|
6 |
11 |
21 |
|
54 |
0 |
44 |
|
Mexico (30) |
8 |
|
0 |
15 |
0 |
|
13 |
17 |
|
1 |
10 |
3 |
|
3 |
0 |
3 |
|
China (14) |
5 |
|
0 |
10 |
0 |
|
9 |
5 |
|
4 |
0 |
0 |
|
0 |
0 |
1 |
|
Mongolia (12) |
4 |
|
0 |
0 |
3 |
|
7 |
4 |
|
0 |
2 |
4 |
|
0 |
0 |
4 |
|
(607) |
208 |
|
7 |
254 |
43 |
|
255 |
345 |
|
39 |
99 |
33 |
|
81 |
6 |
86 |
Table 6Differences in protein and SDS-sedimentation depending on the polymorphisms of HMW-GS functional markers.
Table 6
|
Gene |
Primer name |
Polymorphism |
Protein (%) |
|
SDS-Sedimentation (mL) |
Number of lines |
|
Mean |
SD |
Mean |
SD |
|
Ax2* |
Ax2* |
a |
12.3 |
1.89 |
|
46.9 |
8.70 |
209 |
|
b |
12.1 |
1.85 |
|
46.9 |
8.24 |
398 |
|
Bx7OE
|
MAR |
a |
12.0 |
2.32 |
|
45.5 |
7.59 |
7 |
|
b |
12.2 |
1.86 |
|
47.0 |
8.41 |
600 |
|
By8
|
ZSBy8F5/R5 |
a |
12.3 |
1.77 |
|
47.9 |
7.92 |
254 |
|
b |
12.1 |
1.93 |
|
46.3 |
8.67 |
353 |
|
By9
|
ZSBy9aF1/R3 |
a |
12.3 |
2.13 |
|
48.2 |
9.61 |
47 |
|
b |
12.2 |
1.84 |
|
46.8 |
8.28 |
560 |
|
Dy10
|
UMN26 |
a |
12.5 |
1.90 |
|
48.2 |
8.86 |
255 |
|
b |
12.0 |
1.82 |
|
46.0 |
7.93 |
352 |
|
Dy12
|
UMN26 |
a |
12.0 |
1.83 |
|
46.0 |
8.00 |
345 |
|
b |
12.5 |
1.87 |
|
48.2 |
8.75 |
262 |
Table 7Correlation coefficients between the protein quality and molecular markers of wheat resources.
Table 7
|
Ax2*
|
Bx7OE
|
By8
|
By9 |
Dy10
|
Dy12
|
A3a
|
A3d
|
A3f
|
B3b
|
B3c
|
B3g
|
Protein (%) |
SDSS (mL) |
|
Ax2*
|
1.00 |
|
|
|
|
|
|
|
|
|
|
|
|
|
|
Bx7OE
|
0.05 |
1.00 |
|
|
|
|
|
|
|
|
|
|
|
|
|
By8
|
0.03 |
-0.09 |
1.00 |
|
|
|
|
|
|
|
|
|
|
|
|
By9 |
0.01 |
-0.01 |
-0.08 |
1.00 |
|
|
|
|
|
|
|
|
|
|
|
Dy10
|
0.18 |
0.03 |
0.05 |
0.00 |
1.00 |
|
|
|
|
|
|
|
|
|
|
Dy12
|
-0.18 |
-0.03 |
-0.03 |
0.01 |
-0.98*
|
1.00 |
|
|
|
|
|
|
|
|
|
A3a
|
-0.07 |
-0.03 |
0.00 |
-0.02 |
-0.10 |
0.11 |
1.00 |
|
|
|
|
|
|
|
|
A3d
|
-0.09 |
0.04 |
0.13 |
0.01 |
-0.01 |
0.02 |
-0.12 |
1.00 |
|
|
|
|
|
|
|
A3f
|
0.01 |
-0.03 |
-0.08 |
0.14 |
-0.07 |
0.06 |
-0.06 |
-0.11 |
1.00 |
|
|
|
|
|
|
B3b
|
0.04 |
0.00 |
0.07 |
-0.04 |
0.07 |
-0.06 |
-0.07 |
-0.09 |
0.12 |
1.00 |
|
|
|
|
|
B3c
|
-0.07 |
-0.01 |
-0.05 |
-0.01 |
-0.09 |
0.09 |
-0.03 |
0.09 |
-0.02 |
-0.04 |
1.00 |
|
|
|
|
B3g
|
-0.02 |
0.13 |
-0.13 |
0.02 |
0.06 |
-0.05 |
0.01 |
-0.09 |
-0.01 |
-0.16 |
-0.04 |
1.00 |
|
|
|
Protein (%) |
0.03 |
-0.02 |
0.03 |
-0.02 |
0.13 |
-0.14 |
-0.07 |
-0.04 |
-0.07 |
-0.01 |
0.00 |
-0.09 |
1.00 |
|
|
SDSS (mL) |
0.00 |
-0.03 |
0.09 |
-0.02 |
0.12 |
-0.13 |
-0.06 |
0.01 |
-0.07 |
-0.01 |
-0.02 |
-0.11 |
0.91*
|
1.00 |
Table 8Differences in protein content and SDS-sedimentation depending on the polymorphisms of LMW-GS functional markers.
Table 8
|
Gene |
Primer name |
Polymorphism |
Protein (%) |
|
SDS-Sedimentation (mL) |
Number of lines |
|
Mean |
SD |
Mean |
SD |
|
A3a
|
GluA3a |
a |
11.7 |
1.81 |
|
45.2 |
6.96 |
40 |
|
b |
12.2 |
1.87 |
|
47.1 |
8.48 |
567 |
|
A3d
|
GluA3d |
a |
12.0 |
1.84 |
|
47.2 |
8.14 |
99 |
|
b |
12.2 |
1.87 |
|
46.9 |
8.45 |
508 |
|
A3f
|
GluA3f |
a |
11.6 |
2.02 |
|
44.4 |
8.64 |
33 |
|
b |
12.2 |
1.85 |
|
47.1 |
8.36 |
574 |
|
B3b
|
GluB3b |
a |
12.2 |
1.98 |
|
46.7 |
8.09 |
81 |
|
b |
12.2 |
1.85 |
|
47.0 |
8.45 |
526 |
|
B3c
|
GluB3c |
a |
12.1 |
2.05 |
|
45.1 |
11.18 |
6 |
|
b |
12.2 |
1.87 |
|
46.9 |
8.37 |
601 |
|
B3g
|
GluB3g |
a |
11.8 |
1.86 |
|
44.8 |
8.35 |
86 |
|
b |
12.3 |
1.86 |
|
47.3 |
8.36 |
521 |
Table 9Allelic combinations at three HMW-GS loci associated with protein and SDS-sedimentation properties among 607 wheat germplasm over two years.
Table 9
|
No. |
Allelic combination |
|
Protein (%) |
|
SDS-Sedimentation (mL) |
Number of lines |
|
Glu-A1
|
Glu-B1
|
Glu-D1
|
Mean |
SD |
Mean |
SD |
|
AC 1 |
Ax2* |
Bx7OE
|
Dy10
|
|
13.8 |
0.54 |
|
52.5 |
2.54 |
2 |
|
AC 2 |
Ax2*
|
Bx7OE
|
Dy12
|
|
10.6 |
2.05 |
|
41.9 |
8.77 |
2 |
|
AC 3 |
Ax2*
|
By8
|
Dy10
|
|
13.0 |
1.77 |
|
50.5 |
8.47 |
60 |
|
AC 4 |
Ax2*
|
By8
|
Dy12
|
|
12.2 |
1.87 |
|
48.2 |
8.38 |
32 |
|
AC 5 |
Ax2*
|
By9
|
Dy10
|
|
13.3 |
1.02 |
|
49.8 |
5.09 |
3 |
|
AC 6 |
Ax2*
|
By9 |
Dy12
|
|
11.1 |
1.44 |
|
44.2 |
5.43 |
3 |
Table 10Allelic combinations at two LMW-GS loci associated with protein and SDS-sedimentation properties among 607 wheat germplasm over two years.
Table 10
|
No. |
Allelic combination |
|
Protein (%) |
|
SDS-Sedimentation (mL) |
Number of lines |
|
Glu-A3
|
Glu-B3
|
Mean |
SD |
Mean |
SD |
|
AC 1 |
a
|
b
|
|
13.0 |
2.22 |
|
44.8 |
5.12 |
2 |
|
AC 2 |
a
|
g
|
|
11.4 |
3.36 |
|
47.4 |
14.08 |
6 |
|
AC 3 |
d
|
b
|
|
13.3 |
3.18 |
|
51.4 |
12.29 |
6 |
|
AC 4 |
d
|
c
|
|
11.2 |
0.87 |
|
39.6 |
6.81 |
3 |
|
AC 5 |
d
|
g
|
|
13.8 |
1.27 |
|
53.3 |
5.78 |
7 |
|
AC 6 |
f
|
b
|
|
10.6 |
0.82 |
|
42.5 |
2.19 |
10 |
|
AC 7 |
f
|
g
|
|
11.5 |
1.57 |
|
39.6 |
6.24 |
4 |
References
- 1. Abrams SM, Shenk JS, Westerhaus MO, Barton II FE. 1987. Determination of forage quality by near infrared reflectance spectroscopy: efficacy of broad-based calibration equations. J Dairy Sci 70: 806-813.
- 2. Addo K, Pomeranz Y, Huang ML, Rubenthaler GL, Jeffers HC. 1991. Steamed bread. II. Role of protein content and strength. Cereal Chem 68: 39-42.
- 3. Anjum FM, Lookhart GL, Walker CE. 2000. Electrophoretic identification of hard white spring wheats grown at different locations in Pakistan in different years. J Sci Food Agric 80: 1155-1161.
- 4. Anjum FM, Khan MR, Din A, Saeed M, Pasha I, Arshad MU. 2007. Wheat gluten: high molecular weight glutenin subunits - structure, genetics, and relation to dough elasticity. J Food Sci 72: R56-R63.
- 5. Axford DWE, McDermott EE, Redman DG. 1978. Small scale tests of bread making quality. Milling Feed Fert 13: 18-20.
- 6. Bietz JA, Wall JS. 1973. Isolation and characterization of gliadin-like subunits from glutenin. Cereal Chemistry 50: 537-547.
- 7. Bietz JA, Shepherd KW, Wall JS. 1975. Single-kernel analysis of glutenin: use in wheat genetics and breeding. Cereal Chem 52: 513-532.
- 8. Brönneke V, Zimmermann G, Killermann B. 2000. Effect of high molecular weight glutenins and D-zone gliadins on bread-making quality in German wheat varieties. Cereal Res Commun 28: 187-194.
- 9. Butow BJ, Gale K, Ikea J, Juhasz A, Bedo¨ Z, Tamas L, Gianibelli M. 2004. Dissemination of the highly expressed Bx7 glutenin subunit (Glu-B1al allele) in wheat as revealed by novel PCR markers and RP-HPLC. Theor Appl Genet 109: 1525-1535.
- 10. Caballero L, Martin LM, Alvarez JB. 2008. Relationships between the HMW-and LMW-glutenin subunits and SDS-sedimentation volume in Spanish hulled wheat lines. Czech J Genet Plant Breed 44: 114-117.
- 11. Chaudhary N, Dangi P, Khatkar BS. 2016. Relationship of molecular weight distribution profile of unreduced gluten protein extracts with quality characteristics of bread. Food Chem 210: 325-331.
- 12. Chen H, Li S, Liu Y, Liu J, Ma X, Du L, Wang K, Ye X. 2021. Effects of 1Dy12 subunit silencing on seed storage protein accumulation and flour-processing quality in a common wheat somatic variation line. Food Chem 335: 127663.
- 13. Clarke FR, Clarke JM, Ames NA, Knox RE, Ross RJ. 2010. Gluten index compared with SDS-sedimentation volume for early generation selection for gluten strength in durum wheat. Can J Plant Sci 90: 1-11.
- 14. Clarke MA, Arias ER, McDonald-Lewis C. 1992. Near infrared analysis in the sugarcane factory. Ruspam Commun. Inc.,
- 15. Cubadda RE, Carcea M, Marconi E, Trivisonno MC. 2007. Influence of protein content on durum wheat gluten strength determined by the SDS sedimentation test and by other methods. Cereal Food World 52: 273-277.
- 16. Deng Z, Tian J, Chen F, Li W, Zheng F, Chen J, Shi C, Sun C, Wang S, Zhang Y. 2015. Genetic dissection on wheat flour quality traits in two related populations. Euphytica 203: 221-235.
- 17. Eagles HA, Hollamby GJ, Gororo NN, Eastwood RF. 2002. Estimation and utilization of glutenin gene effects from the analysis of unbalanced data from wheat breeding programs. Aust J Agric Res 53: 367-377.
- 18. Espí A, Giraldo P, Rodriguez‐Quijano M, Carrillo JM. 2012. A PCR‐based method for discriminating between high molecular weight glutenin subunits Bx7 and Bx7* in Triticum aestivum L. Plant Breed 131: 571-573.
- 19. Frank K, Miró K, Nagy T, Marincs F. 2017. Development of a PCR-based DNA marker for Glu-1By alleles in the old Hungarian Bánkúti wheat. Mol Breed 37: 1-5.
- 20. Geng Y, Pang B, Hao C, Tang S, Zhang X, Li T. 2014. Expression of wheat high molecular weight glutenin subunit 1Bx is affected by large insertions and deletions located in the upstream flanking sequences. PloS One 9: e105363.
- 21. Gianibelli MC, Gupta RB, Lafiandra D, Margiotta B, MacRitchie F. 2001. Polymorphism of high Mrglutenin subunits in Triticum tauschii: characterisation by chromatography and electrophoretic methods. J Cereal Sci 33: 39-52.
- 22. Guo Y, Zhang G, Guo B, Qu C, Zhang M, Kong F, Zhao Y, Li S. 2020. QTL mapping for quality traits using a highdensity genetic map of wheat. PLoS One 15: e0230601.
- 23. Gupta RB, Shepherd K W. 1990. Two-step one-dimensional SDS-PAGE analysis of LMW subunits of glutelin. Theor Appl Genet 80: 65-74.
- 24. Gupta RB, Makes F, Wrigley CK. 1991. Prediction of physical dough properties from glutenin subunit composition in bread wheats: correlation studies. Cereal Chem 68: 328-333.
- 25. Gupta RB, MacRitchie F. 1994a. Allelic variation at glutenin subunit and gliadin loci, Glu-1, Glu-3 and Gli-1 of common wheats. II. Biochemical basis of the allelic effects on dough properties. J Cereal Sci 19: 19-29.
- 26. Gupta RB, Paul JG, Cornish GB, Palmer GA, Bekes F, Rathjen AJ. 1994b. Allelic variation at glutenin subunit and gliadin loci, Glu-1, Glu-3 and Gli-1 of common wheats. I. Its additive and interaction effects on dough properties. J Cereal Sci 19: 9-17.
- 27. He ZH, Yang J, Zhang Y, Quail KJ, Pena RJ. 2004. Pan bread and dry white Chinese noodle quality in Chinese winter wheats. Euphytica 139: 257-267.
- 28. He ZH, Liu L, Xia XC, Liu JJ Pena RJ. 2005. Composition of HMW and LMW glutenin subunits and their effects on dough properties, pan bread, and noodle quality of Chinese bread wheats. Cereal Chem 82: 345-350.
- 29. Horvat D, Drezner G, Jurković Z, Šimić G, Magdić D, Dvojković K. 2006. The importance of high-molecular-weight glutenin subunits for wheat quality evaluation. Poljoprivreda 12: 53-57.
- 30. Ito M, Funatsuki WM, Ikeda TM, Nishio Z, Nagasawa K, Tabiki T, Yamauchi H. 2011. Effect of allecic variation in three glutenin loci on dough properties and bread-making qualities of winter wheat. Breed Sci 61: 281-287.
- 31. Jiang P, Xue J, Duan L, Gu Y, Mu J, Han S, Chen L, Li Y, Ma W, Yan Y, Li X. 2019. Effects of high‐molecular‐weight glutenin subunit combination in common wheat on the quality of crumb structure. J Sci Food Agric 99: 1501-1508.
- 32. Jin H, Zhang Y, Li G, Mu P, Fan Z, Xia X, He Z. 2013. Effects of allelic variation of HMW-GS and LMW-GS on mixograph properties and Chinese noodle and steamed bread qualities in a set of Aroona near-isogenic wheat lines. J Creal Sci 57: 146-152.
- 33. Johansson E, Henriksson P, Svensson G, Heneen WK. 1993. Detection, chromosomal location and evaluation of the functional value of a novel high Mr glutenin subunit found in Swedish wheats. J Creal Sci 17: 237-245.
- 34. Kang CS, Park CS, Park JC, Kim HS, Cheong YK, Kim KH, Kim KJ, Park KH, Kim JG. 2010. Flour characteristics and end-use quality of Korean wheat cultivars II. End-use properties. Korean J Breed Sci 42: 75-86.
- 35. Kim JS, Song MH, Choi JE, Lee HB, Ahn SN. 2008. Quantification of protein and amylose contents by near-infrared reflectance spectroscopy in aroma rice. Korean J Food Sci Technol 40: 603-610.
- 36. Kim JS, Cho YH, Gwag JG, Ma KH, Choi YM, Kim JB, Lee JH, Kim TS, Cho JK, Lee SY. 2008b. Quantitative analysis of amylose and protein content of rice germplasm in RDA gene bank by near-infrared reflectance spectroscopy. Korean J Crop Sci 53: 217-223.
- 37. Kim K, Kang C, Choi I, Kim H, Hyun J, Park C. 2016. Analysis of grain characteristics in Korean wheat and screening wheat for quality using near infrared reflectancepectroscopy. Korean J Breed Sci 48: 442-449.
- 38. Kweon M, Slade L, Levine H. 2011. Solvent retention capacity (SRC) testing of wheat flour: principles and value in predicting flour functionality in different wheat-based food processes and in wheat breeding-A review. Cereal Chem 88: 537-552.
- 39. Lei ZS, Gale KR, He ZH, Gianibelli C, Larroque O, Xia XC, Ma W. 2006. Y-type gene specific markers for enhanced discrimination of high-molecular weight glutenin alleles at the Glu-B1 locus in hexaploid wheat. J Creal Sci 43: 94-101.
- 40. Liang X, Zhen S, Han C, Wang C, Li X, Ma W, Yan Y. 2015. Molecular characterization and marker development for hexaploid wheat-specific HMW glutenin subunit 1By18 gene. Molecular Breeding 35: 1-16.
- 41. Liu S, Chao S, Anderson JA. 2008. New DNA markers for high molecular weight glutenin subunits in wheat. Theor Appl Genet 118: 177-183.
- 42. Luo C, Griffin WB, Branlard G, McNeil DL. 2001. Comparison of low-and high molecular-weight wheat glutenin allele effects on flour quality. Theor Appl Genet 102: 1088-1098.
- 43. Ma W, Zhang W, Gale KR. 2003. Multiplex-PCR typing of high molecular weight glutenin alleles in wheat. Euphytica 134: 51-60.
- 44. MacRitchie F. 1987. Evaluation of contributions from wheat protein fractions to dough mixing and breadmaking. J Cereal Sci 6: 259-268.
- 45. MacRitchie F. 1992. Physicochemical properties of wheat proteins in relation to functionality. Adv. Food Nutr Res 36: 1-87.
- 46. Maruyama-Funatsuki W, Takata K, Nishio Z, Tabiki T, Yahata E, Kato A, Saito K, Funatsuki H, Saruyama H, Yamauchi H. 2004. Identification of low-molecular weight glutenin subunits of wheat associated with bread-making quality. Plant Breed 123: 355-360.
- 47. Margiotta B, Urbano M, Colaprico G, Johansson E, Buonocore F, D'Ovidio R, Lafiandra D. 1996. Detection of y-type subunit at the Glu-A1 locus in some Swedish bread wheat lines. J Cereal Sci 23: 203-212.
- 48. Maucher T, Figueroa JDC, Reule W, Pena RJ. 2009. Influence of low molecular weight glutenins on viscoelastic properties of intact wheat kernels and their relation to functional properties of Wheat Dough. Cereal Chem 86: 372-375.
- 49. Morris CF, Paszczynska B, Bettge AD, King GE. 2007. A critical examination of the sodium dodecyl sulfate (SDS) sedimentation test for wheat meals. J Sci Food Agric 87: 607-615.
- 50. Ng PW, Bushuk W. 1987. Glutenin of Marquis wheat as a reference for estimating molecular weights of glutenin subunits by sodium dodecyl sulfate-polyacrylamide gel electrophoresis. Cereal Chem 64: 324-327.
- 51. Oelofse RM, Labuschagne MT, Van Deventer CS. 2010. Influencing factors of sodium dodecyl sulfate sedimentation in bread wheat. J Cereal Sci 52: 96-99.
- 52. Payne PI, Corfield KG. 1979. Subunit composition of wheat glutenin proteins, isolated by gel filtration in dissociating medium. Planta 145: 83-88.
- 53. Payne PI, Law CN, Mudd EE. 1980. Control by homoeologous group 1 chromosomes of the high-molecular-weight subunits of glutenin, a major protein of wheat endosperm. Theor Appl Genet 58: 113-120.
- 54. Payne PI, Lawrence GJ. 1983. Catalogue of alleles for the complex gene loci, Glu-A1, Glu-B1, and Glu-D1 which code for high-molecular-weight subunits of glutenin in hexaploid wheat. Cereal Res Commun 11: 29-35.
- 55. Payne PI, Holt LM, Jackson EA, Law CN, Damania AB. 1984. Wheat storage proteins: their genetics, and their potential for manipulation by plant breeding. Philos. Trans R Soc Lond B Biol Sci 304: 359-371.
- 56. Payne PI, Nightingale MA, Krattiger AF, Holt LM. 1987. The relationship between HMW glutenin subunit composition and the bread-making quality of British-grown wheat varieties. J Sci Food Agric 40: 51-65.
- 57. Peña-Bautista RJ. In: Curtis BC, Rajaram S, Macpherson HG. 2002. "Wheat for bread and other foods," in bread wheat: improvement and production. (Eds). Macpherson. FAO Plant Production and Protection Series, Rome.
- 58. Ragupathy R, Naeem HA, Reimer E, Lukow OM, Sapirstein HD, Cloutier S. 2008. Evolutionary origin of the segmental duplication encompassing the wheat GLU-B1 locus encoding the overexpressed Bx7 (Bx7OE) high molecular weight glutenin subunit. Theor Appl Genet 116: 283-296.
- 59. RDA (Rural Development Administration).2012. Agricultural science and technology of analysis based on research(Ⅰ). pp. 315-374.
- 60. Reif JC, Gowda M, Maurer HP, Longin CFH, Korzun V, Ebmeyer E, Pietsch C, Wurschum T. 2011. Association mapping for quality traits in soft winter wheat. Theor Appl Genet 122: 961-970.
- 61. Rubenthaler GL, Huang ML, Pomeranz Y. 1990. Steamed bread. I. Chinese steamed bread formulation and interactions. Cereal Chem 67: 471-475.
- 62. Shewry PR, Halford NG, Lafiandra D. 2003. Genetics of wheat gluten proteins. Adv Genet 49: 111-184.
- 63. Si H, Zhao M, He F, Ma C. 2013. Effect of Glu-B3 allelic variation on sodium dodecyl sulfate sedimentation volume in common wheat (Triticum aestivum L.). Sci World J article ID 848549.
- 64. Slade L, Levine H. 1994. Structure-function relationships of cookie and cracker ingredients. Sci Cookie Cracker Prod 9: 23-141.
- 65. Sohn J, Choi C, Chun J, Kim K, Kim K, Kim Y, Park J, Yang J, Kim C, Kang C. 2020. Evaluation of functional markers related to agronomic traits for selecting efficient marker sets in wheat. Int J Agric Biol 23: 340-348.
- 66. Wang LH, Zhao XL, He ZH, Ma W, Appels R, Pena RJ, Xia XC. 2009. Characterization of low-molecular-weight glutenin subunit Glu-B3 genes and development of STS markers in common wheat (Triticum aestivum L.). Theor Appl Genet 118: 525-539.
- 67. Wang L, Li G, Pena RJ, Xia X, He Z. 2010. Development of STS markers and establishment of multiplex PCR for Glu-A3 alleles in common wheat (Triticum aestivum L.). J Cereal Sci 51: 305-312.
- 68. Weegels P, Hamer RJ, Schofield JD. 1996. Functional properties of wheat glutenin. J Cereal Sci 23: 1-18.
- 69. Williams P, Norris K. 1987. Near-infrared technology in agricultural and food industries. American Association of Cereal Chemists, Inc., MN (USA): pp. 330-
- 70. Xu Q, Xu J, Liu CL, Chang C, Wang CP, You MS, Li BT, Liu GT. 2008. PCR-based markers for identification of HMW-GS at Glu-B1x loci in common wheat. J Cereal Sci 47: 394-398.
- 71. Zhang X, Jin H, Zhang Y, Liu D, Li G, Xia X, Zhang A. 2012. Composition and functional analysis of low-molecular-weight glutenin alleles with Aroona near-isogenic lines of bread wheat. BMC Plant Biol 12: 243
- 72. Zhao XL, Ma W, Gale KR, Lei ZS, He ZH, Sun QX, Xia XC. 2007a. Identification of SNPs and development of functional markers for LMW-GS genes at Glu-D3 and Glu-B3 loci in bread wheat (Triticum aestivum L.). Mol Breed 20: 223-231.
- 73. Zhao XL, Xia XC, He ZH, Lei ZS, Appels R, Yang Y, Sun Q, Ma W. 2007b. Novel DNA variations to characterize low molecular weight glutenin Glu-D3 genes and develop STS markers in common wheat. Theor Appl Genet 114: 451-460.