적요
Sybeans have been grown by plant breeding for decades. As soybeans have very limited genetic variation, it is difficult for soybean breeders to find new genetic resources for abiotic stressors. Recently, soybeans have been exposed to flooding stress from intensive summer rainfall owing to climate change. Glycine soja, a wild soybean, is known to have greater genetic variation and greater resistance to a variety of biotic and abiotic stresses than ordinary soybeans. In this study, high-throughput transcriptome analysis was performed using flood-treated Glycine soja. Differentially expressed genes (DEGs) were analyzed using reads mapped to reference sequences, and gene ontology (GO) and Kyoto Encyclopedia of Genes and Genomes (KEGG) analyses were performed using selected DEGs. In addition, RT-qPCR analysis was performed to further analyze the expression of specific candidate genes. Several novel genes that could explain various mechanisms related to water stress were identified as related transcripts and adaptation mechanisms through cell wall expansion, alcoholic fermentation under anaerobic conditions, and structural changes. In addition, most of the isoflavonoid daidzein pathway genes exhibited upregulated expression under flooding stress. Interestingly, expression of the DIR (dirigent protein 1-like) gene, which is known to decrease in response to flooding stress in soybeans (Glycine max), was upregulated in Glycine soja. The expression of DIR revealed that DIR may play a key role in conferring flooding stress resistance in Glycine soja. This study provides useful information regarding the genes and comprehensive adaptation mechanisms related to flooding stress tolerance that can be utilized for cultivated soybeans through the Korean wild soybean.
서 언
세계 인구의 증가로 지속적이고 안정적인 식량 공급은 21세기에 가장 중요한 과제로 고려되고 있다(
Chaudhary et al. 2015). 대두(
Glycine max (L) Merr.)는 단백질 함량 약40%, 지방 함량 약 20%의 중요한 영양 공급원일 뿐만 아니라 사료, 바이오 원료 생산 등 다양하게 이용된다(
Kofsky et al. 2018,
Aleem et al. 2020). 또한, 20/21년 기준으로 대두는 글로벌 시장에 단백질 공급량 약 70%와 식물성 기름 공급을 야자유에 이어 두번째(약 29%) 가장 많이 생산되는 전세계적으로 가장 중요한 작물 중 하나이다(
Lin et al. 2022). 국내 대두 생산량은 연간 약 80,926톤(2021년)정도이나 전체적으로 감소하는 추세이다(
KREI 2021).
여름철 잦은 태풍과 집중호우 등의 기상이변으로 수분 스트레스에 의한 많은 식량작물의 피해가 증가되고 있는 추세에 있다(
Valliyodan et al. 2017,
Kim et al. 2021,
Park et al. 2022). 대두는 4-5월에 파종하여 7-8월에 수확기로 접어들기 때문에 침수 피해에 매우 취약하며 발아 및 초기 생육기 부터 영양 및 생식 단계에 걸쳐 전반적으로 침수 스트레스에 민감하여 생산량의 감소를 초래한다(
Kokubun 2013,
Kim et al. 2015,
Seo et al. 2017,
Sharmin et al. 2020). 침수 상태에서 세포의 급격한 팽창으로 인한 조직 파괴로 생육 초기에 식물체의 성장을 방해할 뿐만 아니라 광합성, 호흡대사, 질소 고정 및 바이오매스 축적 등의 제한과 병원균에 대한 피해 증가로 위험도가 상당히 높다(
Kokubun 2013,
Valliyodan et al. 2017,
Kim 2019,
Zhang et al. 2022). 특히 식물은 광합성과 호흡에 필요한 가스교환이 필수적 요인이나 침수로 인한 토양내 과도한 수분은 산소 및 가스 전달을 차단하여 동물과 마찬가지로 식물도 저산소증 혹은 무산소증으로 이어질 수 있다(
Sairam et al. 2008,
Kim et al. 2021). 산소가 부족할 경우에 식물체는 포도당 생성 등 다양한 대사 메커니즘에 문제가 발생하게 된다. 이에 적응하기 위해 에탄올, 젖산 등의 발효 메커니즘 효소의 유도와 같은 생리학적인 대체 과정 또는 수면에 가까운 줄기부분에 팽창하여 다수의 부정근을 형성하거나 뿌리에 통기조직의 발달을 통해 구조적 변형을 유도한다(
Drew 1997,
Alam et al. 2010,
Kim et al. 2015,
Kim et al. 2021). 최근 돌콩 염기 서열이 완전히 해독되어 침수 스트레스 적응 메커니즘에 관련하여 저항성 유전자에 관한 연구가 활발히 이루어지고 있으나 여전히 저항성 연구는 부족한 상황이며, 특히 그동안의 침수 스트레스에 대한 저항성 연구가 뿌리내 유전적 기능 연구로 진행되고 있어서 생육 초기 식물체 지상부의 유전자 발현의 변화에 대한 기능 연구는 여전히 제한적인 수준으로 평가된다(
Sharmin et al. 2020). 하지만 돌콩이 가진 유전적인 잠재력이 일반 대두에 여러 가지 생물학적 / 비생물학적 스트레스 저항성 육종에 활용될 것이라 기대된다(
Kim et al. 2021,
Li et al. 2020).
본 연구는 대두의 기원종이며 다양한 환경 스트레스에 저항성 인자를 가지고 있는 돌콩을 대상으로 침수 처리를 통해 수분 스트레스를 처리하고 대량 전사체 분석을 하였다. 침수 조건에서 생육 초기에 식물체 지상부에서 발현되는 다양한 유용 유전자에 대한 기작 및 기능 분석을 수행하여 수분 스트레스에 관련된 연관 후보 유전자를 발굴하고 이를 통한 적응 메커니즘을 분석함으로써 향후 대두 수분 스트레스에 대한 저항성 품종 육성에 기여하고자 한다.
재료 및 방법
식물 재료 및 침수 처리
본 실험은 국립백두대간수목원 시드뱅크에서 제공받은 야생형콩 돌콩(Glycine soja Sieb. & Zucc., accession no.: 2019-008991) 1개의 자원을 이용하여 진행되었다. 돌콩을 25°C 에서 약 24시간 동안 침지 시킨 후 발아시켜 250 g으로 동일한 양의 상토를 담은 플라스틱 사각 포트(15 cm×15 cm×17 cm)에 1개체 씩 이식하였다. 이식 후 각 개체는 V3시기(Third trifoliolate)까지 생육시켰다.
침수 처리는 국립공주대학교 유리온실에서 14/10시간의 광주기와 25°C 온도 조건에서 실시하였다(
Lee et al. 2008). 침수 처리 전 토양수분 함량은 40%로 동일하게 유지되었으며,
Chen et al. (2016)의 방법을 참고하여V3시기에 지표면과 식물체의 줄기가 만나는 높이까지 물을 채워 7일간 침수 처리하였으며 12시간마다 지속적으로 물을 공급하여 동일한 물 높이를 유지하였다. 실험 진행을 위한 샘플은 침수 처리 전 0일차에 지상부 전체를 대조군으로 사용하였으며, 침수 처리 7일차에 지상부 전체를 처리군으로 사용하였다. 대조군과 처리군 모두 독립적으로 3개체씩 수확하였으며 RNA 추출을 위해 액체질소를 통해 급속 냉각하여 -80°C에 보관하였다.
Total RNA는 TRIzolR reagent (Thermo Fisher Scientific, MA, USA)를 사용하여 추출 하였으며 제조사의 프로토콜에 따라 진행되었다. cDNA 합성은 Power cDNA Synthesis Kit (iNtRON Biotechnology, Seoul, Korea)를 사용하여 제조사의 프로토콜에 따라 수행하였다. RNA 순도 및 농도는 NanoDrop8000 분광광도계(Thermo Fisher scientific, MA, USA)로 측정하였으며 라이브러리 구축에 적합하도록 RNA Integrity Number (RIN)<7 및 rRNA ratio<1.5 로 cut-off 되었다. RNA-seq 진행을 위해 TruSeq™ RNA library prep kit (Illumina, CA, USA)를 사용하여 라이브러리를 구축하였고 Illumina NovaSeq6000 platform (Illumina, CA, USA) 로 100 bp paired-end 시퀀싱을 수행하였다.
RNA-seq 데이터 전처리 및 DEG 분석
Functional annotation 분석
유전자 발현 분석
선발된 DEGs에 대한 Quantitative Real-time PCR은 Rotor-Gene Q (QIAGEN, Hilden, Germany) Real Time-PCR machine으로 Rotor-Gene SYBR Green PCR kit (QIAGEN, Hilden, Germany)를 사용하여 실시하였다. DEGs 특이적 프라이머는 Primer3Plus (
https://www.bioinformatics.nl/cgi-bin/primer3plus/primer3plus.cgi) 소프트웨어를 사용하여 설계되었으며 제조사에서 제시한 thermal cycling 조건을 따라 PCR을 수행하였다. Housekeeping gene은
GsTUA5 (XM_028377038)를 활용하였으며 모든 분석에서 각 sample에 대하여 생물학적 반복, 기술적 반복을 각각 3회 실시하여 2
-ΔΔCt 방법(
Livak et al. 2001)을 통해 상대적 발현 수준을 정규화(normalization)하였다.
결과 및 고찰
침수 스트레스에 따른 대량전사체 분석
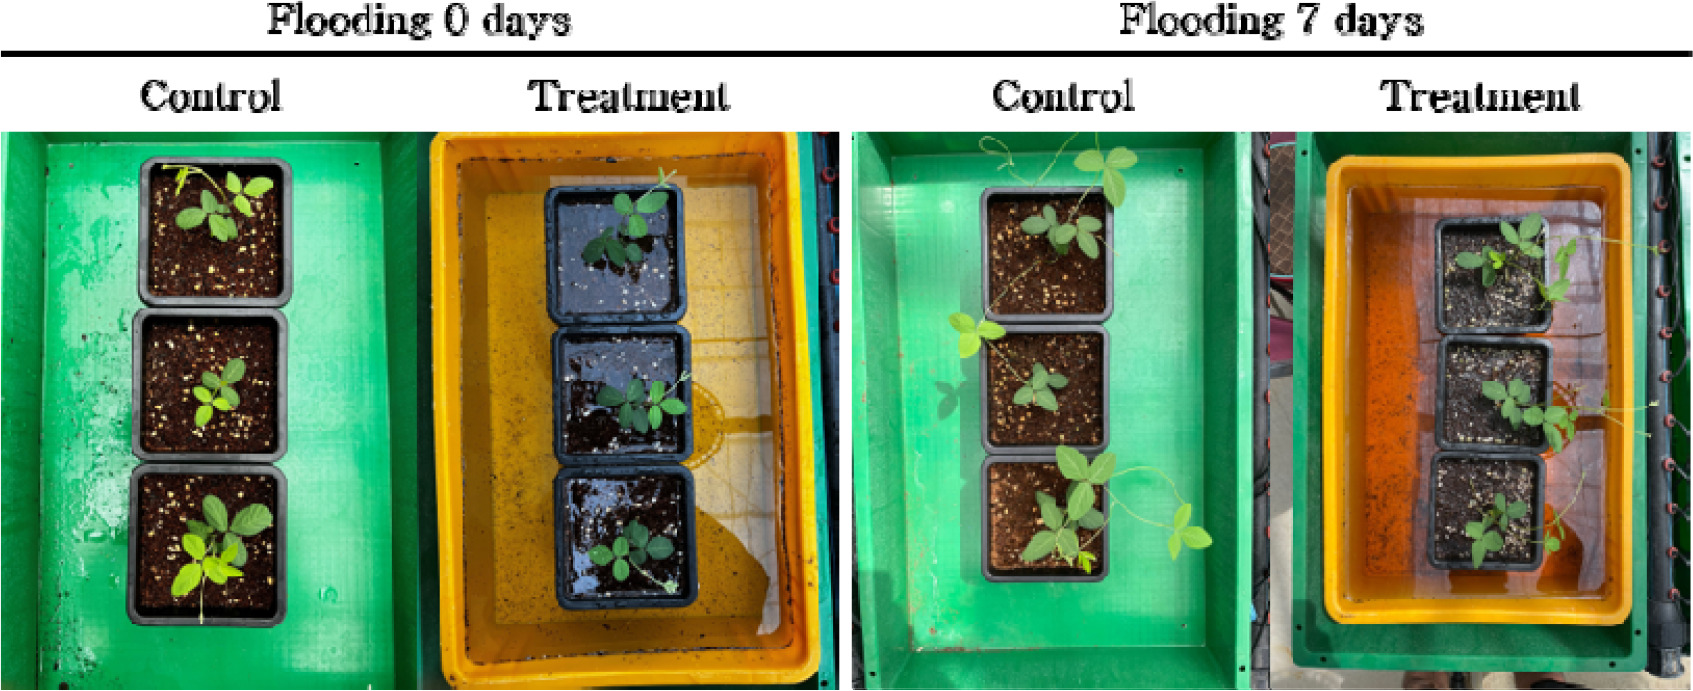
대량전사체 분석 진행을 위해 야생 콩으로 대두의 기원 종인 돌콩을 대상으로 침수 스트레스 처리를 실시하였다(
Fig. 1). V3시기를 기준으로 총 7일간 침수처리 하였으며 처리 전 0일 차인 식물체를 대조군으로 7일간 침수처리한 식물체를 비교군으로 하였다. 이후 두 처리조건에 대한 RNA를 추출하여 RNA sequencing을 수행하였다. 각 샘플은 3반복으로 두 처리 조건에 대해 대조군 평균 62,818,348개와 침수 조건 평균 76,322,947개의 raw reads를 돌콩 reference sequence에 매핑 되어 대조군 평균 55,350,568개(약 88%) 및 침수 조건 평균 61,010,639개(약 80%)의 mapped reads를 얻었다(
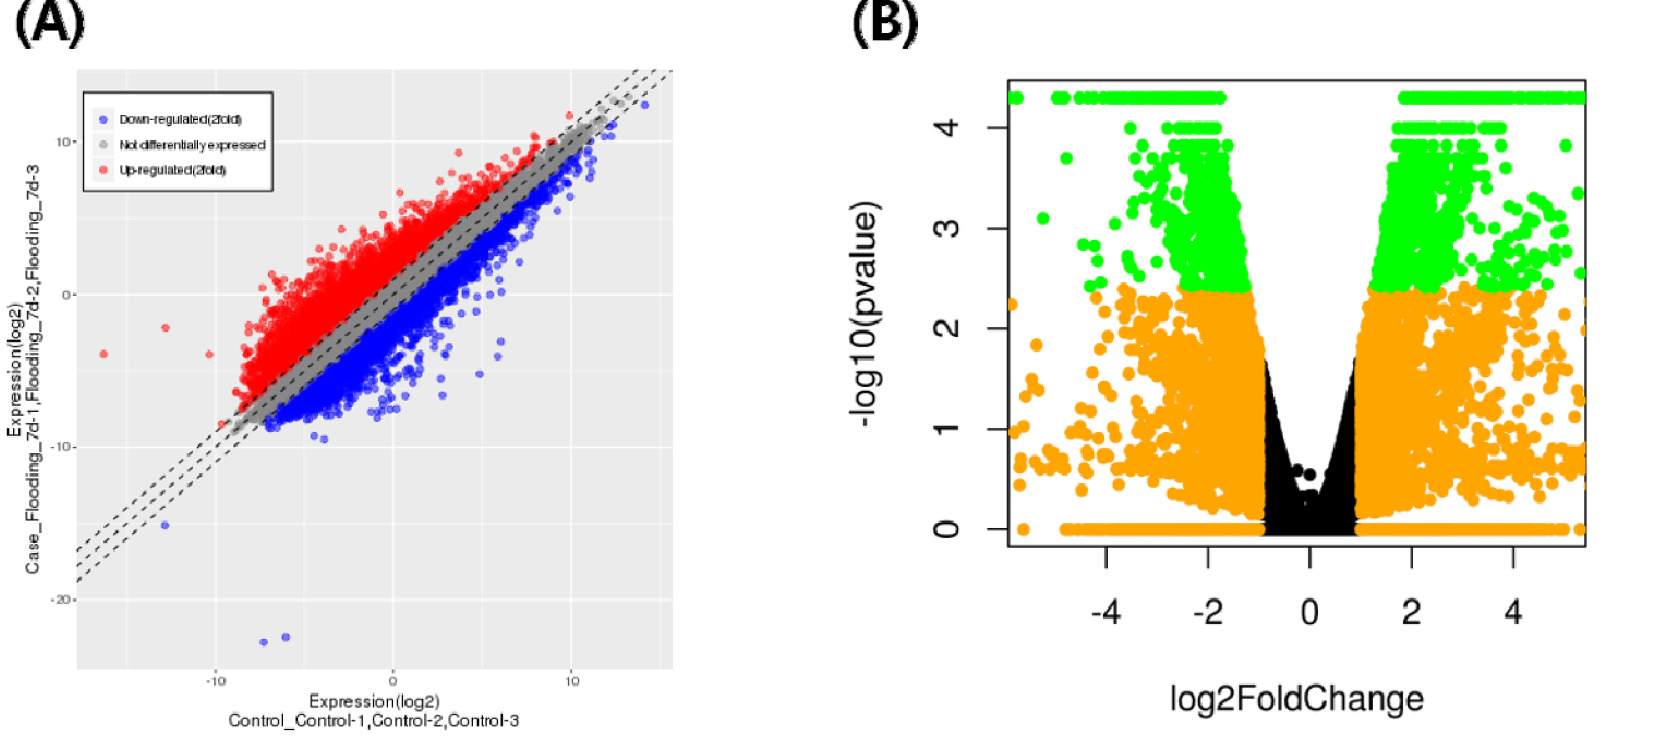
Table 1). 두 처리 조건에 대한 mapped reads는 DEGs 분석을 위해 FPKM으로 정규화 하여 DEGs 분석 전 대조군 및 비교군의 반복 수에 대하여 DEGs 분석에 대한 적합도를 검정한 후 DEGs 분석을 수행하였다(
Fig. 2). 총 59,365개의 DEGs를 얻어 통계적으로 유의한 차이가 있는 DEG를 log
2FC<|2|, FDR<0.05로 cut off하여 총 816개의 DEGs로 압축하였으며 그중 상향 조절(up-regulation)되는 DEGs 524개 및 하향 조절(down-regulation)되는 DEGs 292개를 최종적으로 선별하였다(
Table 1,
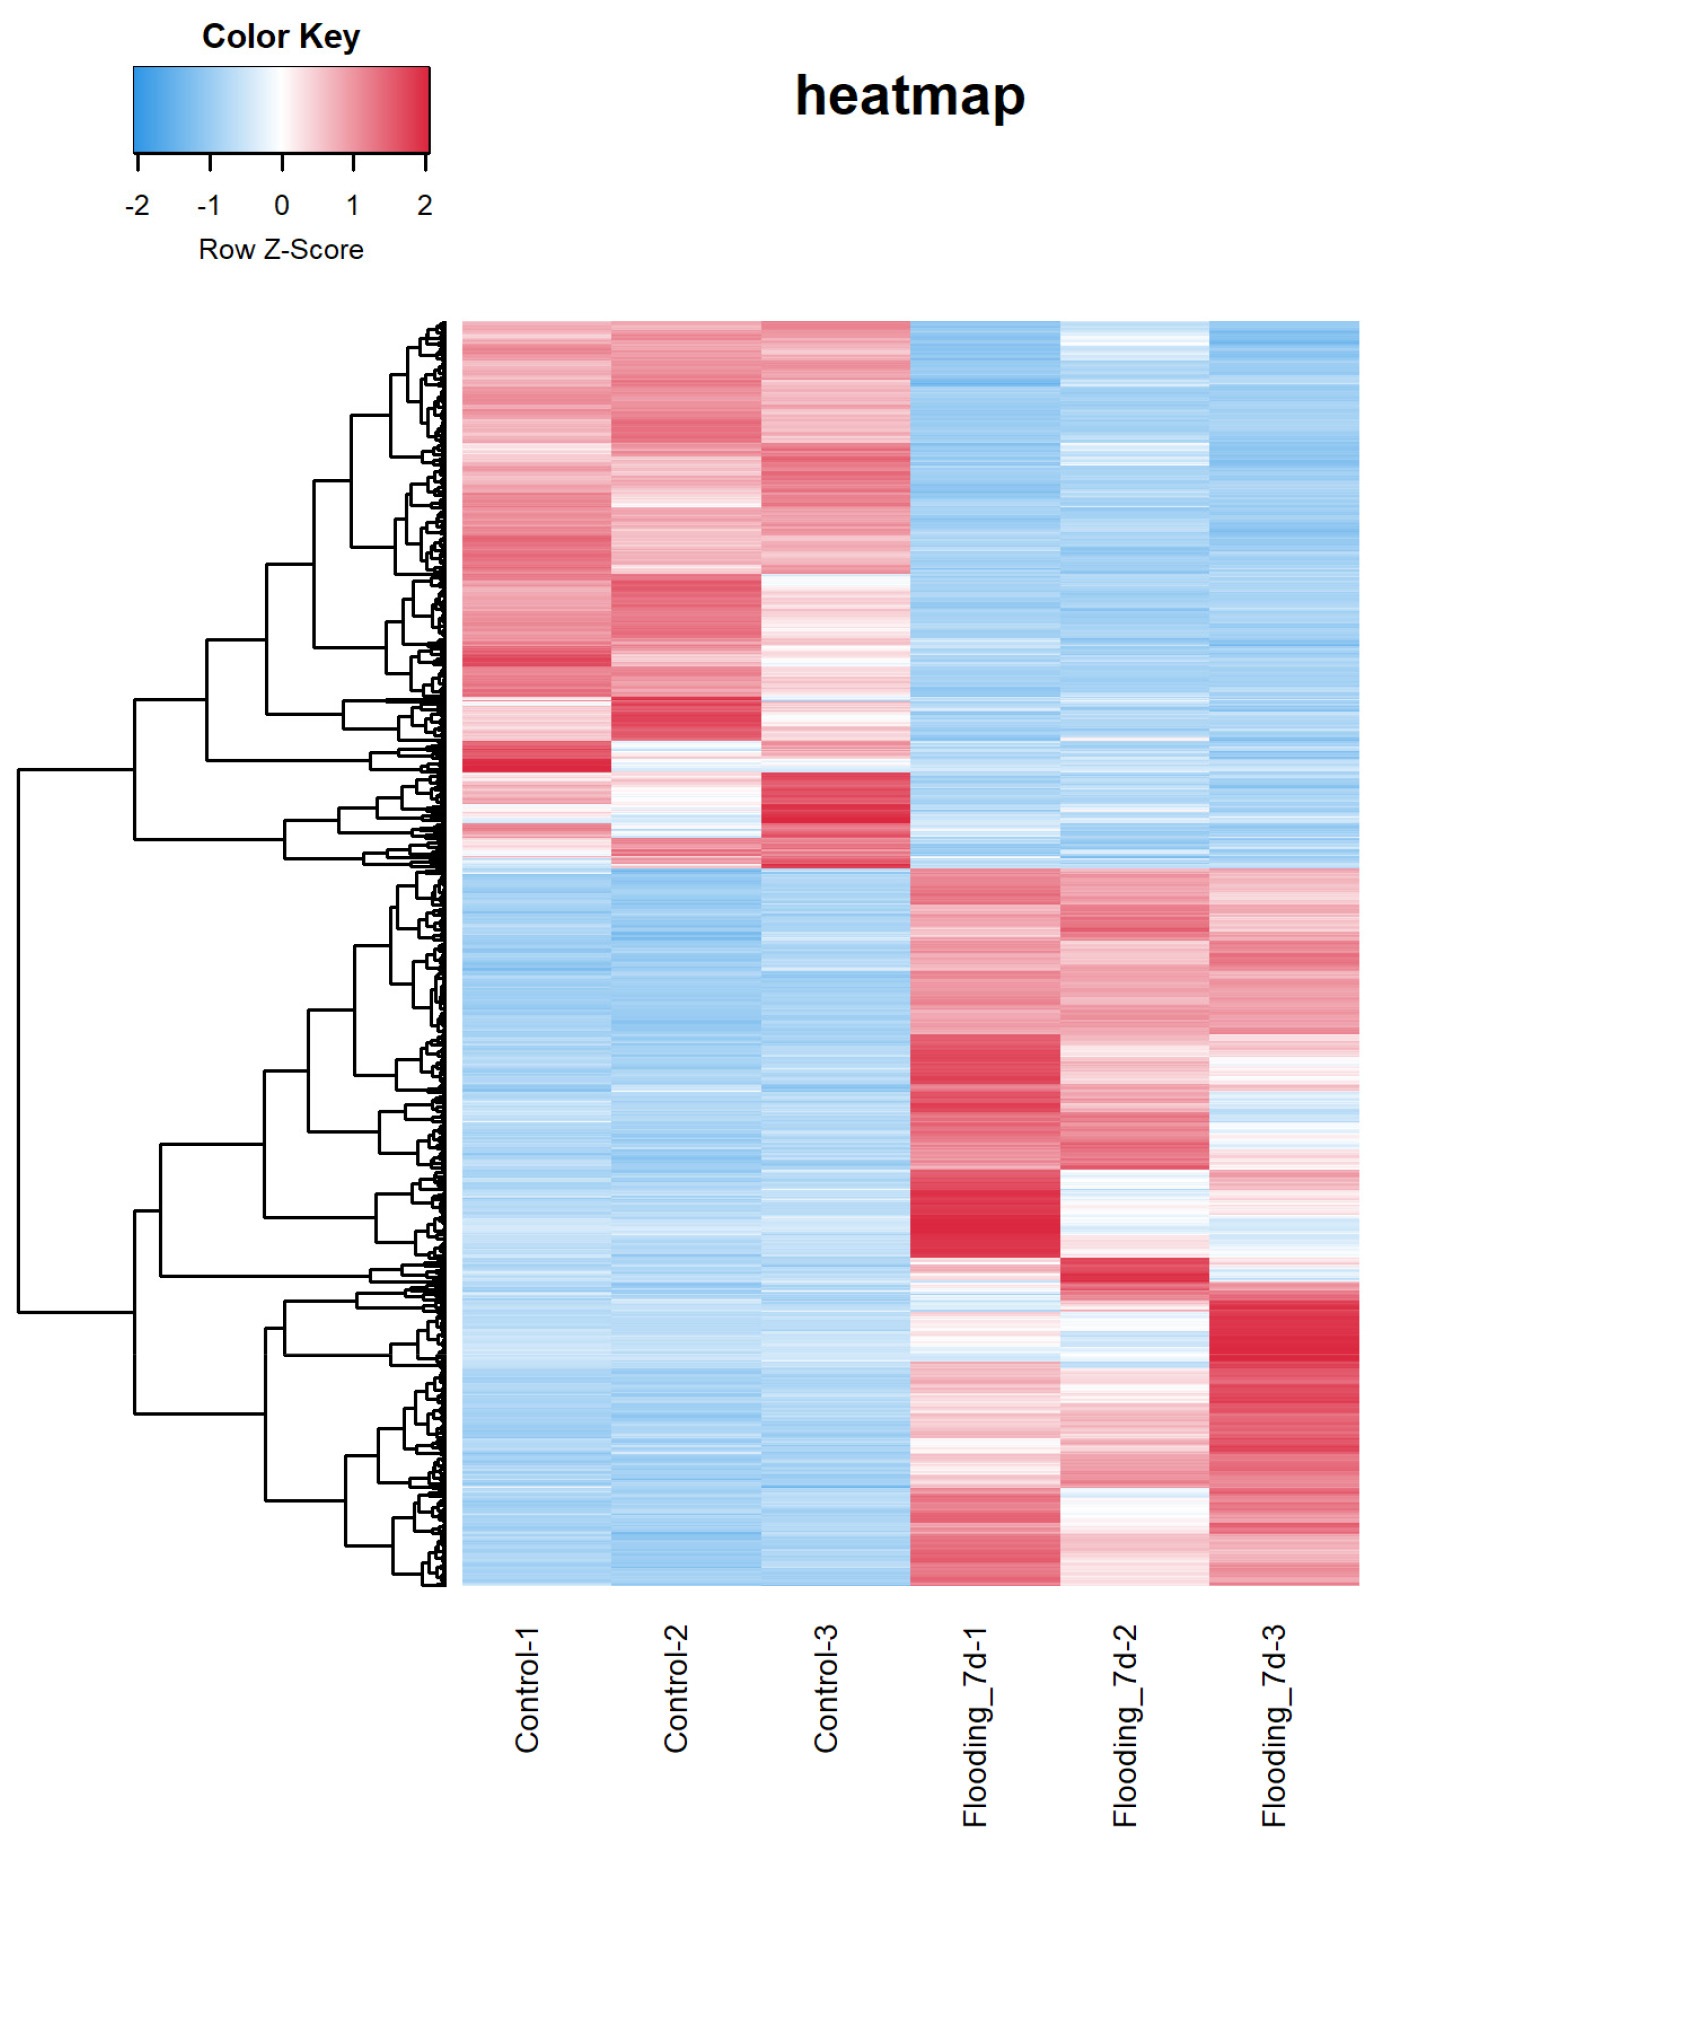
Supplementary Table 1). 최종 선발된 DEGs는 heatmap을 통해 침수 처리 하에 변화하는 발현 패턴을 시각화 하였다(
Fig. 3).
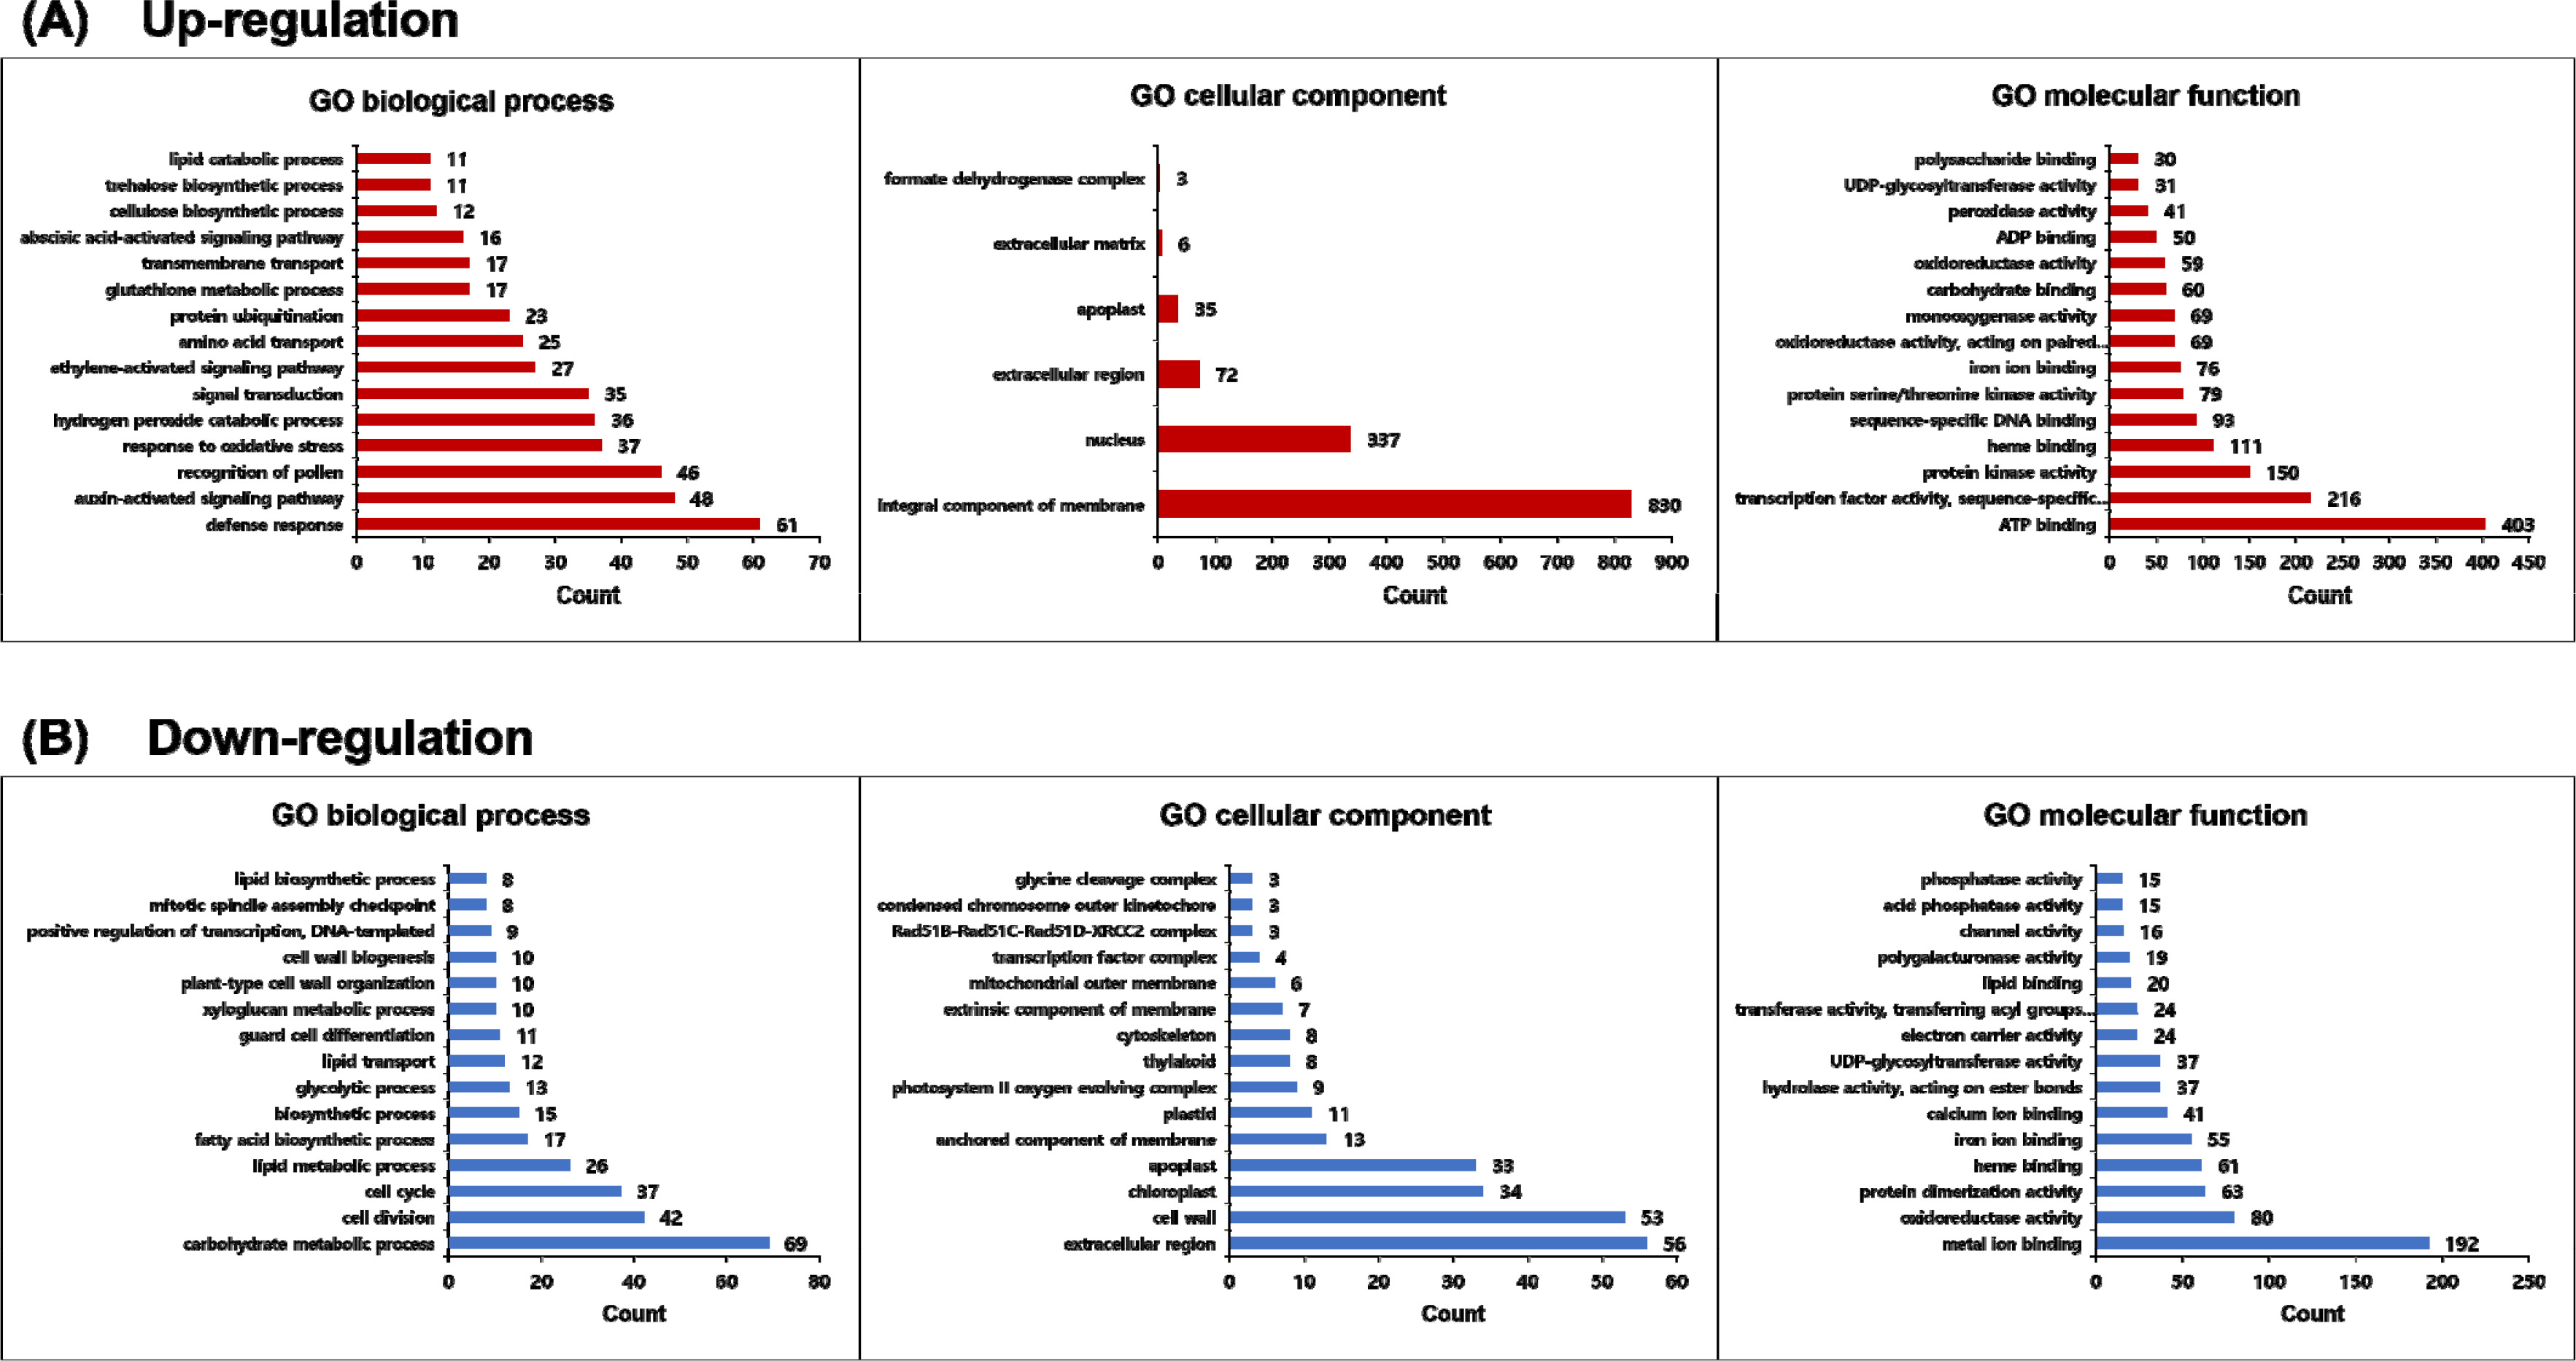
선발된 DEGs에 대한 기능적 이해를 위하여 functional annotation 분석을 수행하였다. Annotation별로 하나 이상의 유전자가 검출될 경우 기능적으로 유효한 것으로 판단하여 GO 분석을 수행하였으며 ontology는 크게 biological process (BP), cellular component (CC) 및 molecular function (MF) 3가지의 범주로 구분되었다. Functional annotation 프로파일링은 2 fold 및 FDR<0.05기준의 모든 DEG에 대해 수행되었다. GO분석결과 침수 처리에 따른 up- 및 down-regulation된 각 GO term은 795 (7,623 DEGs) 및 1,028 (7,800 DEGs)개였다. 그 중 up- 및 down-regulation된 GO term은 통계적 타당성을 위해
p-value< 0.05로 cut off 하였다. 최종적으로 선별된 GO term은 각각 122 (4,833 DEGs) 및 133 (2,840 DEGs)개 였으며 해당 결과에 따른 상위 15개의 GO term을 각각 표시하였다(
Fig. 4,
Supplementary Table 2).
BP 카테고리에서 up-regulation된 유전자 중 defense response (GO:0006952) 61개, auxin-activated signaling pathway (GO: 0009734) 48개, recognition of pollen (GO:0048544) 46개, response to oxidative stress (GO:0006979) 37개, hydrogen peroxide catabolic process (GO:0042744) 36개, signal transduction (GO:0007165) 35개 및 ethylene-activated signaling pathway (GO:0009873) 27개가 가장 높게 나타났으며 down-regulation된 유전자 중 carbohydrate metabolic process (GO:0005975) 69개, cell division (GO:0051301) 42개 및 cell cycle (GO:0007049) 37개로 세포 분열과 관련한 유전자가 상대적으로 가장 높게 나타났으며 그 외 lipid metabolic process (GO:0006629) 26개, fatty acid biosynthetic process (GO:0006633) 17개, plant-type cell wall organization (GO:0009664) 10개 및 cell wall biogenesis (GO:0042546) 10개 등 세포막 및 세포벽 발달과 관련한 유전자가 확인되었다. 식물체는 변화하는 환경 조건에서 반응하여 다양한 방어 기작에 의해 스트레스에 적응한다. 침수 환경에서 생육중인 식물체는 내부 통기 및 저산소증을 해결하기 위해 통기 조직의 발달을 통해 형태학적인 적응을 하려한다(
Sasidharan et al. 2018). 이러한 통기 조직 및 외래성 뿌리 조직은 ROS (reactive oxygen species)와 에틸렌 신호전달간의 상호작용에 의해 에틸렌을 매개하여 ROS의 축적을 통해 세포사멸이 유도되어 발달된다고 알려져 있다(
Steffens et al. 2012,
Sasidharan et al. 2018). 이러한 에틸렌 축적은 모든 세포를 포함하여 이루어지며 특히 효소적 ROS는 세포벽, 원형질막 및 아포플라스트와 같은 세포 내의 여러 기관에서 형성된다(
Mignolet-Spruyt et al. 2016,
Sasidharan et al. 2018). 옥신 신호전달 경로를 통해 빛에 대한 반응, 기관, 뿌리 및 새싹 구조, 관다발 형성 등의 식물 성장 및 발달의 다양한 측면을 조절한다(
Schepetilnikov & Ryabova 2017). 에틸렌과 옥신 두 신호 경로의 상호작용에 의한 상승 효과로 배축 신장, 뿌리 성장 및 분화 등을 조절한다고 밝혀져 있다(
Růžička et al. 2007,
Sauter 2013). 따라서 돌콩 생육 초기 침수 처리로 인한 식물체내 에틸렌 및 옥신의 활성 신호 경로 유전자의 축적은 침수 환경에 적응하기 위한 식물체 방어기작의 일환으로 사료된다.
CC 카테고리에서는 up-regulation된 유전자에는 integral component of membrane (GO:0016021) 830개, nucleus (GO:0005634) 337개, extracellular region (GO:0005576) 72개, apoplast (GO: 0048046) 35개, extracellular matrix (GO:0031012) 6개 및 formate dehydrogenase complex (GO:0009326) 3개 순으로 나타났으며 down-regulation된 유전자에서 extracellular region (GO:0005576) 56개, cell wall (GO:0005618) 53개, apoplast (GO:0048046) 33개 및 anchored component of membrane (GO:0031225) 13개의 유전자들이 높게 확인되었다. 식물은 침수 환경에서 적응하기위해 세포간 분자 이동 및 반응을 통해 에틸렌 축적과 같은 변화를 유도하여 생존한다. 따라서 돌콩 침수 처리에서 세포 구성 요소와 관련된 유전자 중 세포 내외의 물질 수송과 관련하여 membrane 구성 요소, 세포벽, 아포플라스트 및 extracellular 와 같은 유전자가 높게 발현되는 것으로 예상된다.
MF 카테고리에서는 up-regulation된 유전자에서 ATP binding (GO:0005524) 403개, transcription factor activity, sequence-specific DNA binding (GO:0003700) 216개, protein kinase activity (GO:0004672) 150개, heme binding (GO:0020037) 111개, sequence-specific DNA binding (GO:0043565) 93개, protein serine/threonine kinase activity (GO:0004674) 79개 및 iron ion binding (GO:0005506) 76개와 down-regulation된 유전자에서 metal ion binding (GO:0046872) 192개, oxidoreductase activity (GO:0016491) 80개, protein dimerization activity (GO:0046983) 63개, heme binding (GO:0020037) 61개, iron ion binding (GO: 0005506) 55개 및 calcium ion binding (GO:0005509) 41개 등이 높게 확인 되었다. ATP-binding cassette (ABC) transporters는 원핵생물에서 동물에 이르기까지 모든 생물 종에서 존재하는 매우 중요한 수송체이다(
Dahuja et al. 2020). 특히 대부분의 식물체가 다른 생물과 비교하여 3-4배가 넘는 ABC 수송체를 보유하고 있으며 다양한 생물적 및 비생물적 스트레스 반응, 종자 휴면, 곡물의 형태 조절, 성장과 분화, 항상성 유지 및 ABA를 포함하는 기타 식물 호르몬의 수송체 역할 등 다양한 세포내 과정에 관여한다(
Do et al. 2018,
Dahuja et al. 2020). 아직까지 수분 스트레스와 관련하여 ATP-binding 및 ABC 수송체의 반응에 대해 연구되어진 바가 없으나 돌콩의 생육 초기 침수 환경에서 ATP-binding 관련한 유전자의 많은 종류의 발현은 추가적인 연구가 이루어져야 한다고 판단된다. Transcription factor 및 protein kinase activity는 up-regulation 그룹에서 두번째로 높은 발현 수준을 나타냈다. 대부분 고등 식물은 단백질 인산화 효소와 반응하는 전사인자들을 통해 에틸렌의 센서 역할을 한다(
Gamble et al. 1998,
Grichko & Glick 2001). 애기장대 ethylene response 1 (ETR1) 단백질은 에틸렌과 결합하는 에틸렌 수용체로써 ETR1의 N-말단에 위치하는 hydrophobic domain에 결합한 후 ETR1의 C-말단에 위치하는 histidine kinase domain에 His-353에서 자가인산화가 된다(
Gamble et al. 1998,
Theologis 1998,
Grichko & Glick 2001). 따라서 에틸렌 신호전달은 수용체의 kinase 활성의 변화에 의해 조절될 수 있음을 확인 할 수 있으며 침수 처리에 따른 kinase의 활성으로 에틸렌 신호전달을 조절할 것으로 예상된다.
Yin et al. (2016)은 애기장대의 원형질막에 위치하여 산소 결합, 이온 결합 및 산화-환원 과정에 관여하는 cytochrome P450 (CYP) 77B1 단백질과 계통발생학적으로 밀접한 대두의 CYP 77A1 단백질이 생육 초기 침수 스트레스 저항성에 관여하는 것을 확인하였으며, 대두 CYP 77B1 단백질은 heme-binding motif 를 보유하고 있다. Heme bind motif는 세포 호흡, 단백질 표적화, 전사 및 번역 조절, 이온 채널 조절 및 신호 전달, RNA 및 단백질 분해 등 진핵세포에서 매우 중요한 생물학적 과정에 관여한다(
Vanhee et al. 2011). 침수 환경에서의 ‘heme-binding’의 명확한 기능과 역할은 아직까지 밝혀진 바가 없다. 그러나 탐색된 다수의 heme-binding 관련 DEGs가 높은 수준의 up- 및 down-regulation되는 것이 확인되었다. 이는 침수된 식물체의 혐기성 조건에서 세포 호흡 조절과 다양한 이온 결합을 통한 신호 전달, 산화-환원 과정의 조절을 통해 스트레스에 반응하는 것으로 보여진다. RNA-seq결과는 다양한 이온 결합 그룹에 포함되는 유전자가 높은 수준으로 up- 및 down-regulation되는 것도 확인하였다. 침수 환경에서 식물 뿌리의 ROS가 축적되는 몇 가지 메커니즘에서 과도한 양의 금속 양이온의 축적이 ROS 형성을 촉진한다고 알려져 있다(
Shabala et al. 2014). 또한, 세포 내 철 이온 농도를 조절하는 철 저장 단백질인 ferritin은 철 이온을 매개로 하는 자유 라디칼(free radical) 반응을 제거하는데 침수 스트레스를 받은 대두에서
ferritin 1 유전자의 전사체가 up-regulation되는 것으로 확인되었다(
Kamal et al. 2015). 침수 환경에서 대두 식물체내 과도한 금속 이온이 축적되면서 ferritin이 따라 증가하여 과도한 철 이온에 따른 ROS 축적으로부터 식물 세포를 보호하는 역할을 하였을 것으로 판단되며, 결과적으로 돌콩 식물 내 다양한 금속 이온 결합과 관련된 유전자들의 발현이 크게 변화하였을 것으로 예상된다.
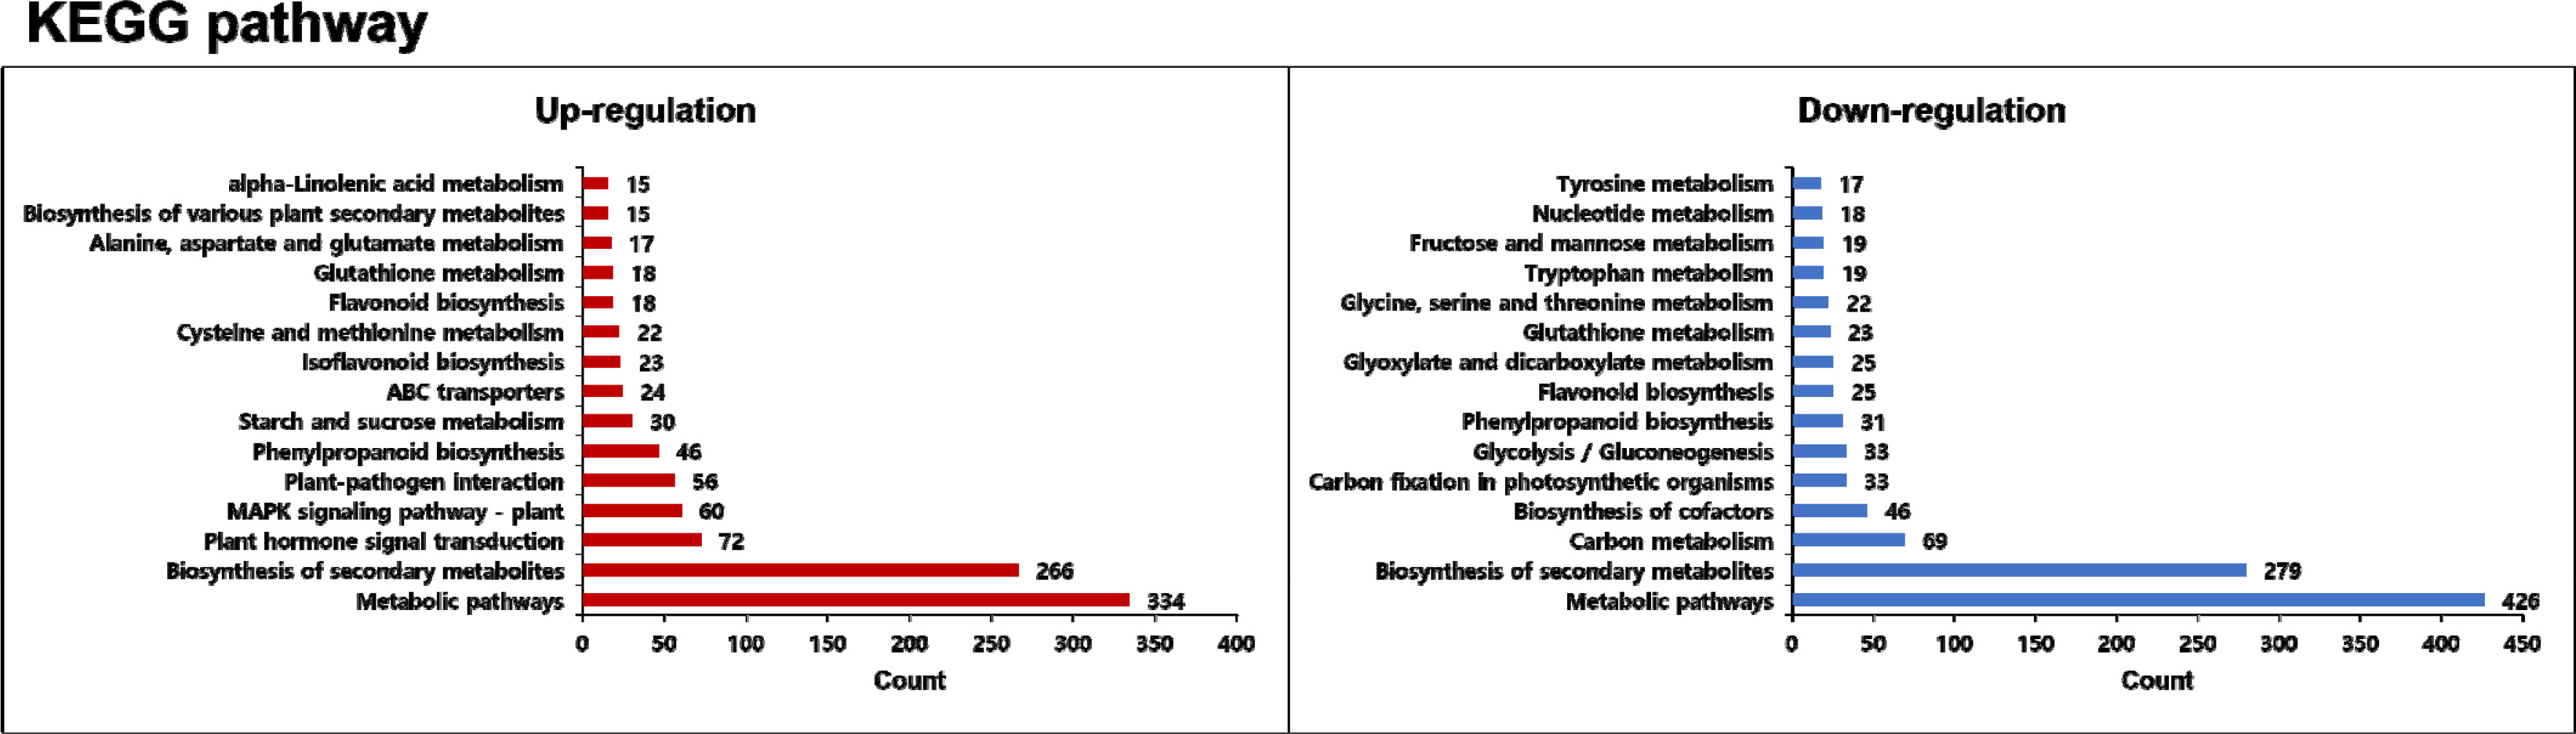
KEGG pathway 분석 결과는 물질 대사, 생합성을 포함하여 신호 전달, 상호작용 경로에 관련한 다양한 유전자가 up- 또는 down-regulation되었음을 보여주었다(
Fig. 5). Metabolic pathways (gsh01100)와 biosynthesis of secondary metabolites (gsj01110)가 up- 및 down-regulation되는 유전자에 대하여 각각 334/426개 및 266/279개로 가장 많이 포함되어 있었다. 다음으로 up-regulation된 유전자로는 plant hormone signal transduction (gsj04075) 72개, MAPK signaling pathway-plant (gsj04016) 60개, plant-pathogen interaction (gsj04626) 56개, phenylpropanoid biosynthesis (gsj00940) 46개, starch and sucrose metabolism (gsj00500) 30개, ABC transporters (gsj02010) 24개 및 isoflavonoid biosynthesis (gsj00943) 23개 등 순으로 확인되었으며, down-regulation된 유전자로는 carbon metabolism (gsj01200) 69개, biosynthesis of cofactors (gsj01240) 46개, carbon fixation in photosynthetic organisms (gsj00710) 33개, glycolysis / gluconeogenesis (gsj00010) 33개, phenylpropanoid biosynthesis (gsj00940) 31개, flavonoid biosynthesis (gsj00941) 25개, glyoxylate and dicarboxylate metabolism (gsj00630) 25개 및 glutathione metabolism (gsj00480) 23개 등의 순으로 확인되었다(Supplemetary
Table 2).
침수 스트레스는 식물체에서 전사 및 대사 경로의 재프로그래밍을 통한 다양한 변화로 에너지 항상성과 스트레스 순응을 유지한다(
Sasidharan et al. 2017,
Ruperti et al. 2019). 대표적으로 침수에 의한 저산소 환경에서 가장 초기에 세포 사멸, 통기조직 형성 및 ABA에 의한 기공 조절 이전에 세포질의 pH 농도가 7 미만으로 떨어지게 된다(
Wilkinson 1999,
Drew et al. 2000,
Dat et al. 2004). 정상조건에서 활성화되는 젖산 탈수소효소는 침수 처리로 인해 낮아진 pH 농도 범위에서는 젖산 탈수소효소의 발현이 낮아지고 대신 피루브산 탈수소효소가 활성화되어 피루브산을 아세트알데히드로 전환한 다음 알코올 탈수소효소에 의해 에탄올로 전환된다(
Dat et al. 2004). 또한, sucrose, glucose 및 fructose 감지 등 무산소 조건에 의한 저에너지 상태에서 균형을 이루기 위해 주요 전사체, 단백질체 및 대사체의 변화가 나타난다(
Sasidharan et al. 2017). Up-regulation된 plant hormone signal transduction의 경우에는 침수 환경에서 식물 생장과 관련한 다양한 호르몬이 신호기작에 반응하고 또다른 신호 전달 경로를 통해 down-stream 영역을 조절한다(
Zhao et al. 2021). 이런 기작의 대표적인 식물 호르몬이 ABA인데, ABA는 식물 성장, 발달 조절 뿐만 아니라 여러 스트레스 환경에 대한 식물체의 적응 유도와 관련하여 매우 중요한 식물 호르몬이다(
Danquah et al. 2014). 가뭄, 침수, 염분 또는 저온 스트레스 등 수분 스트레스 환경에서 식물은 ABA를 축적하여 기공 폐쇄를 유발해 잎의 수분을 보존하게 된다(
Dat et al. 2004,
Lim et al. 2015,
Zhao et al. 2017,
2021). 또한, 저산소 환경에 의한ABA 축적을 포함하여 사이토키닌, 옥신 및 살리실산 등에 의해 nitric oxide (NO) 생성을 촉매하고 생성된 NO는 신호 전달 경로의 주요 구성 요소인 guanylate cyclase, ADP-ribosyl cyclase 및 MAP kinase (MAPK)를 up-regulation시킨다(
Igamberdiev et al. 2005). MAPK는 세포 외 자극에 대하여 세포막에서부터 세포내 핵까지 전달하는 필수적인 역할을 하는 단백질로 식물에서 많이 연구된 대표적인 신호전달 케스케이드(cascade) 중 하나로 알려져 있다(
Hamel et al. 2012,
Danquah et al. 2014). MAPK 케스케이드를 구성하고 있는 단백질 중 MPK4 및 MPK6는 저온, 저습, 고삼투압 및 상처 등에 의해 일시적으로 빠르게 활성화되는 것으로 알려져 있다(
Ichimura et al. 2000). 또 다른 구성 단백질 MKK1은 염분 및 가뭄 스트레스에 의해 활성화되면서 MPK4의 인산화가 유발되며 비생물적 스트레스 조건에서 신호 전달의 역할을 하는 것임이 밝혀졌다(
Teige et al. 2004). 게다가, 식물의 비생물적 스트레스 신호 전달자로서 기능을 하는 MAPK는 ABA의 축적이 증가할수록 MAPK 케스케이드 구성 요소의 전사 조절, 단백질 축적 및 kinase 활성을 유도하는 것이 확인되었기 때문에 침수 조건에서 식물 호르몬 신호 전달과 MAPK 신호 전달 경로 관련 유전자의 발현이 함께 높은 수준으로 증가하였을 것으로 예상된다(
Danquah et al. 2014). Down-regulation된 유전자들 가운데 carbon metabolism 그룹과 carbon fixation in photosynthetic organisms 그룹에서 많은 양이 포함되어 있었다. 잎은 성장에 필수 기질인 탄소를 얻기 위해 CO
2 흡수하는데 이 과정에서 물을 소비한다(
Cowan 1982). 수분 스트레스는 식물체의 탄소 흡수와 성장에 부정적인 영향을 주게 되지만 이에 대한 반응으로 대사 변화 및 구조적 변화를 필요로 하는 적응을 통해 스트레스 상에서 식물의 기능을 개선한다(
Bohnert & Sheveleva 1998). 뿌리와 싹의 비율의 변화 또는 줄기에 일시적으로 저장되어 있는 물질을 통해 질소 및 탄소 대사의 변화를 유도하며 결과적으로 수분 스트레스 조건에서 광합성 및 탄소 대사의 down-regulation을 동반하게 된다(
Chaves et al. 2002). 당분해와 관련하여 starch and sucrose metabolism관련 유전자는 up-regulation 되었지만, 이를 포함하고 있는 glycolysis / gluconeogenesis 관련 유전자는 전체적으로 down-regulation되었다.
Ruperti et al. (2019)에 따르면, 침수 조건에 따라 포도나무의 해당과정과 발효 경로에 관여하는 모든 전사체의 발현에 변화가 유도되었으며 이러한 유전자 중 starch and sucrose metabolism에 관련한 유전자에서 up-regulation되는 경향이 나타났으며, 전체적인 당분해 관련 유전자에서 down-regulation되는 유전자도 포함되어 있었다. 당분해와 알코올 발효 경로는 침수 환경에서 혐기성 조건의 낮은 산소에 반응하는데, 이러한 사실은 세포내 에너지 절약을 위한 메커니즘으로서 당대사 변화에 의한 적응으로 볼 수 있다(
Ruperti et al. 2019).
과 수분 스트레스는 다양한 생리학적인 대체 메커니즘을 통해 통기조직의 발달 및 효소의 유도로 저항성을 부여하여 침수로 인한 저산소 또는 무산소 환경을 극복한다(
Drew 1997,
Alam et al. 2010,
Kim et al. 2015,
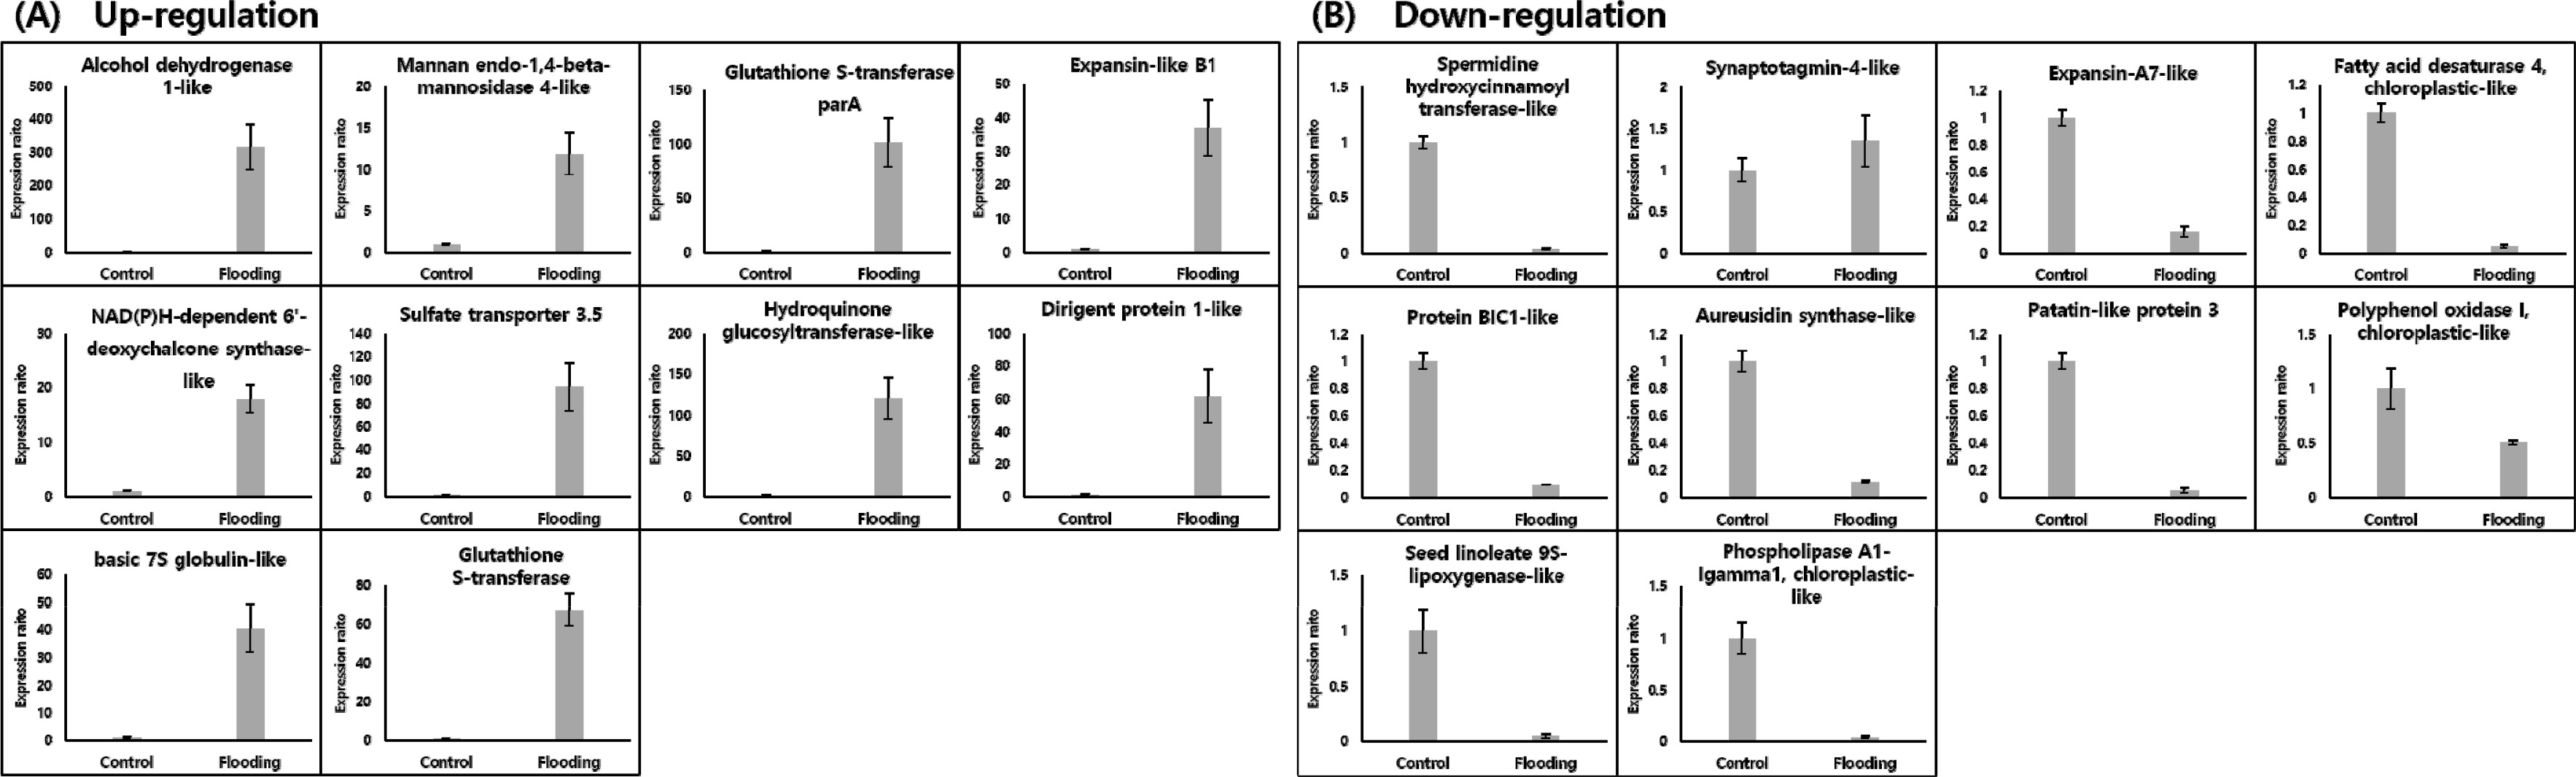
Kim et al. 2021). 선행 연구들을 통해 알려진 내용을 참고하여 선발된 DEGs 중 침수 및 수분 스트레스 등에 관련 유전자와 높은 발현 차이를 보이는 유전자를 중점적으로 선발하여 대조군과 침수처리군에 대하여 qRT-PCR 분석을 이용하여 발현 양상을 검정하였다. qRT-PCR 분석 수행을 위해
Table 2에서 압축된 DEGs에 대하여 침수 및 수분 스트레스와 크게 관련된 유전자를 포함하여 log
2FC 값 기준 up- 및 down-regulation 각각 상위 10개씩 총 20개의 DEGs를 선발하였다(
Table 3). 선발된 DEGs에 각각 특이적인 프라이머를 사용하여 qRT-PCR을 통한 상대적 발현 수준을 분석한 결과, up- 및 down-regulation되는 다수 유전자의 발현패턴이 유사하게 나타나는 것을 확인하였으며, down-regulation 되었던
synaptotagmin- 4-like, transcript variant X7 (LOC114409690) 유전자만이 대조군과 발현차이가 나타나지 않았다(
Fig. 6).
Alcohol dehydrogenase (ADH) 는 알코올 탈수소효소로 대표적으로 침수 발생 시 알코올 발효 과정을 통한 스트레스 적응 메커니즘에 중요한 역할을 한다(
Crawford 1967,
Komatsu et al. 2011). 대두의 생육 초기단계 유묘를 침수시켜 산소가 결핍되면 뿌리 끝에서 세포 분열을 위해 높은 에너지를 요구함에 따라 ADH의 전사체와 단백질의 축적이 일시적으로 증가하여 알코올 발효를 유도한다(
Tougou et al. 2012). 침수 스트레스에 저항성을 갖는 대두 품종 Tamahomare에서 높은 ADH의 활성을 갖는 것으로 나타났으며(
Rizal & Karki 2011), 대두의
Adh 유전자 중 하나인
GmAdh2를 도입한 대두 형질전환체에서 침수 처리시 성장 억제가 감소되었고
Adh 유전자의 발현이 증가하였다(
Tougou et al. 2012). 또한, 감마선 조사를 통해 대두 침수스트레스에 저항성을 보이는 돌연변이체에서 단백질 활성을 분석한 결과 Alcohol dehydrogenase 단백질이 빠르게 활성화되는 것이 확인되었다(
Nanjo et al. 2013). 침수된 대두에서 4일간 저산소 조건이 지속될 경우에도 유묘와 뿌리 끝에서 알코올 탈수소 효소가 침수처리가 종료될 때까지 지속적으로 활성화 되었다(
Komatsu et al. 2011,
Wang et al. 2016). 돌콩의 경우에도 7일간의 지속적인 침수처리에서 매우 높은 수준의
Alcohol dehydrogenase 1-like (LOC114383177) 유전자 발현 증가가 확인되었으며 이는 알코올 발효 과정을 통해 저산소 환경에 적응 메커니즘으로 저항성을 부여한 것으로 판단된다. Glutathione-S-transferase (GST)는 생물학적 스트레스를 포함하여 광범위한 스트레스 조건에서 세포 발달 과정에 관여하여 식물체를 보호하는 다기능적 역할을 하는 효소이다(
Gullner et al. 2018,
Kumar & Trivedi 2018). GST는 다양한 제초제와 같은 생체화합이물(xenoboitics)의 해독 작용 뿐만 아니라 세포의 모든 대사에 관여하며 호르몬 항상성 유지, 환경 스트레스와 병원체의 공격 등 수많은 스트레스 반응과 관련이 있다(
Banerjee & Goswami 2009). 돌콩 전사체 분석 결과 GST 유전자
probable glutathione S-transferase parA (LOC114374838)의 발현이 침수 환경에서 매우 높게 나타나는 것을 확인할 수 있다. 그러나 KEGG 분석 결과에 따르면 glutathione metabolism 관련 유전자가 down-regulation되는 것으로 확인되었다. 침수 환경에서 대두의 GST 활성 분석 결과에 따르면 GST가 glutathione 대사를 변화시켜 glutathione 의존성 과산화물 소거를 증가시키면서 침수 스트레스에 의한 대두 뿌리의 산화적 손상을 감소시킨다는 것이 확인되었다(
Sappl et al. 2004,
Kamal & Komatsu 2015). 이를 통해 돌콩도 마찬가지로
GST의 up-regulation에 따라 glutathione metabolism 관련 유전자들의 down-regulation되었을 것으로 판단된다. Expansin (EXP)은 모든 식물에 존재하여 세포벽에 다당류인 셀룰로오스 미세섬유와 자일로 글루칸 사이의 수소결합을 약화시켜 세포벽의 이완을 통한 확장으로 성장에 필요한 세포벽 확장, 수분 흡수 및 스트레스에 대한 반응을 돕는 효소이다(
Li et al. 2003,
Krishnamurthy et al. 2019,
Muthusamy et al. 2020). 또한, EXP은 다양한 식물 발달 과정에서 여러 식물 생장 호르몬에 의해 유도되며 생물 및 비생물적 스트레스에도 관여한다(
Chen et al. 2019). EXP는 크게 α-expansin (EXPA), β-expansin (EXPB), expansin-like A (EXLA) 및 expansin-like B (EXLB)로 암호화되어 있다(
Han et al. 2012). 돌콩에 침수처리를 하였을 때
Expansin-like B1 (LOC114412220)이 높은 수준으로 up-regulation되었으며
Expansin-A7-like (LOC114424245)은 높은 수준으로 down-regulation되는 것을 볼 수 있다. 유채의 EXLB 유전자 중 하나인
BrXLB1은 가뭄, 염분, 과산화수소, 삼투압 스트레스의 수분 스트레스 조건에서 up-regulation되어 반응하는 것으로 밝혀졌다(
Muthusamy et al. 2020). 밀의
TaEXPB2와
TaEXPB23 유전자를 과발현 시킨 담배 형질전환 식물체를 개발하여 대조군 식물체에 비해 고염, 고온, 산화 및 수분 스트레스에 저항성을 나타내는 것을 확인하였다(
Han et al. 2012). 대두의 경우 유묘에서 수분함량에 따른 모든 침수조건에 따라 식물체 모든 조직에서 비슷한 수준으로
EXLB1 전사체와 단백질의 축적이 증가하였다(
Nanjo et al. 2013). 반면에 돌콩의
Expansin- A7-like 유전자의 경우 위 결과와 달리 침수 처리시 매우 낮은 발현을 보였다. 장미의 EXPA 유전자중 하나인
RhEXPA4가 비생물적 스트레스 및 호르몬 처리시 발현이 증가하여 저항성을 조절하는 것으로 나타났다(
Dai et al. 2012,
Lü et al. 2013).
Chen et al. (2019)에 의하면 감자에 수분 스트레스를 부여하였을 때 존재하는 23개의 모든
EXP 유전자에서 반응하여 14개의
EXP 유전자가 up-regulation되었으며 나머지 9개의 유전자가 down-regulation 되었는데
EXPA,
EXPB,
EXLA 및
EXLB 유전자군의 구분없이 규칙적인 패턴은 나타나지 않았으며 각각 독립적인 반응을 하는 것으로 밝혀졌다. Basic 7S globulin은 대두의 종자 저장 단백질로 대표적으로 알려져 있는 단백질이며(
Shutov et al. 2010,
Fujiwara et al. 2014,
Hirano 2021), 대두 뿐만 아니라 밀에서
basic 7S globulin 전사체의 축적은 밀가루 품질을 결정하는 falling number와 연관되어지는 것으로 검정되었다(
Li et al. 2020). 또한, 여러 스트레스 반응, 병원성 미생물의 침입에 대한 항균 작용의 활성 및 혈당, 혈압, 콜레스테롤 및 항암 억제 조절 등의 역할에도 기능한다고 알려져 있다(
Hirano 2021). 하지만 대부분의 basic 7S globulin의 기능에 관한 연구는 종자 내에서 이루어져 있으며 생육 초기 단계에서 수분 스트레스에 의한 basic 7S globulin의 반응과 축적에 관련하여 알려진 바가 없다. 우리는 돌콩에서 침수 처리시
basic 7S globulin (LOC114377381) 전사체의 높은 수준의 축적을 확인하였다. 따라서 대두 종자 내 단백질 축적원으로서 매우 중요한 역할을 하는 basic 7S globulin에 대한 수분 스트레스 저항성 기능에 관한 추가적인 연구가 필요할 것이다.
Synaptotagmin (SYT)은 membrane trafficking과 관련된 소포 단백질 계열로 칼슘이온과 결합하는 C2 도메인을 통해 신경전달물질의 방출 및 호르몬 분비 조절에서 칼슘 센서로 기능을 하며 비생물적 스트레스에 관여한다고 알려져 있다(
Thomas et al. 1999,
Ruiz-Lopez et al. 2021,
Qian et al. 2022). 애기장대에서
SYT1이 결여된 돌연변이체가 염분, 동결, 삼투압 스트레스 및 기계적 손상과 같은 비생물적 스트레스에서 감수성으로 변화되는 것이 확인 되었다(
Ruiz-Lopez et al. 2021,
Strelau 2022,
Qian et al. 2022). 그러나 돌콩
Synaptotagmin-4-like (LOC114409690) 유전자의 경우 침수 스트레스 반응에 대하여 전사체 분석에서 반대로 down-regulation 되었으며 RT-PCR 분석 결과 다른 down-regulation된 유전자들과 다르게 대조군과 침수 처리 조건 간의 발현 차이가 나타나지 않았다.
Thomas et al. (1999)에 의하면 모든 SYT 단백질이 동일한 C2 도메인을 보유하지 않으며 일부는 칼슘이온과 결합하지 않는 C2A 도메인을 보유하고 있고 그중 SYT4 단백질이 포함 되어있다. 또한, 돌콩
Synaptotagmin- 4-like은 10개가 넘는 isoform 형태를 보유하고 있다. 따라서 RT-PCR 분석 결과 대조군과 큰 차이를 확인할 수 없던 이유로 많은 isoform에 대한 각각의 특이적 발현을 비교하는데 어려움이 있고 전사체 분석 결과 down-regulation된 결과의 경우 SYT4의 C2A 도메인의 칼슘이온 비결합이 비생물적 스트레스에서 up-regulation되는 다른
SYT과 다르게 반대되는 발현 패턴을 보여주는데 역할을 하였을 것으로 예상된다. BIC1은 광수용체 CRY를 조절하는 청색광 억제 조절 인자이며, brassinosteroid (BR) 식물 호르몬의 신호 전달 및 식물 성장을 촉진하는 전사 보조 인자로 기능을 하는 단백질이다(
Wang et al. 2016,
Yang et al. 2021). BIC1은 BR 억제제인 BZR1 전사인자와 상호작용해 BR을 활성화한다(
Yang et al. 2021). BR과 스트레스의 연관성은 주로 저온 스트레스에 초점을 두고 있다. 이에 대한 주요 기능으로 세포막의 안정성과 삼투압 조절 등이 있으며 일부 식물체에서는 가뭄 스트레스에서 외인성 BR 처리 시 저항성이 향상되는 것으로 확인되었다(
Clouse & Sasse 1998). 돌콩의 침수 조건에서 down-regulation은 가뭄 스트레스와 반대로 BR의 억제를 유도하기 위해 BIC1유전자인
protein BIC1-like (LOC114379367)의 발현이 감소되었을 가능성이 있을 수 있다.
Isoflavonoid는 대두 종자내에 약 0.3% 정도로 함유되어 있으며 특히 대두의 배축부(콩눈)에 많이 축적되는 기능성 물질로 식물의 성장과 발달 및 스트레스에 대한 방어 등 식물체 내에서 중요한 역할을 한다(
Dhaubhadel et al. 2003,
Alam et al. 2010). 스트레스에 대한 방어 기작으로써 Isoflavonoid 생합성은 다양한 생물적 또는 비생물적 스트레스의 자극에 의해 유도될 수 있다(
Dastmalchi et al. 2017). Isoflavonoid 생합성과 수분 스트레스와의 정확한 저항성 기작은 밝혀진 바가 없으나 대두에서 수분 스트레스와 isoflavonoid 생합성 유전자의 연관성이 지속적으로 제기되고 있다.
Alam et al. (2010)은 대두의 초기 생육 단계에서 수분 스트레스에 의해 isoflavone reductase homologue 1 단백질 축적이 유도되는 것을 확인하였다. 또한 침수 처리된 대두 잎에서 대부분의 isoflavonoid 생합성 경로 유전자의 발현이 증가하는 것으로 나타났다(
Chen et al. 2016). 돌콩의 KEGG 분석 결과에서 isoflavonoid 생합성 경로 유전자가 높은 수준으로 up-regulation되는 것으로 확인되었으며 그중
dirigent protein 1-like (
DIR, LOC114406806)은 isoflavone의 한 종류인 Diadzein의 생합성 유전자로 침수 처리에 의해 매우 높은 수준으로 발현되었다(
Figs. 5,
6,
Supplementary Table 1).
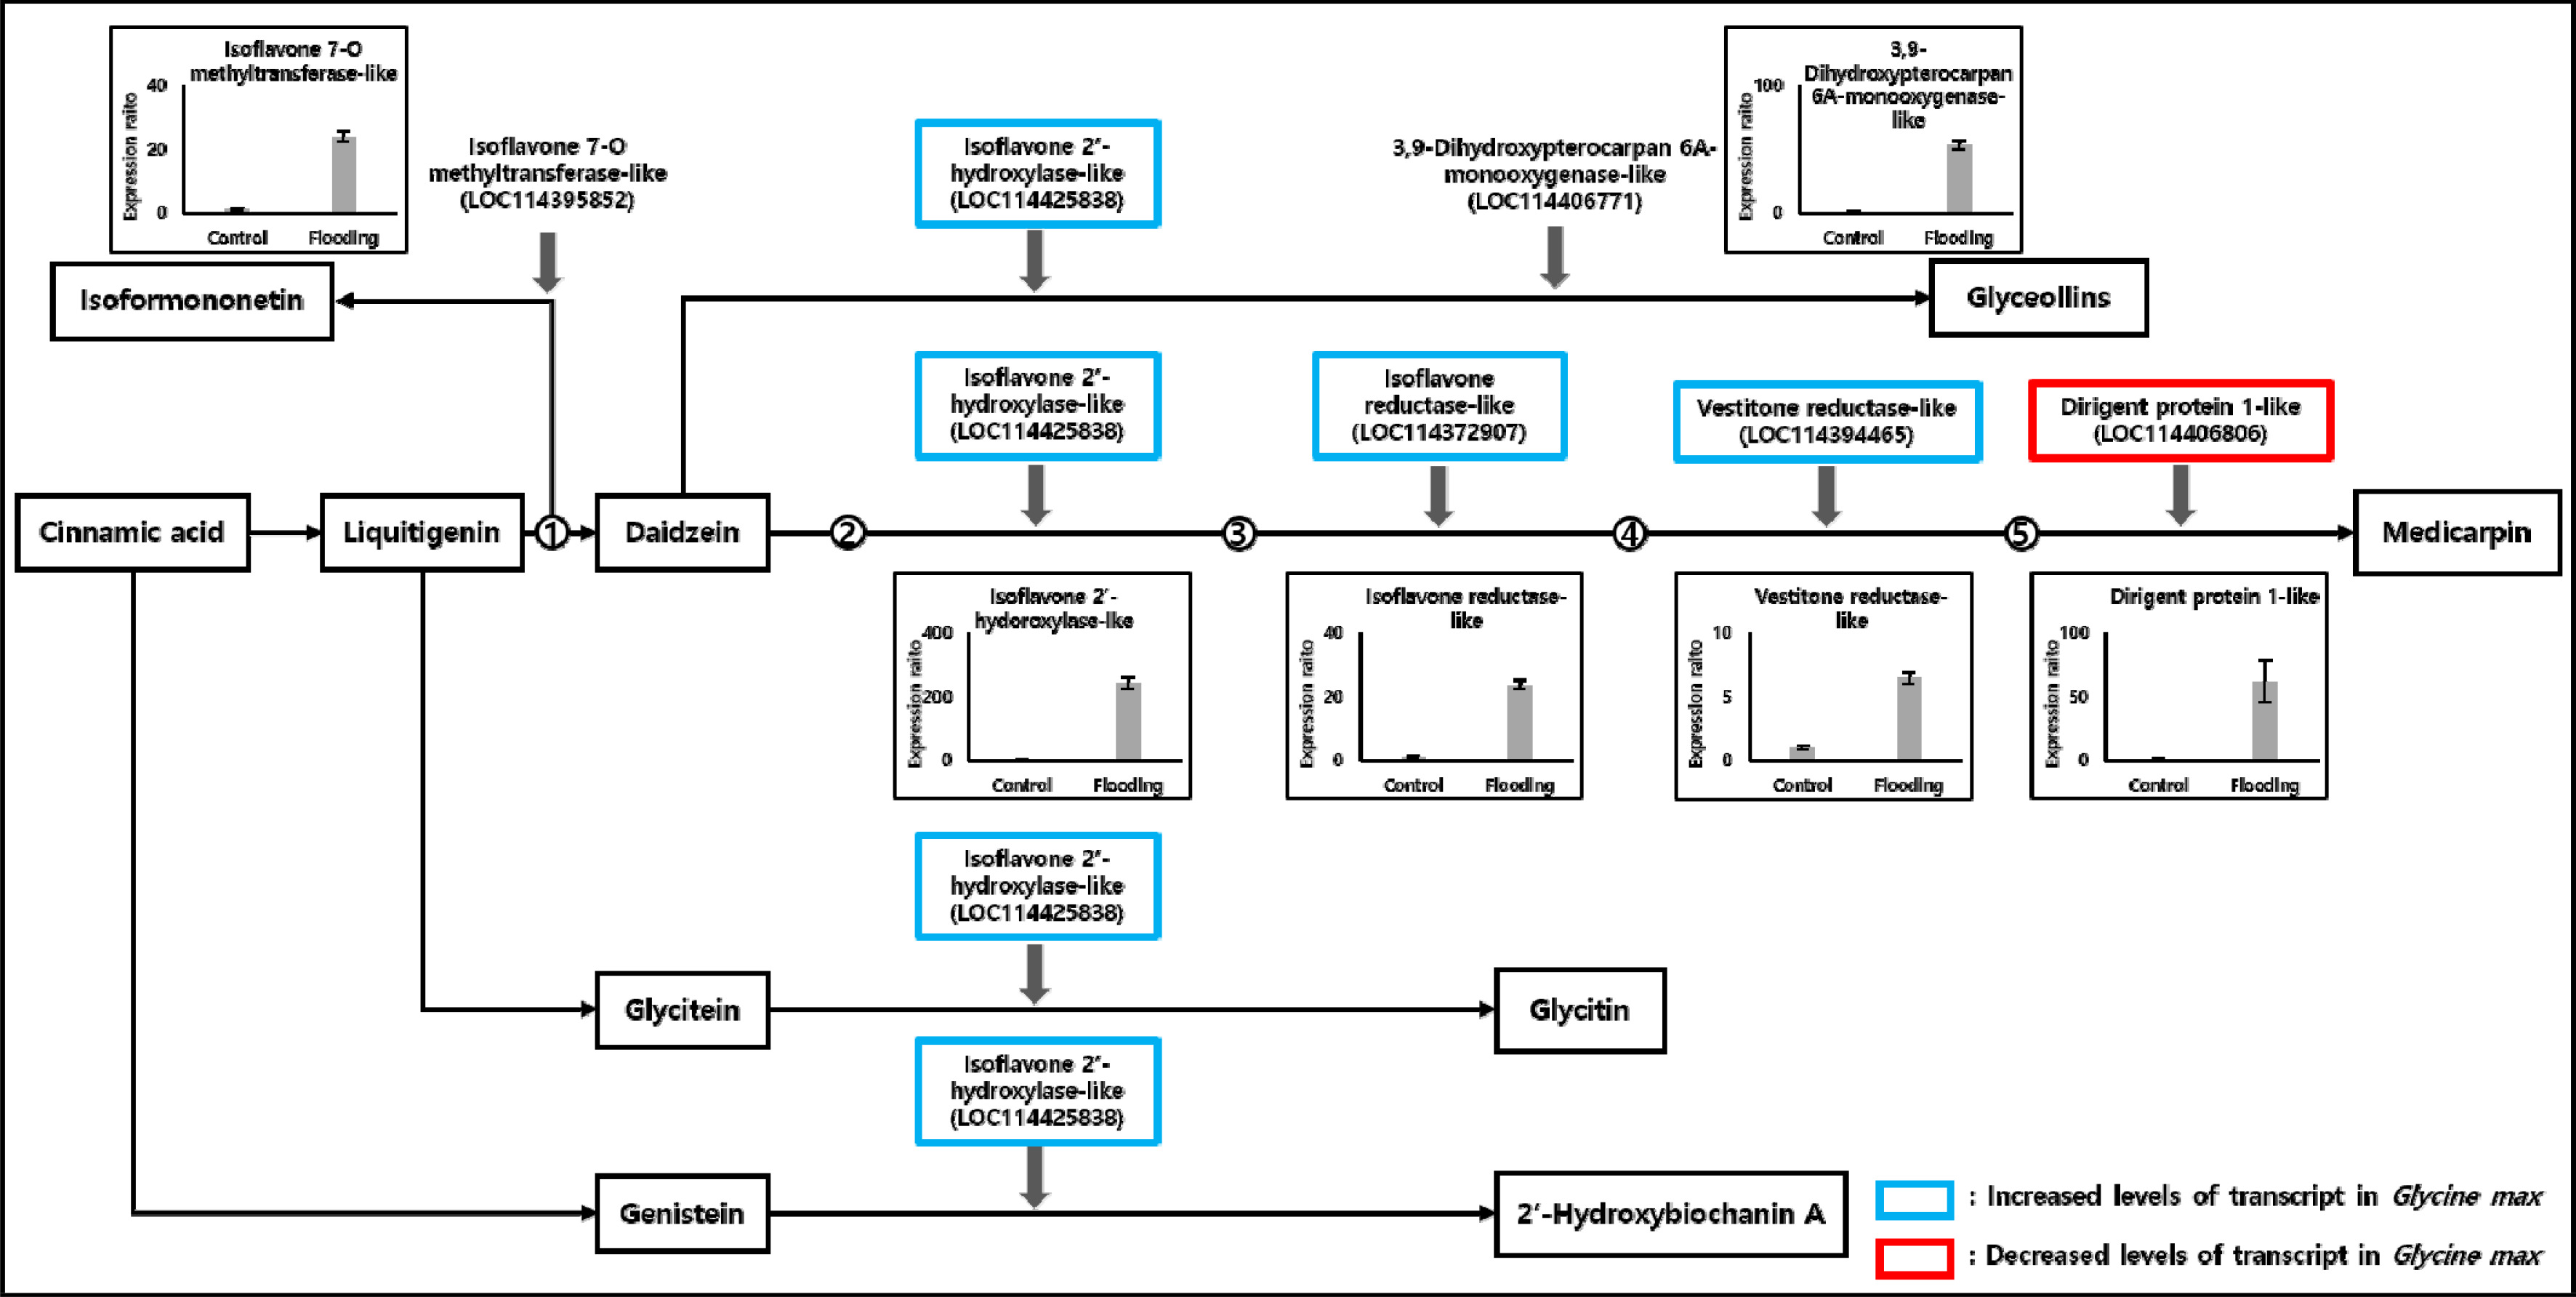
DIR 유전자를 포함하여 선발된 DEGs 내에 존재하는 isoflavonoid 생합성 유전자의 발현을 모두 스크리닝한 결과 isoflavonoid 생합성 경로 유전자군은 up-regulation되었음을 확인할 수 있었다(
Table 4). 특히 isoflavone 산물에서 공통적으로 생합성에 관여하는
isoflavone 2'-hydroxylase-like (LOC114425838) 유전자를 제외하면 daidzein 경로 유전자가 유일하게 확인되었다(
Fig. 7). Daidzein은 비배당체 isoflavone으로 다양한 건강 기능성 물질로 활용되며 다양한 스트레스에 의해 반응하는 것으로 알려져 있다(
Kim & Kim 1994,
Lee et al. 2005,
Chen et al. 2016).
Chen et al. (2016)에 의하면 대두 잎에서 대부분의 Daidzein 경로 유전자의 발현이 수분 스트레스에 의해 up-regulation되는 것으로 밝혀졌으나 흥미롭게도 돌콩에서 가장 높게 up-regulation되었던
DIR 유전자의 경우 대두에서는 반대로 down-regulation 되었다. 또한 단백질 수준에서도 일반 대두에서 침수 처리되었을 경우 disease resistance responsive (dirigent like protein) family protein의 축적이 감소하였으며 회복 기간에 다시 증가하였다(
Wang et al. 2016). 추가적으로 DIR 단백질은 식물의 두 리그놀 분자의 페녹시 라디칼 커플링 반응을 매개로 하여 리그난과 리그닌 생성하는 식물 2차 대사에 중요한 역할을 하며(
Ralph et al. 2007,
Arasan et al. 2013), 수분 및 저온 스트레스에 노출되거나 ABA에 반응하여 리그닌화 수준의 조절에 관여한다(
Paniagua et al. 2017).
Wu et al. (2009)에 따르면, 건조한 환경에서 살아남을 수 있어 부활 식물이라 불리는
Boea hygrometrica에서
BhDIR1이 식물 탈수 상태에서의 변화, 외인성 식물 호르몬, 신호 물질, 온도 변화에 반응하여 축적되는 것이 확인되었다. 수분 스트레스 중 침수 환경과의 연관성에 대해 밝혀진 바가 아직까지 없으나 수분 스트레스 관련하여 식물 세포벽의 리그닌 형성을 조절하여 기계적인 강도와 유연성에 영향을 주어 침수 조건에서도 up-regulation되었을 가능성이 있다. 따라서
dirigent protein 1-like 유전자가 돌콩에서 수분 스트레스에 대한 저항성 형질을 부여하기 위한 핵심적인 기능을 할 수 있음을 시사한다. 이에 대하여 추후 일반 대두 품종과의 비교 분석을 통한 후속 연구를 진행하게 된다면 육종적 이용 가치를 이끌어 낼 것이며 대두 수분 스트레스 저항성 신품종 개발에 기여할 것으로 사료된다.
적 요
본 연구는 재배종인 대두의 기원종으로 알려진 돌콩(Glycine soja)을 대상으로 하여 대량 전사체 분석을 통해 침수 스트레스 하에서 변화하는 유전자의 발현을 프로파일링 하였다. 최근 공개된 돌콩 reference sequence를 통해 mapping된 116,361,207 개의 reads를 활용하여 유전자 기능 주석 및 DEGs 분석을 수행하였다. 선발된 DEGs에 대한 GO 및 KEGG 분석으로 통기조직 형성을 위한 에틸렌 반응, 세포벽 및 세포막 등의 발달과 신호 물질 전달, 호르몬 신호 전달 등 다양한 수분 스트레스와 연관된 유전자들이 주로 나타나는 것을 확인하였다. Up- 및 down-regulation된 상위 DEGs를 선발하여 추가적인 유전자 발현 검정을 수행한 결과 대량 전사체 분석 결과와 대부분 유사한 결과를 보여주었다. 이 중 몇몇 유전자는 수분 스트레스에서 중요한 기능을 하는 것으로 알려져 있었으며 특히 혐기성 조건에서의 알코올 발효를 촉매 하는 Alcohol dehydrogenase 1-like, 세포 팽창과 관련한 Expansin-like B1, Expansin-A7-like 및 GST 유전자 등을 확인 하였다. 특히 대두에서 수분 스트레스에 의해 전사체 및 단백질체의 수준에서 모두 감소하는 것으로 알려진 dirigent protein 1-like 유전자가 돌콩에서는 매우 높게 up-regulation 되었다. 이는 돌콩의 수분 스트레스 저항성에 핵심적인 신규 형질로서 추가적인 연구가 필요할 것으로 사료된다. 본 연구 결과는 야생형 콩인 돌콩에서 수분 스트레스 저항성을 조절하는 다양한 유용 유전자 및 메커니즘에 대한 정보를 제공할 것이며 재배종인 대두에 저항성 신품종 육성을 위한 기초 자료로 활용되어 유전적 다양성을 제공하는데 기여할 것으로 사료된다.
보충자료
사 사
본 연구는 산림청 산하 한국임업진흥원의 다부처 국가 생명연구 자원 선진화 사업(2021400A00-2225-CA02)의 지원으로 수행되었음.
Fig. 1Flooding stress treatment process in Glycine soja. Sampled by flooding treatment for 7 days.
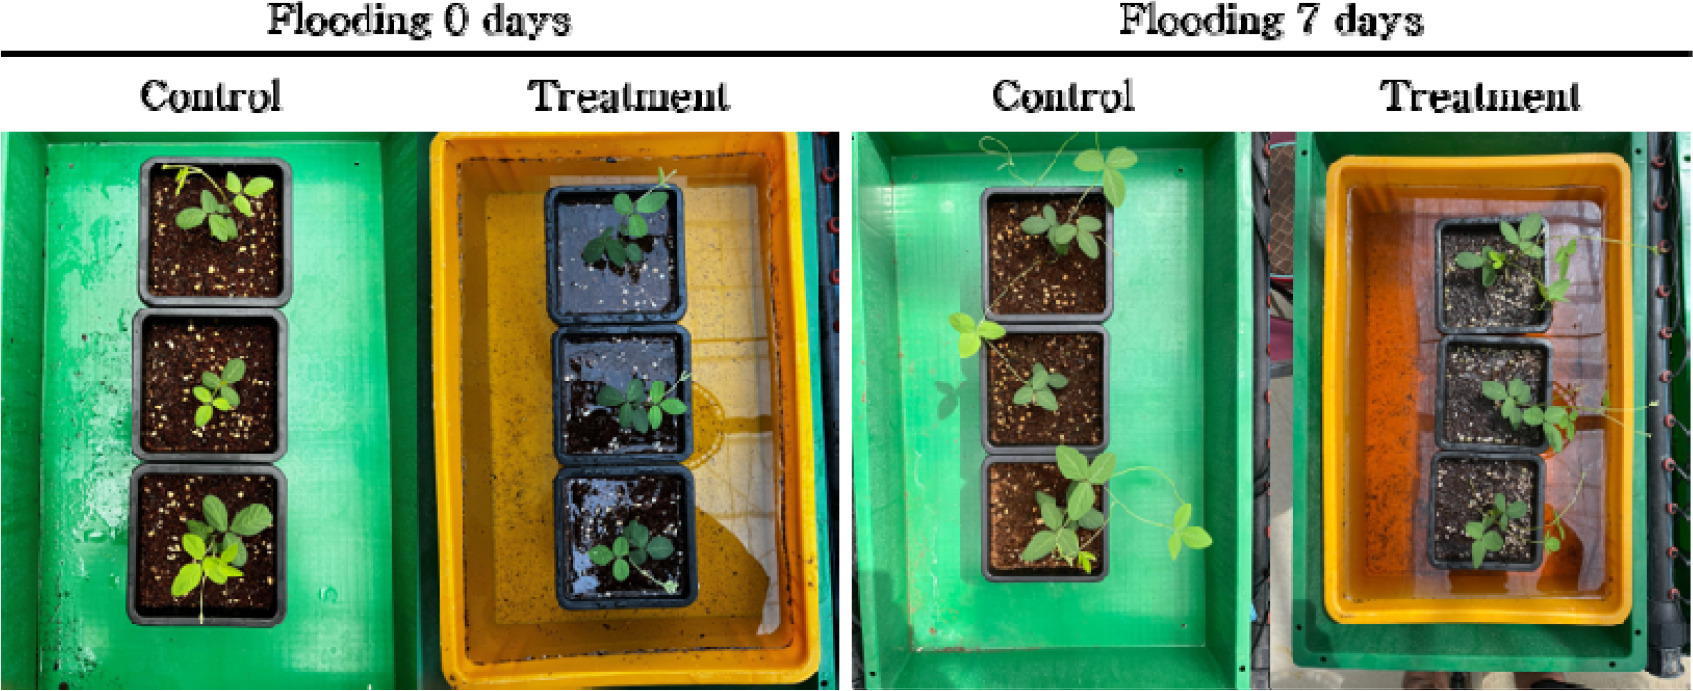
Fig. 2Scatter Plot and Volcano Plot for FPKM under G. Soja flooding treatment. (A) A Scatter Plot of log10 (FPKM) in control and flooding stress samples is shown. Most genes (dots) should follow the x=y line. Based on the x=y line, the upper red dot indicates up-regulation, the lower blue dot indicates down-regulation, and the gray dot indicates no expression difference. (B) Volcano Plot mean shows Fold-change versus significance for each gene between control and flooding stress. Visualize statistical significance (p-value) on the y-axis versus the magnitude of change (fold change) on the x-axis.
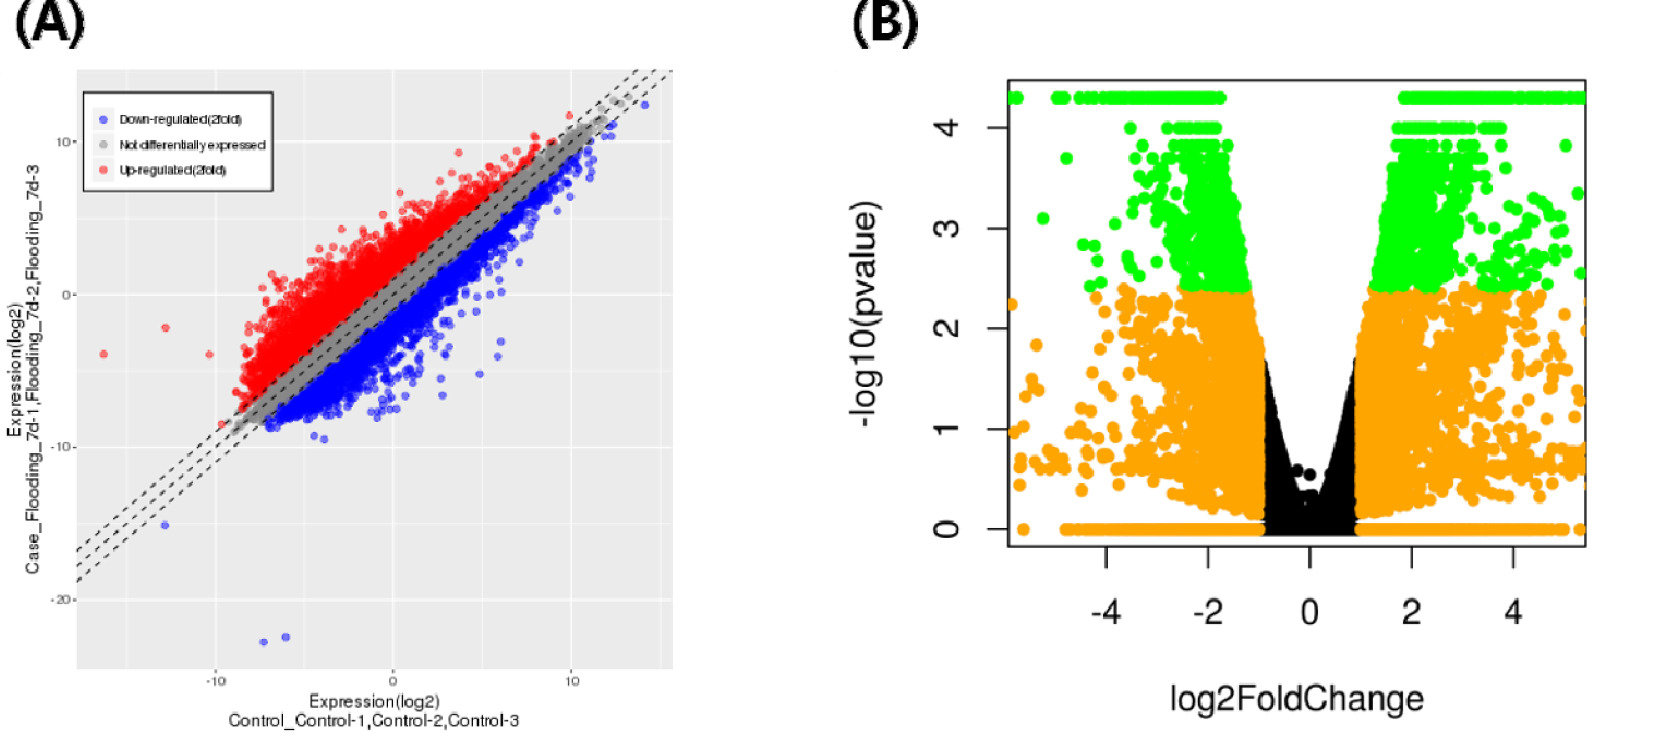
Fig. 3Heatmap visualized expression patterns for DEGs with Log2FC<│2│ & FDR<0.05 under flooding stress at 7 days. Red means up-regulation and blue means down-regulation.
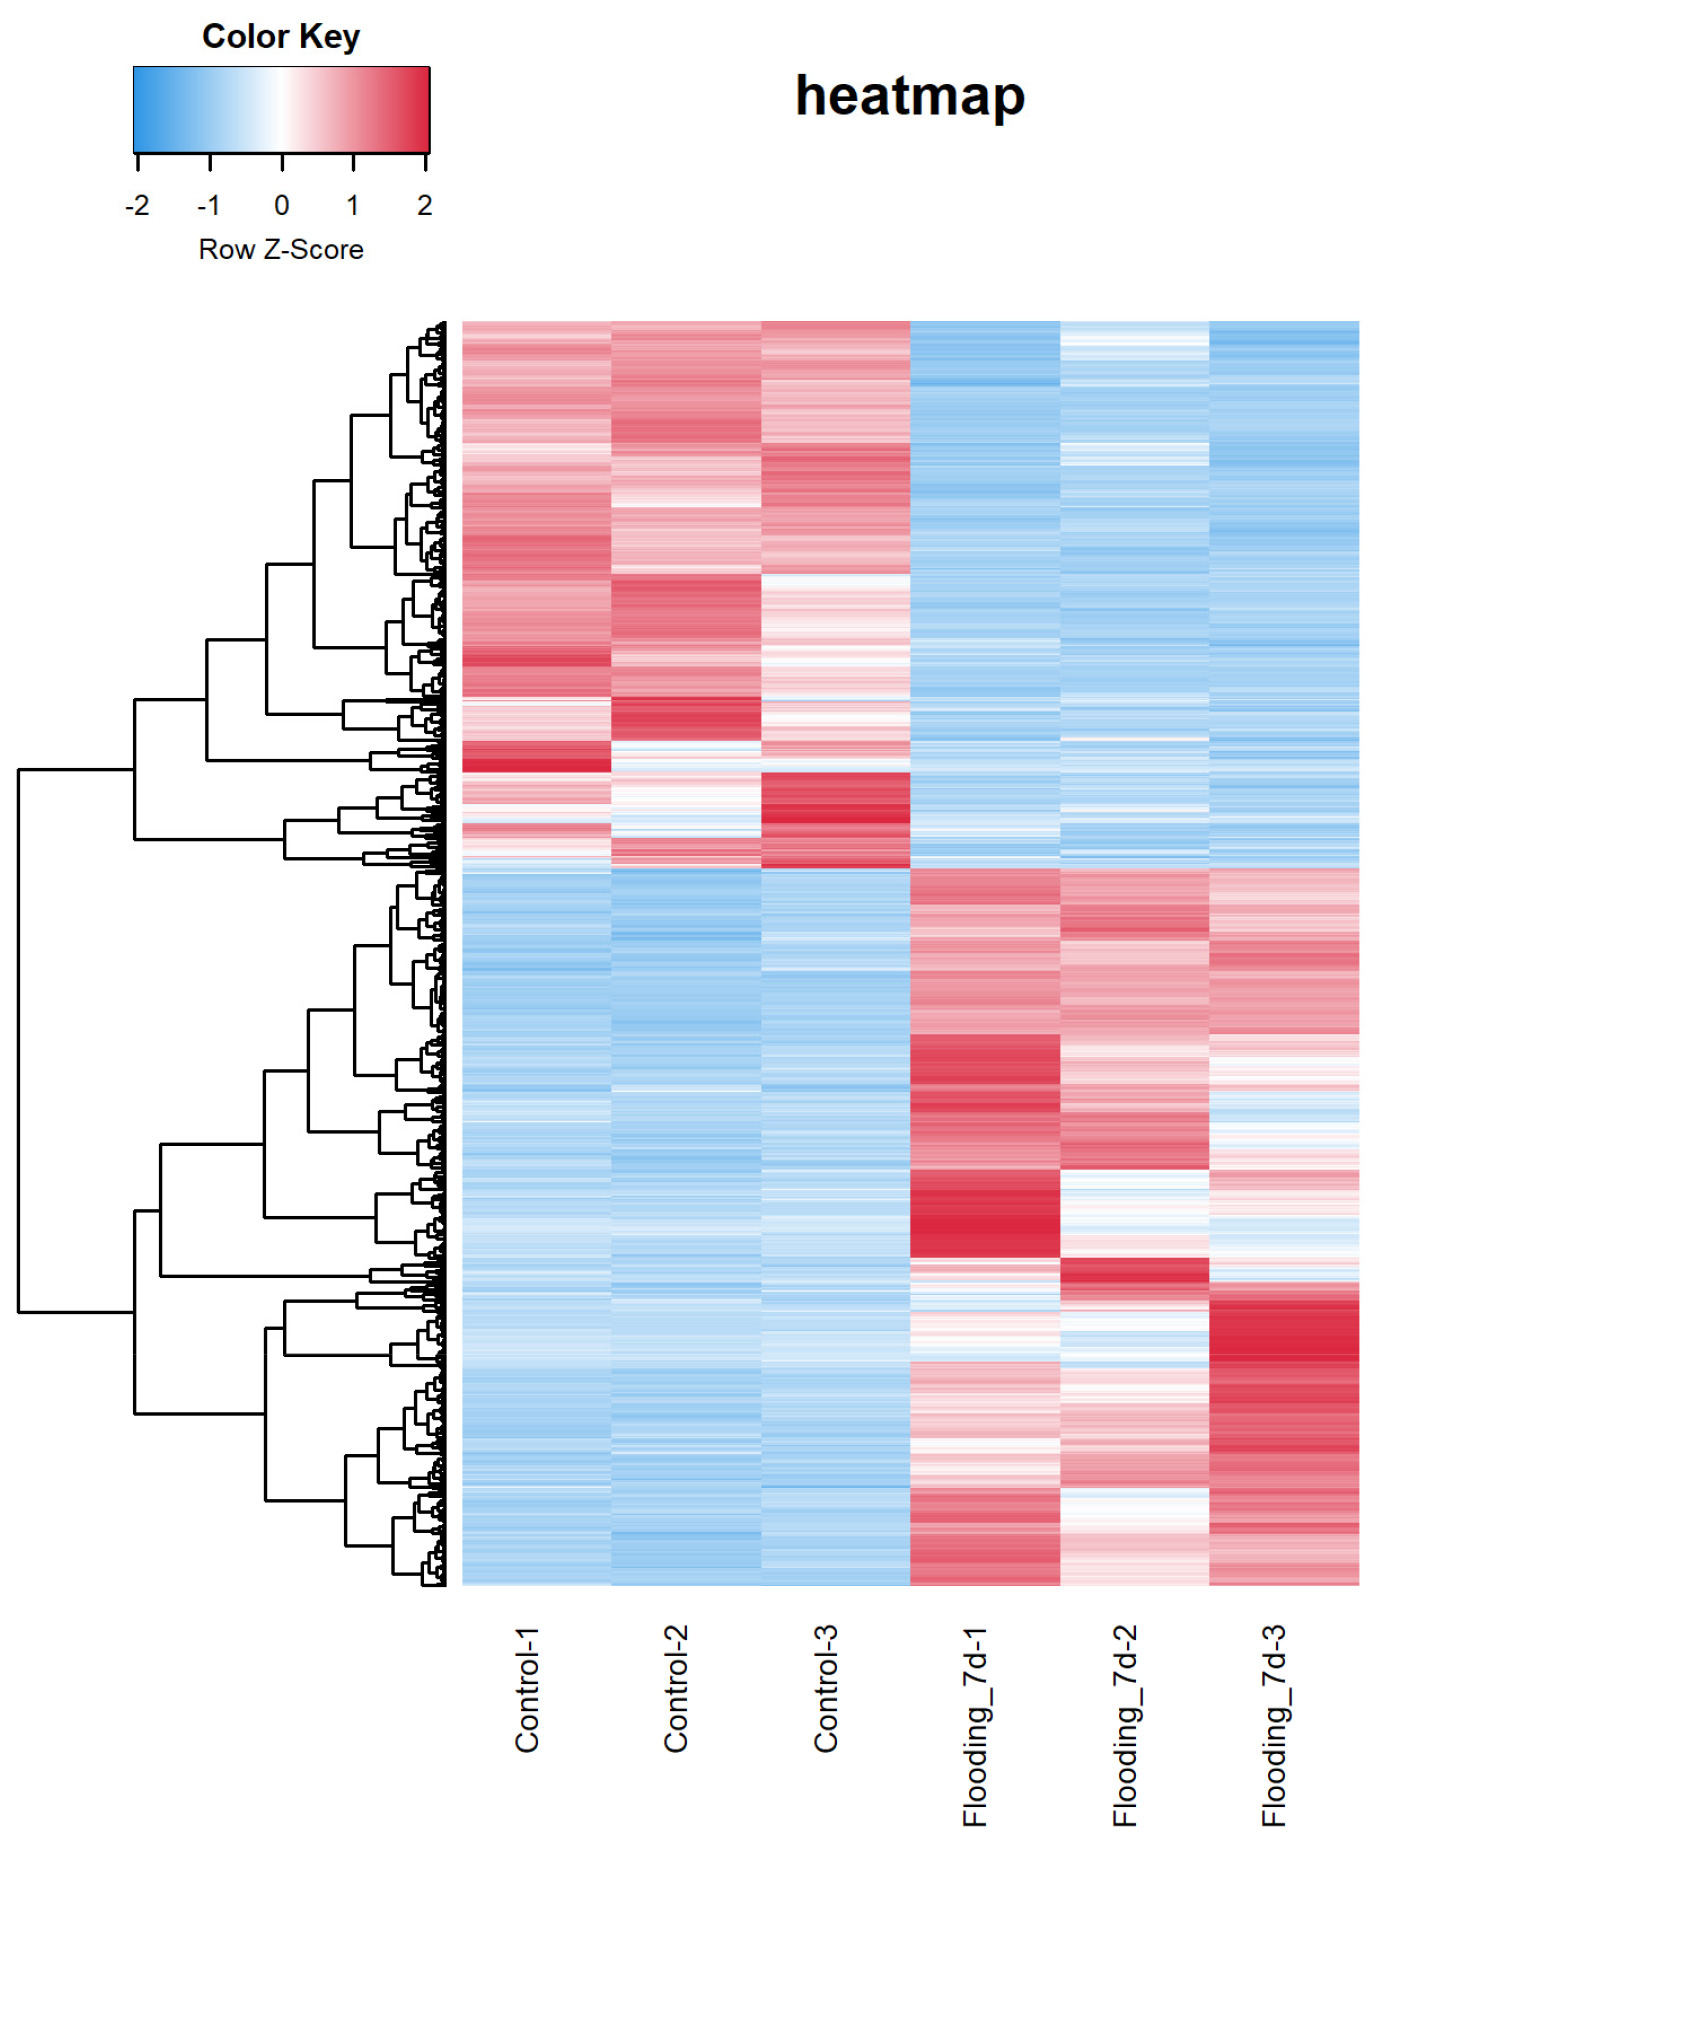
Fig. 4Gene ontology (GO) analysis for differentially expressed genes flooding stress treatments. GO analysis is divided in to three categories: Biological process (BP), Cellular component (CC), and Molecular function (MF). (A) GO analysis results for up-regulated DEGs. (B) GO analysis results for down-regulated DEGs.
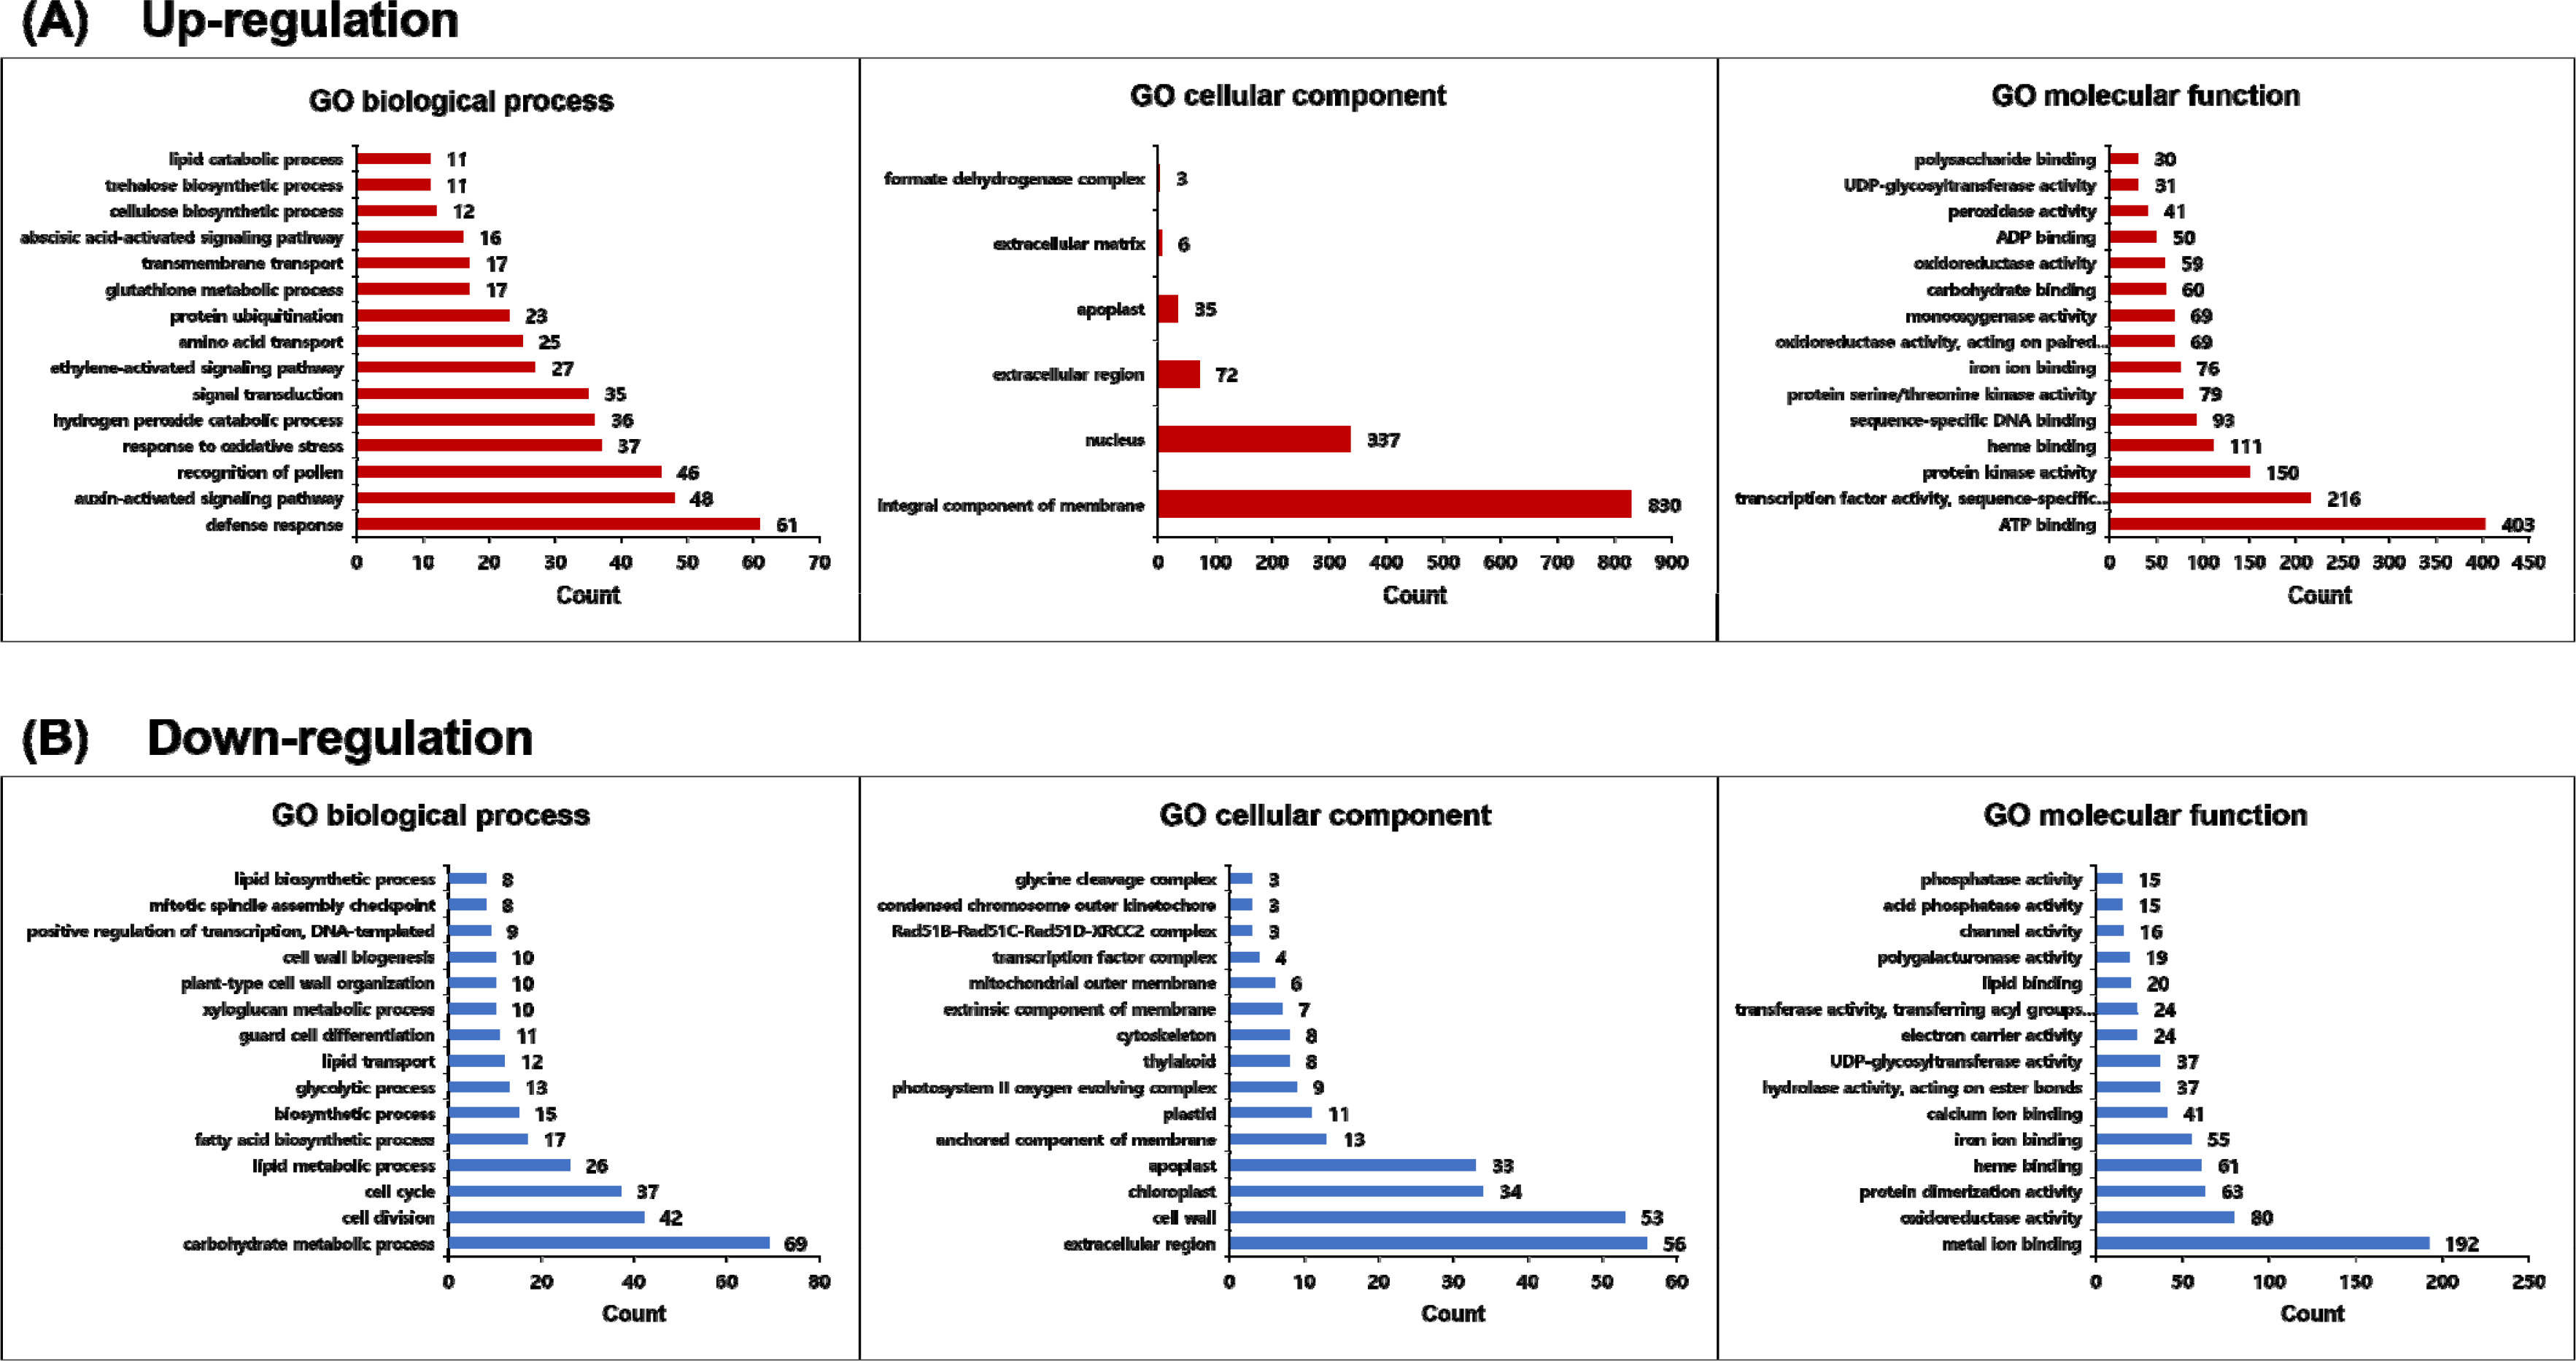
Fig. 5Kyoto encyclopedia of genes and genomes (KEGG) pathway analysis for differentially expressed genes flooding stress treatments. The analysis results were divided into up-regulation and down-regulation.
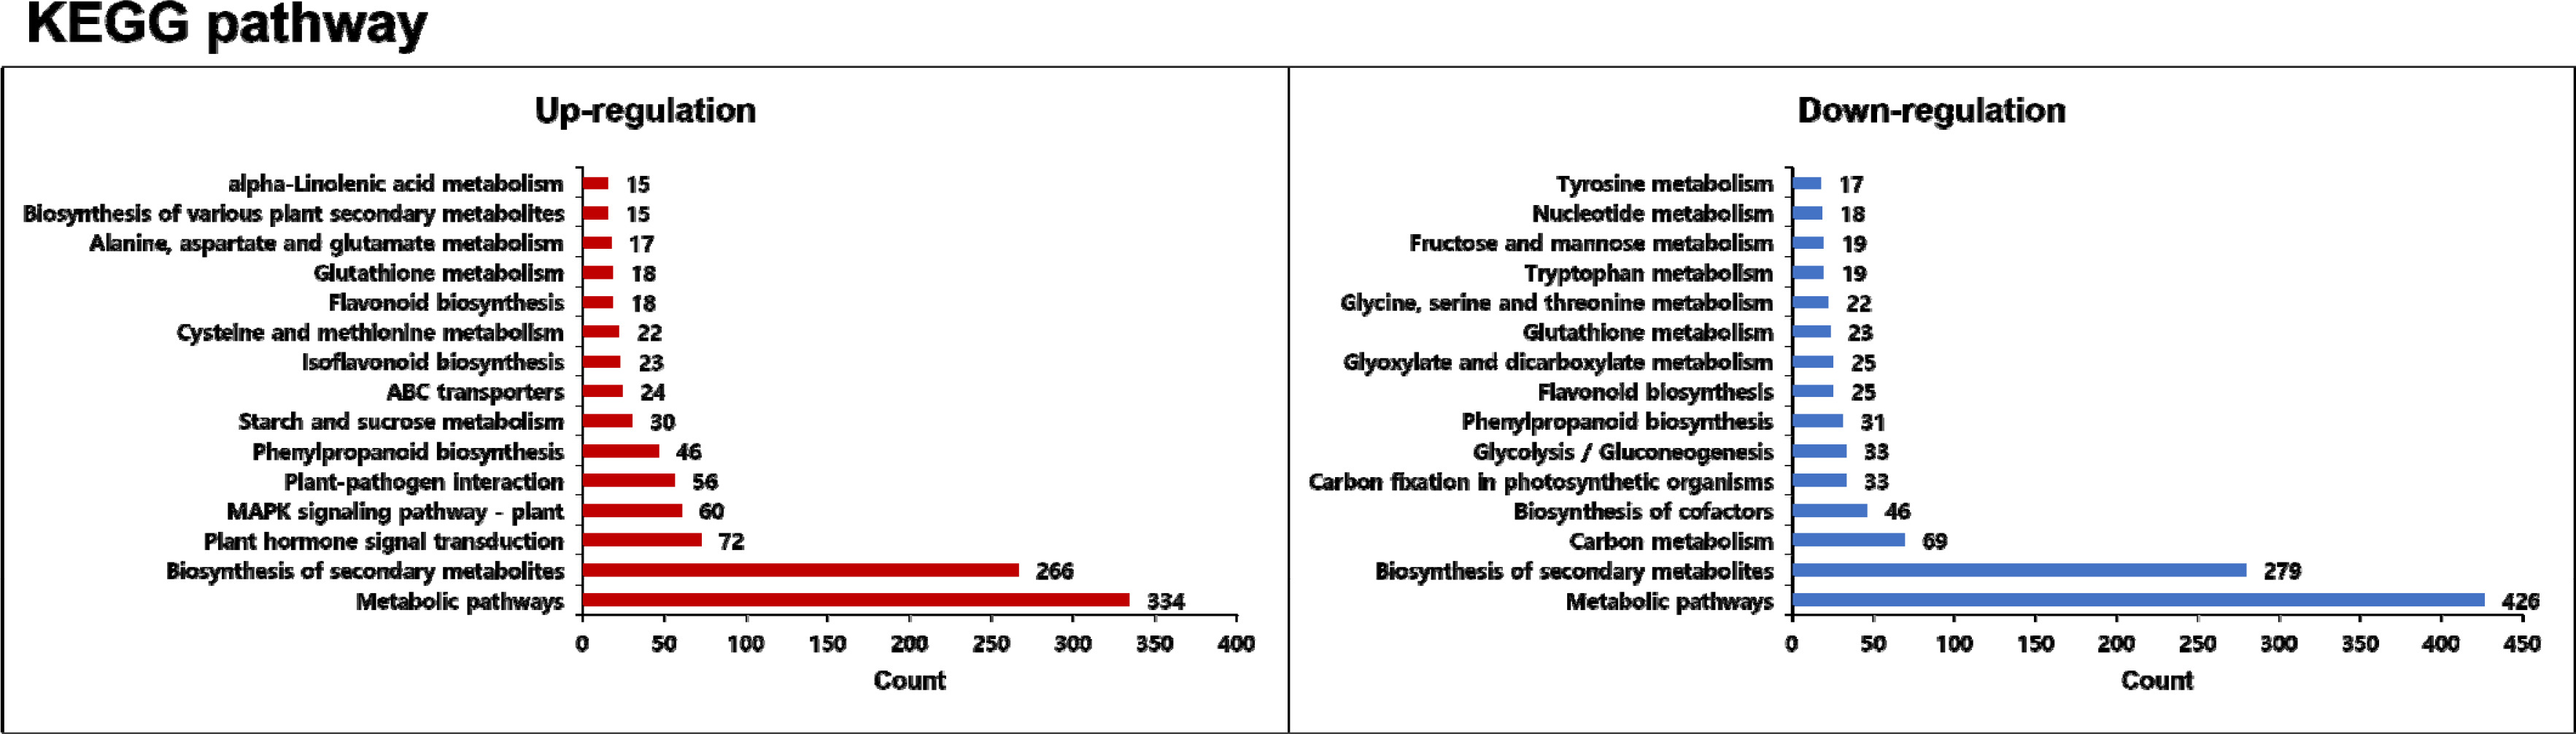
Fig. 6Results of qRT-PCR analysis of candidate DEGs that were differentially expressed under flooding stress in RNA-seq results. (A) Candidate DEGs showing the highest expression in flooding stress. (B) Candidate DEGs showing the lowest expression in flooding stress.
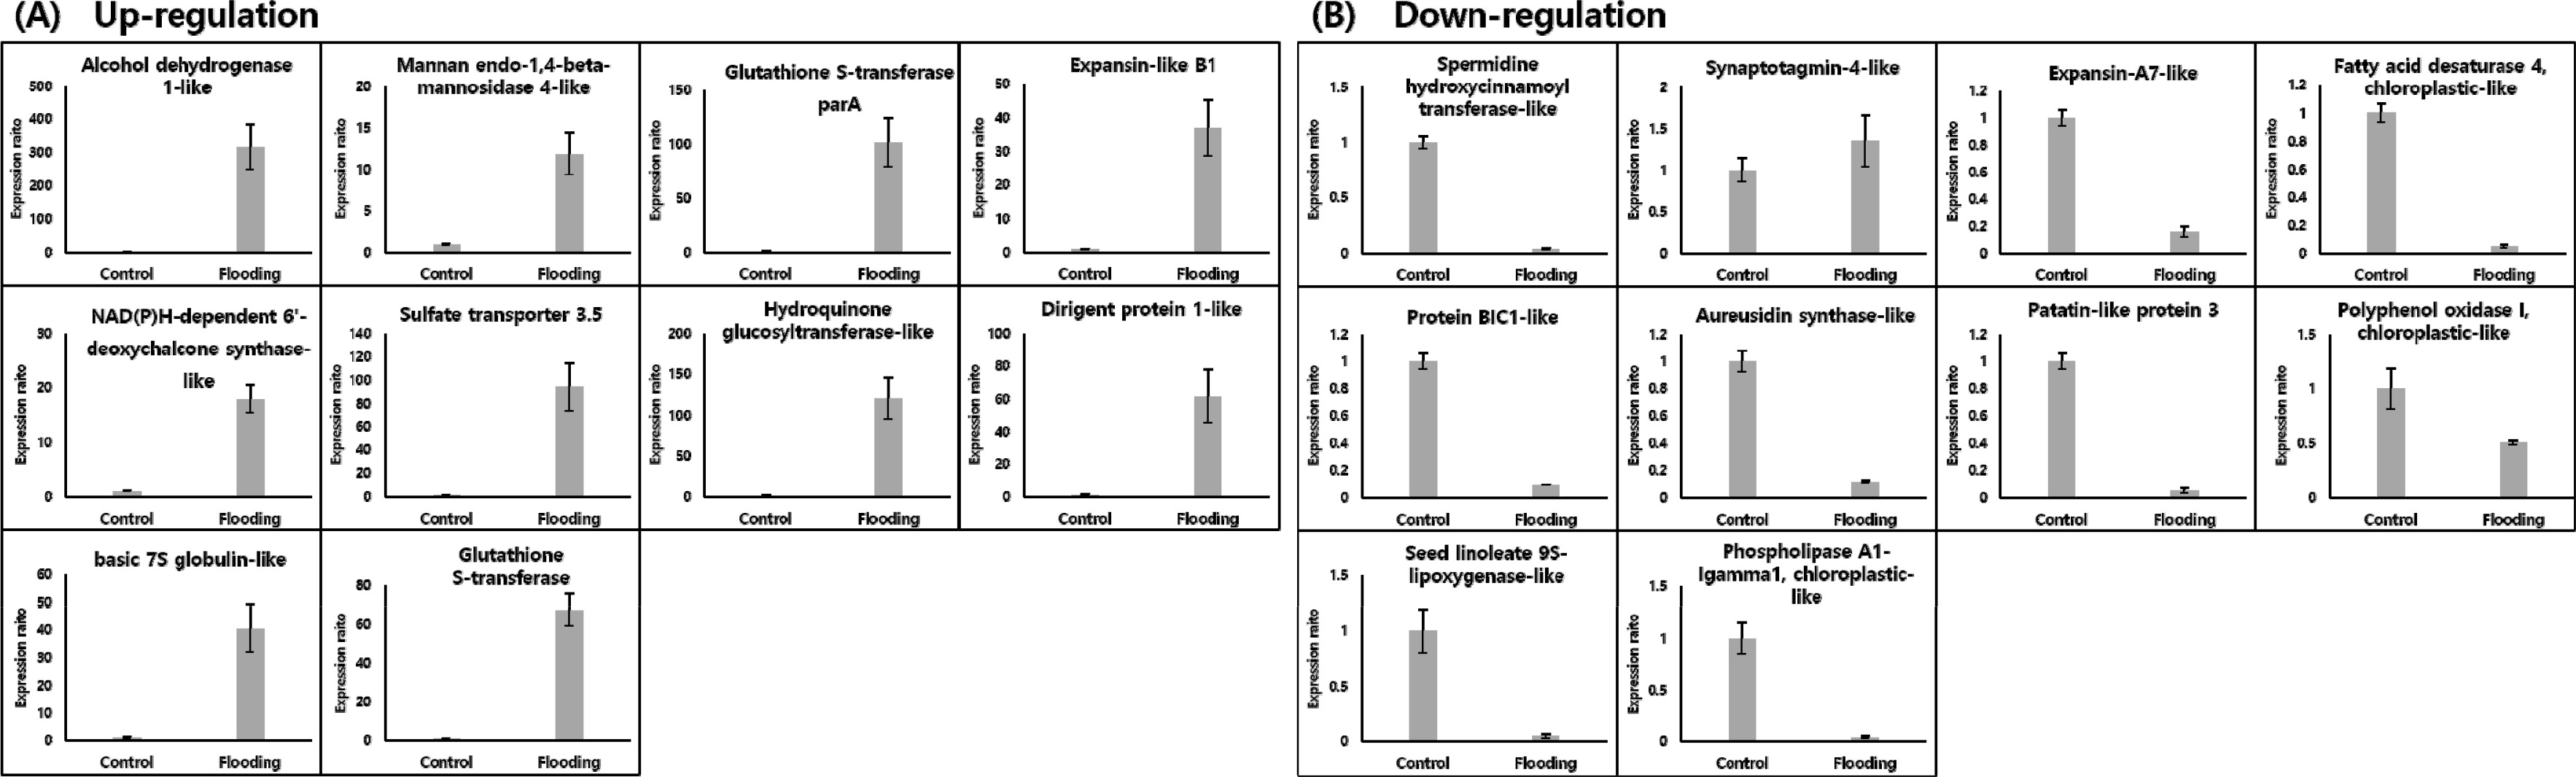
Fig. 7Isoflavonoid biosynthesis pathway and related DEGs under flooding stress in
Glycine soja. The expression of selected isoflavonoid biosynthesis pathway DEGs genes were upregulated by qRT-PCR analysis. The expression levels of isoflavonoid biosynthesis pathway in
Glycine max described by
Chen et al. (2016) were represented blue and red color box. The open circles indicated intermediates during isoflavonoid biosynthesis pathway. Blue box: Genes up-regulated by flooding stress in
Glycine max. Red box: Genes down-regulated by flooding stress in
Glycine max. Open circle 1: 2,7,4'-Trihydroxyisoflavanone, 2: Formononetin, 3: 2'-Hydroxyformononetin, 4: Vestitone, 5: 7,2'-Dihydroxy-4'-methoxy-isoflavanol.
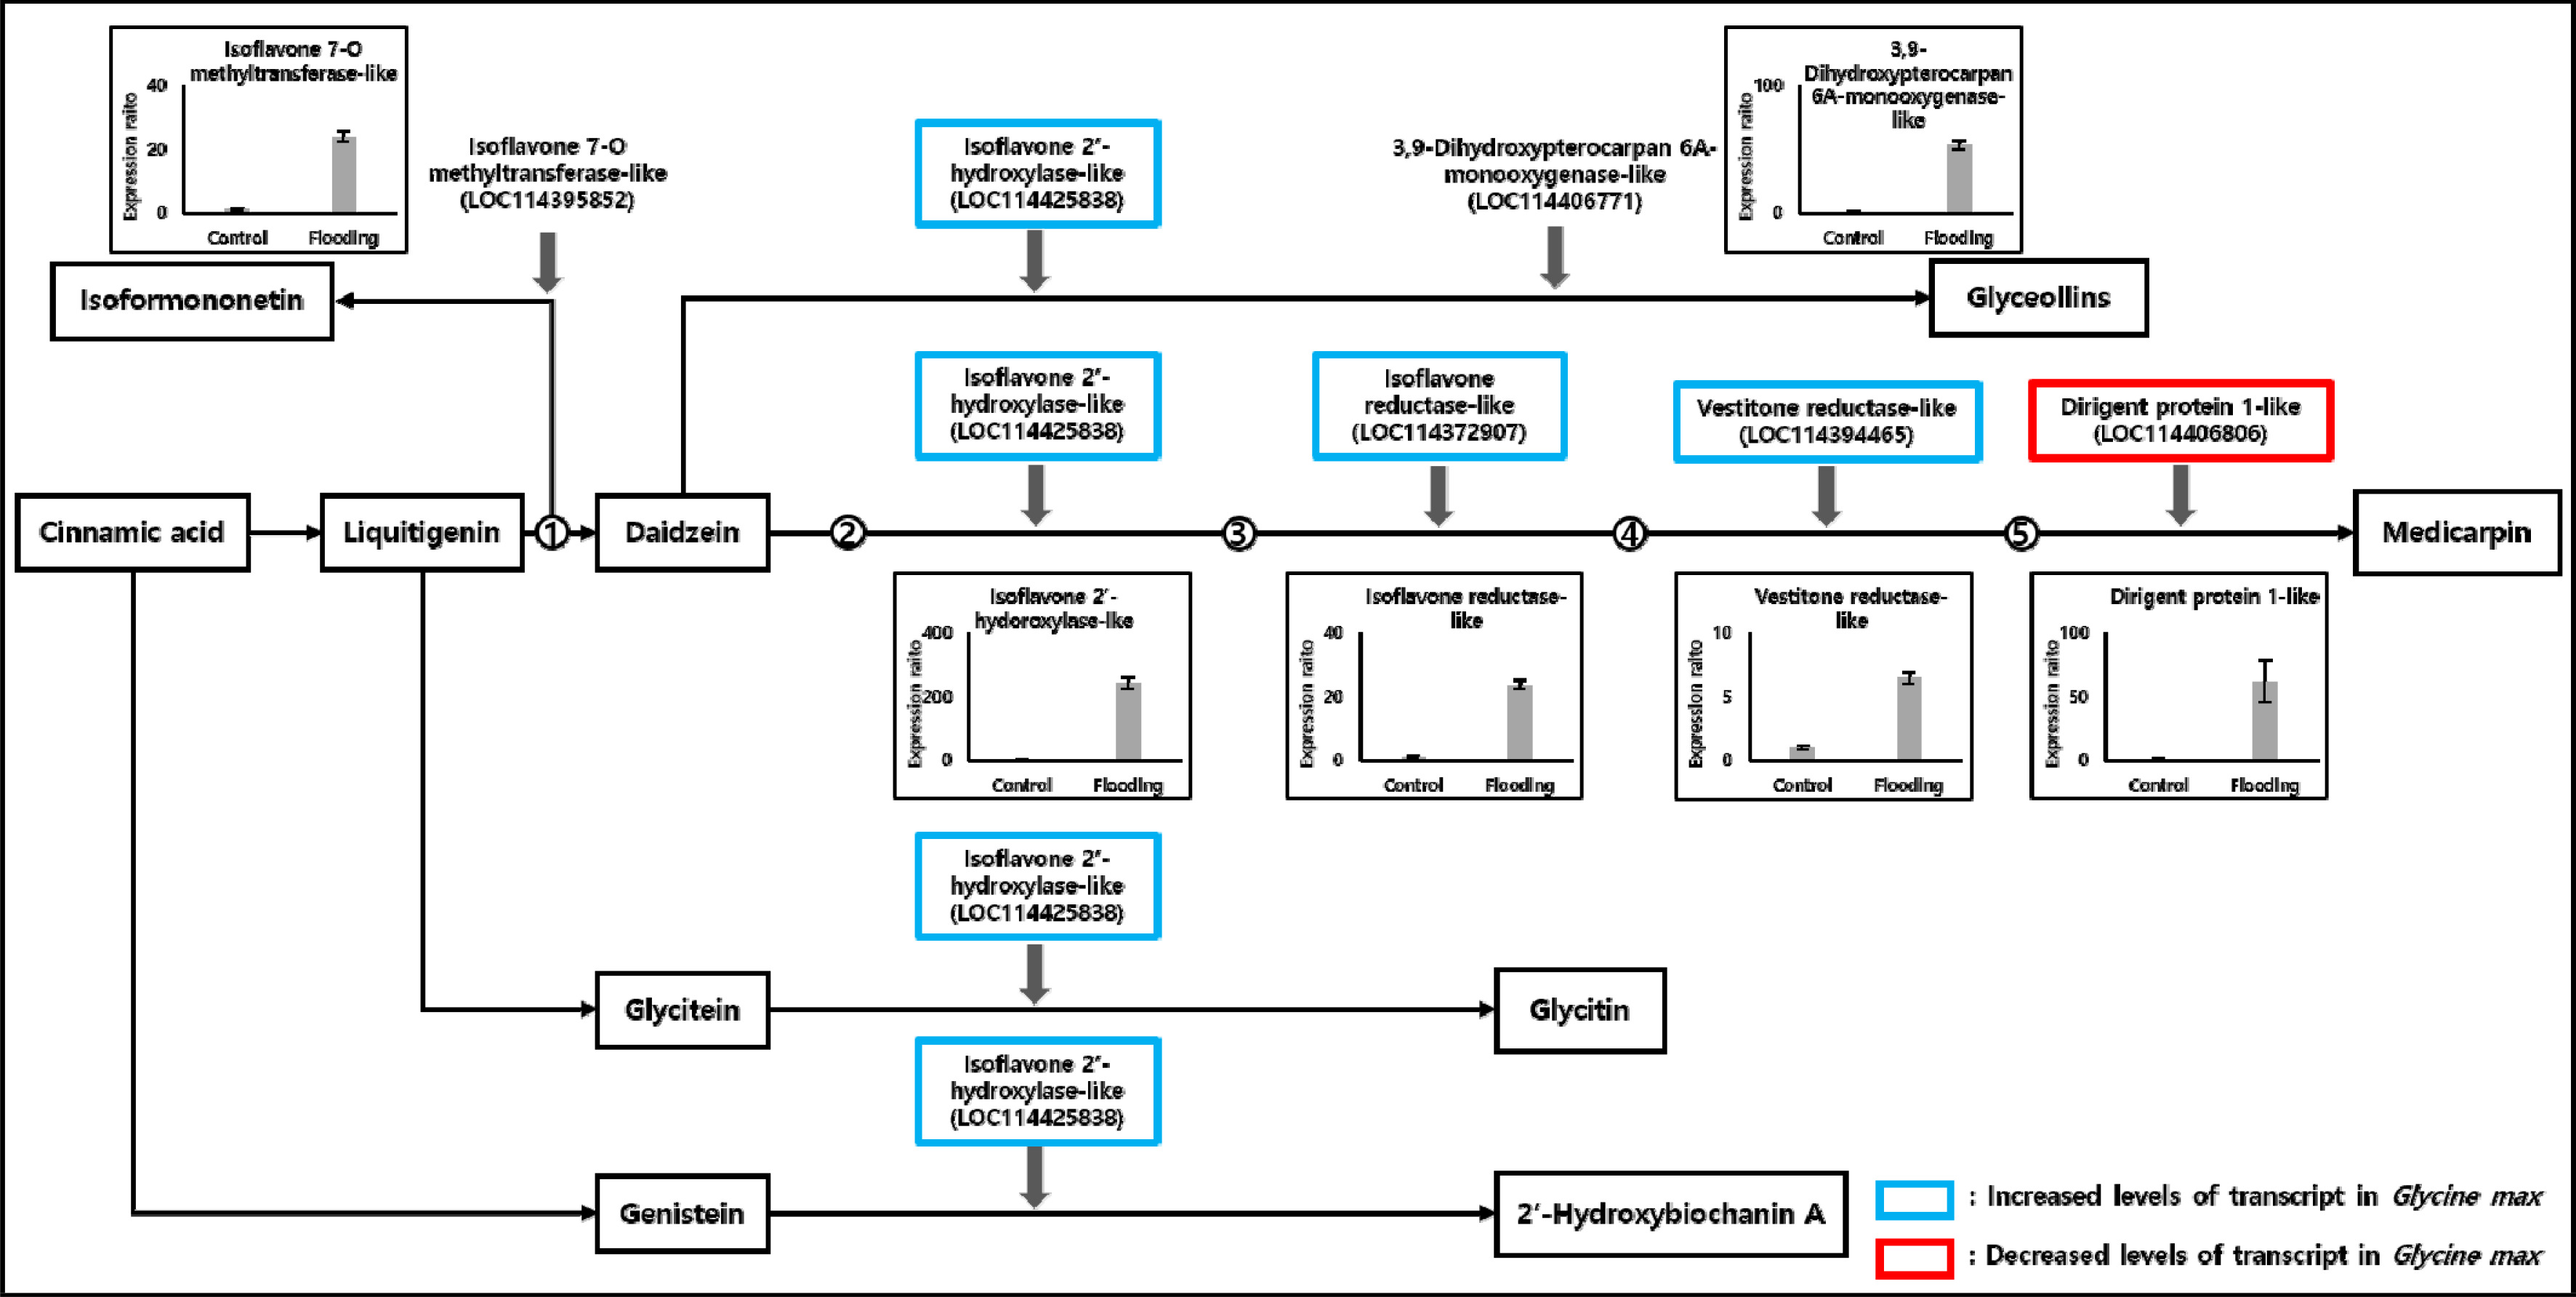
Table 1Sequencing alignment summary by flooding stress treatment in Glycine soja.
Table 1
|
Sample |
Reads |
Mapped_Reads |
Mapping_Rate (%) |
|
Gs_control_1 |
67,763,120 |
59,486,488 |
87.7859 |
|
Gs_control_2 |
65,338,430 |
57,827,267 |
88.5042 |
|
Gs_control_3 |
55,353,494 |
48,737,948 |
88.0485 |
|
Gs_Flooding_7d_1 |
74,452,780 |
59,355,801 |
79.7227 |
|
Gs_Flooding_7d_2 |
68,524,766 |
55,813,177 |
81.4496 |
|
Gs_Flooding_7d_3 |
85,991,296 |
67,862,940 |
78.9184 |
|
Average |
69,570,648 |
58,180,604 |
84.07155 |
Table 2The summary of differentially expressed genes under flooding stress in Glycine soja.
Table 2
|
Sample |
Differentially expressed genes (DEGs)
log2FC<│2│ & FDR<0.05 filtering |
|
Up-regulation |
Down-regulation |
Total |
|
Flooding 7days |
574 |
242 |
816 |
Table 3Descriptions of candidate DEGs and primer design for qRT-PCR.
Table 3
|
Gene description |
Forward (5'→3') |
Reverse (5'→3') |
log2FC |
|
Up-regulation
|
|
Alcohol dehydrogenase 1-like |
TCG TTG GAA CCT CCA CTT TC |
GGC TTT GGT TTT GCA ACA TT |
7.17833311 |
|
Mannan endo-1,4-beta-mannosidase 4-like, transcript variant X1 |
AAG CTG CTC AGG TTG CAT TT |
CAC AGG GTC CCC CAC TAC TA |
6.281064195 |
|
Probable glutathione S-transferase parA |
AAA ACC CAT CTG CGA ATC AC |
CCC TGT CCA TAC CCT CTT CA |
5.971491166 |
|
Expansin-like B1 |
CAT ACA CCG GCA ATG TCT TG |
CGG TGG GTT AGG AAA GTC AAA |
5.806982622 |
|
NAD(P)H-dependent 6'-deoxychalcone synthase-like |
TTG CAT GGC AAC AGA AGA AG |
TCA CCT GGG CTA TGG ATT TC |
5.716228923 |
|
Probable sulfate transporter 3.5 |
GAG TGG CTC CCC ACT TAC AA |
GGT GGG ACA AAG CTG GAA TA |
5.367451738 |
|
Hydroquinone glucosyltransferase-like |
ACG AGG ATG GCA TAG TGG AG |
CAG TGA CGA GCC AAT TGA GA |
5.325230305 |
|
Dirigent protein 1-like |
TTC ACT TTC GGG CTA TTT GC |
GAA GAA GTG GAG GTG GGT GA |
5.26712416 |
|
Basic 7S globulin-like |
CTT GCA TCG GCA AAT AAG GT |
CAC CTG TGG AAA CGT TGT TG |
5.257689149 |
|
Probable glutathione S-transferase |
CTT CCT GCT GAT CCC TAC GA |
AAC CCT GAG ATG CTC CCA TA |
5.09734214 |
|
Serine carboxypeptidase-like |
ACC CCT TCT TAC AGC GGT TT |
ATC CTC AGC GGA TCT CAC TT |
5.041953084 |
|
Down-regulation
|
|
Spermidine hydroxycinnamoyl transferase-like |
CAG GGA ATC CGA ATC TTC AA |
TGG AAG TGC ATG GAC ACA AT |
-5.758672576 |
|
Synaptotagmin-4-like, transcript variant X7 |
CCA AAG CCC AGG ATT GAT TA |
GAA TGC CAC CAA GTT GAA CC |
-5.747624642 |
|
Expansin-A7-like |
ATG TGG GTG AAA GGA AGC AG |
CCA ATT GGA AGG AGC AAC AT |
-5.24273022 |
|
Fatty acid desaturase 4, chloroplastic-like |
CAA TCC CAA TTG TTG GAA CC |
TAG GGT CAT GGC AAA GAA GG |
-4.966331982 |
|
Protein BIC1-like |
CAC AAG ATC GGG AGA AAG GA |
CTT GCA CAC CTT GCA TGT TT |
-4.87091734 |
|
Aureusidin synthase-like |
AAA GCC CTC CTT CAC TTT CC |
TCT CCA TGG TCA CCT CTT CC |
-4.820102047 |
|
Patatin-like protein 3 |
ATT TGA GTG GTC CGG ATG AG |
ATT ATG GCA TCC CCT TTT CC |
-4.784098548 |
|
Polyphenol oxidase I, chloroplastic-like |
GGC ATT ATT CCT GCG ACT GT |
TAG ATG AGT TTG GGG CTG CT |
-4.525666369 |
|
Seed linoleate 9S-lipoxygenase-like |
TCC CAT TTT CTT TGC TCA CC |
TCG AGG CAG TCT TTG ACC TT |
-4.450255334 |
|
Phospholipase A1-Igamma1, chloroplastic-like |
ATT AGC CGC ACC AAG TCA TC |
CTC CTG GAA TTC CCA TCT CA |
-4.226957883 |
|
Polygalacturonase At1g48100-like, transcript variant X2 |
TGC CCA TAA CTT GGA GGT TC |
TTG TTT TCA TCT TGC CAC CA |
-4.168161385 |
|
Housekeeping gene
|
|
GsTUA5
|
TGC CAC CAT CAA GAC TAA GAG G |
ACC ACC AGG AAC AAC AGA AGG |
- |
Table 4Description of isoflavonoid biosynthesis pathway genes and primer design in candidate DEGs for qRT-PCR.
Table 4
|
Gene description |
Forward (5'→3') |
Reverse (5'→3') |
log2FC |
|
Isoflavonoid biosynthesis pathway genes
|
|
dirigent protein 1-like |
TTC ACT TTC GGG CTA TTT GC |
GAA GAA GTG GAG GTG GGT GA |
5.26712416 |
|
3,9-dihydroxypterocarpan 6A-monooxygenase |
CGT TTC GGA CTT CAT TTG GT |
TGC CCG TTT CTT TGT TTT TC |
4.903367601 |
|
isoflavone 2'-hydroxylase-like |
CAT CCT CCT GCT CCA CTA GC |
TCC ACA CCA AAG GGT CTC TC |
4.467640495 |
|
isoflavone 7-O-methyltransferase-like |
TGG CCG TAA TGC AAG TGA GA |
AAT GGG TTG GCC ATG GTT GT |
3.743586021 |
|
isoflavone reductase-like |
CGG CAA ATG ACC CTA ATG CC |
GTG GTA CAA AGC CAG CAG GT |
3.532848862 |
|
vestitone reductase-like |
GTC ACT GGA GGC ACA GGA TT |
AAA ACT CTC TGG GTC GCT GA |
2.213398994 |
References
- 1. Alam I, Lee DG, Kim KH, Park CH, Sharmin SA, Lee H, Oh KW, Yun BW, Lee BH. 2010. Proteome analysis soybean roots under waterlogging stress at an early vegetative stage. J Biosci 35: 49-62.
- 2. Aleem M, Raza MM, Haider MS, Atif RM, Ali Z, Bhat JA, Zhao T. 2020. Comprehensive RNA-seq analysis revealed molecular pathways and genes associated with drought tolerance in wild soybean (Glycine soja Sieb. and Zucc.). Physiol Plant 172: 707-732.
- 3. Arasan SKT, Park JI, Ahmed NU, Jung HJ, Hur Y, Kang KK, Lim YP, Nou IS. 2013. Characterization and expression analysis of dirigent family genes related to stresses in Brassica. Plant Physiol Biochem 67: 144-153.
- 4. Ashburner M, Ball CA, Blake JA, Botstein D, Butler H, Cherry JM, Davis AP, Dolinski K, Dwight SS, Eppig JT, Harris MA, Hill DP, Tarver LI, Kasarskis A, Lewis S, Matese JC, Richardson JE, Ringwald M, Rubin GM, Sherlock G. 2000. Gene Ontology: tool for the unification of biology. Nat Genet 25: 25-29.
- 5. Banerjee S, Goswami R. 2009. GST profile expression study in som selected plants: in silico approach. Mol Cell Biochem 380: 283-300.
- 6. Bohnert HJ, Sheveleva E. 1998. Plant stress adaptations-making metabolism move. Curr Opin Plant Biol 1: 267-274.
- 7. Chaudhary J, Patil GB, Sonah H, Deshmukh RK, Vuong TD, Valliyodan B, Nguyen HT. 2015. Expanding omics resources for improvement of soybean seed composition traits. Front Plant Sci 6: 1021
- 8. Chaves MM, Pereira JS, Maroco J, Rodrigues ML, Ricardo CPP, OSÓRIO ML, Carvalho I, Faria T, Pinheiro C. 2002. How plants cope with water stress in the field? Photosynthesis and growth. Ann Bot 89: 907-916.
- 9. Chen W, Yao Q, Patil G, Agarwal G, Deshmukh1 R, Lin L, Wang B, Wang Y, Prince S, Song L, Xu D, An Y, Valliyodan B, Varshney R, Nguyen H. 2016. Identification and comparative analysis of differential gene expression in soybean leaf tissue under drought and flooding stress revealed by RNA-seq. Front Plant Sci 7: 1044
- 10. Chen Y, Zhang B, Li C, Lei C, Kong C, Yang Y, Gong M. 2019. A comprehensive expression analysis of the expansin gene family in potato (Solanum tuberosum) discloses stress-responsive expansin-like B genes for drought and heat tolerances. Plos One 14: e0219837.
- 11. Clouse SD, Sasse JM. 1998. BRASSINOSTEROIDS: Essential regulators of plant growth and development. Annu Rev Plant Physiol Plant Mol Biol 49: 427-451.
- 12. Concibido VC, La Vallee B, Mclaird P, Pineda N, Meyer J, Hummel L, Yang J, Wu K, Delannay X. 2003. Introgression of a quantitative trait locus for yield from Glycine soja into commercial soybean cultivars. Theor Appl Genet 106: 575-582.
- 13. Cowan IR. In: Lange OL, Nobel PS, Osmond CB, Ziegler H. 1982. Regulation of water use in relation to carbon gain in higher plants. (Eds). Physiological plant ecology II. Springer, Berlin, Germany: pp. 589-614.
- 14. Crawford RMM. 1967. Alcohol dehydrogenase activity in relation to flooding tolerance in roots. J Exp Bot 18: 458-464.
- 15. Dai F, Zhang C, Jiang X, Kang M, Yin X, Lü P, Zhang X, Zheng Y, Gao J. 2012. RhNAC2 and RhEXPA4 are involved in the regulation of dehydration tolerance during the expansion of rose petals. Plant Physiol 160: 2064-2082.
- 16. Dahuja A, Kumar RR, Sakhare A, Watts A, Singh B, Goswami S, Sachdev A, Praveen S. 2020. Role of ATP-binding cassette transporters in maintaining plant homeostasis under abiotic and biotic stresses. Physiol Plant (in press)
- 17. Danquah A, Zelicourt A, Colcombet J, Hirt H. 2014. The role of ABA and MAPK signaling pathways in plant abiotic stress responses. Biotechnol Adv 32: 40-52.
- 18. Dastmalchi M, Chapman P, Yu J, Austin RS, Dhaubhadel S. 2017. Transcriptomic evidence for the control of soybean root isoflavonoid content by regulation of overlapping phenylpropanoid pathways. BMC Genom 18: 70
- 19. Dat JF, Capelli N, Folzer H, Bourgeade P, Badot PM. 2004. Sensing and signaling during plant flooding. Plant Physiol Biochem 42: 273-282.
- 20. Dhaubhadel S, McGravey BD, Williams R, Gijzen M. 2003. Isoflavonoid biosynthesis and accumulation in developing soybean seeds. Plant Mol Biol 53: 733-743.
- 21. Do THT, Martinoia E, Lee Y. 2018. Functions of ABC transporters in plant growth and development. Curr Opin Plant Biol 41: 32-38.
- 22. Drew MC. 1997. Oxygen deficiency and root metabolism: injury and acclimation under hypoxia and anoxia. Annu Rev Plant Physiol Plant Mol Biol 48: 223-250.
- 23. Drew MC, He CJ, Morgan PW. 2000. Programmed cell death and aerenchyma formation in roots. Trends Plant Sci 5: 123-127.
- 24. Feng X, Feng P, Yu H, Yu X, Sun Q, Liu S, Minh TN, Chen J, Wang D, Zhang Q, Cao L, Zhou C, Li Q, Xiao J, Zhong S, Wang A, Wang L, Pan H, Ding X. 2020. GsSnRK1 interplays with transcription factor GsERF7, from wild soybean to regulate soybean stress resistance. Plant Cell Environ 43: 1192-1211.
- 25. Fujiwara K, Cabanos C, Toyota K, Kobayashi Y, Maruyama N. 2014. Differential expression and elution behavior of basic 7S globulin among cultivars under hot water treatment of soybean seeds. J Biosci Bioeng 117: 742-748.
- 26. Gamble RL, Coonfield ML, Schaller GE. 1998. Histidine kinase activity of the ETR1 ethylene receptor from Arabidopsis. Proc Natl Acad Sci 95: 7825-7829.
- 27. Grichko VP, Glick BR. 2001. Ethylene and flooding stress in plants. Plant Physiol Biochem 39: 1-9.
- 28. Gullner G, Komives T, Király L, Schröder P. 2018. Glutathione S-transferase enzymes in plant-pathogen interactions. Front Plant Sci 9: 1836
- 29. Hamel LP, Nicole MC, Duplessis S, Ellis BE. 2012. Mitogen-activated protein kinase signaling in plant-interacting fungi: distinct messages from conserved messengers. Plant Cell 24: 1327-1351.
- 30. Han Y, Li A, Li F, Zhao M, Wang W. 2012. Characterization of a wheat (Triticum aestivum L.) expansin gene, TaEXPB23, involved in the abiotic stress response and phytohormone regulation. Plant Physiol Biochem 54: 49-58.
- 31. Hirano H. 2021. Basic 7S globulin in plants. J Proteom 240: 104209.
- 32. Ichimura K, Mizoguchi T, Yoshida R, Yuasa T, Shinozaki Kazuo. 2000. Various abiotic stress rapidly activate Arabidopsis MAP kinase ATMPK4 and ATMPK6. Plant J 24: 655-665.
- 33. Igamberdiev AU, Baron K, Manac'H-Little N, Stoimenova M, Hill RD. 2005. The haemoglobin/nitric oxide cycle: involvement in flooding stress and effects on hormone signalling. Ann Bot 96: 557-564.
- 34. Kamal AHM, Rashid H, Sakata K, Komatsu S. 2015. Gel-free quantitative proteomic approach to identify cotyledon proteins in soybean under flooding stress. J Proteom 112: 1-13.
- 35. Kamal AHM, Komatsu S. 2015. Involvement of reactive oxygen species and mitochondrial proteins in biophoton emission in roots of soybean plants under flooding stress. J Proteome Res 14: 2219-2236.
- 36. Kim JT, Kim JE. 1994. Changes in the accumulation of isoflavonoids in soybean stress. Agric Res Bull Kyungpook Natl Univ 12: 9-22.
- 37. Kim SH, Tripathi P, Yu S, Park JM, Lee JD, Chung YS, Chung G, Kim Y. 2021. Selection of tolerant and susceptible wild soybean (Glycine soja Siebold & Zucc.) accessions under waterlogging condition using vegetation indices. Pol J Environ Stud 30: 3659-3675.
- 38. Kim YH, Hwang SJ, Waqas M, Khan AL, Lee JH, Lee JD, Nguyen HY, Lee IJ. 2015. Comparative analysis of endogenous hormones level in two Soybean (Glycine max L.) lines differing in waterlogging tolerance. Front Plant Sci 6: 714
- 39. Kim YH. 2019. Flooding tolerance mechanism in plants. J Agric Life Sci 53: 1-13.
- 40. Kofsky J, Zhang H, Song BH. 2018. The untapped genetic reservoir: the past, current, and future applications of the wild soybean (Glycine soja). Front Plant Sci 9: 949
- 41. Kokubun M. 2013. Genetic and cultural improvement of soybean for waterlogged conditions in Asia. Field Crops Res 152: 3-7.
- 42. Komatsu S, Thibaut D, Hiraga S, Kato M, Chiba M, Hashiguchi A, Tougou M, Shimamura S, Yasue H. 2011. Characterization of a novel flooding stress-responsive alcohol dehydrogenase expressed in soybean roots. Plant Mol Biol 77: 309-322.
- 43. KREI (Korea Rural Economic Institute).2021. Korea Rural Economic Institute. E04-2021-2.
- 44. Krishnamurthy P, Muthusamy M, Kim JA, Jeong MJ, Lee SI. 2019. Brassica rapa expansin-like B1 gene (BrEXLB1) regulate growth and development in transgenic Arabidopsis and elicits response to abiotic stresses. J Plant Biochem Biotechnol 28: 437-446.
- 45. Kumar S, Trivedi PK. 2018. Glutathione S-transferases: role in combating abiotic stresses including arsenic detoxification in plants. Front Plant Sci 9: 751
- 46. Lee JD, Yu JK, Hwang YH, Blake S, So YS, Lee GJ, Nguyen HT, Shannon JG. 2008. Genetic diversity of wild soybean (Glycine soja Sieb. and Zucc.) accessions from South Korea and other countries. Crop Science 48: 606
- 47. Lee KJ, Jin LM, Kim YS, Row KH. 2005. Recovery of aglycone of daidzein and genistein in soybeans. Korean Chem Eng Res 43: 641-645.
- 48. Li Q, Pan Z, Gao Y, Li T, Liang J, Zhang Z, Zhang H, Deng G, Long H, Yu M. 2020. Quantitative trait locus (QTLs) mapping for quality traits of wheat based on high density genetic map combined with bulked segregant analysis RNA-seq (BSR-Seq) indicates that the Basic 7S Globulin gene is related to falling number. Front Plant Sci 11: 600788.
- 49. Li X, Wang Y, Liu F, Pi B, Zhao T, Yu B. 2020. Transcriptomic analysis of Glycine soja and G. max seedlings and functional characterization of GsGSTU24 and GsGSTU42 genes under submergence stress. Environ Exp Bot 171: 103963.
- 50. Li Y, Jones L, McQueen-Mason S. 2003. Expansins and cell growth. Curr Opin Plant Biol 6: 603-610.
- 51. Lim CW, Baek W, Jung J, Kim JH, Lee SC. 2015. Function of ABA in stomatal defense against biotic and drought stress. Int J Mol Sci 16: 15251-15270.
- 52. Lin F, Chhapekar SS, Vieira CC, Da Silva MP, Rojas A, Lee D, Liu N, Pardo EM, Lee YC, Dong Z, Pinheiro JB, Ploper LD, Rupe J, Chen P, Wang D, Nguyen HT. 2022. Breeding for disease resistance in soybean: a global perspective. Theor Appl Genet. https://doi.org/10.1007/s00122-022-04101-3.
- 53. Livak KJ, Schmittgen TD. 2001. Analysis of relative gene expression data using real-time quantitative PCR and the 2−ΔΔCT method. Methods 25: 402-408.
- 54. Lü P, Kang M, Jiang X, Dai F, Gao J, Zhang C. 2013. RhEXP4, a rose expansin gene, modulates leaf growth and confers drought and salt tolerance to Arabidopsis. Planta 237: 1547-1559.
- 55. Mignolet-Spruyt L, Xu E, Idänheimo N, Hoeberichts FA, Mühlenbock P, Brosché M, Van Breusegem F, Kangasjärvi J. 2016. Spreading the news: subcellular and organellar reactive oxygen species production and signalling. J Exp Bot 67: 3831-3844.
- 56. Muthusamy M, Kim JY, Yoon EK, Kim JA, Lee SI. 2020. BrEXLB1, a Brassica rapa Expansin-like B1 gene is associated with root development, drought stress response, and seed germination. Genes 11: 404
- 57. Nanjo Y, Nakamura T, Komatsu S. 2013. Identification of indicator proteins associated with flooding injury in soybean seedlings using label-free quantitative proteomics. J Proteome Res 12: 4785-4798.
- 58. Paniagua C, Bilkova A, Jackson P, Dabravolski S, Riber W, Didi V, Houser J, Gigli-Bisceglia N, Wimmerova M, Budínská E, Hamann T, Hejatko J. 2017. Dirigent proteins in plants: modulating cell wall metabolism during abiotic and biotic stress. J Exp Bot 68: 3287-3301.
- 59. Park SY, Choi CH, Kim KH, Jung WJ, Kim JY. 2022. Expression analysis of pre-harvest sprouting tolerant Korean wheat via transcriptomic analysis. Korean J Breed Sci 54: 104-118.
- 60. Qian T, Li C, Liu F, Xu K, Wan C, Liu Y, Yu H. 2022. Arabidopsis synaptotagmin 1 mediates lipid transport in a composition-dependent manner. Traffic 23: 346-356.
- 61. Ralph SG, Jancsik S, Bohlmann J. 2007. Dirigent proteins in conifer defense II: Extended gene discovery, phylogeny, and constitutive and stress-induced gene expression in spruce (Picea spp.). Phytochemistry 68: 1975-1991.
- 62. Rehman SU, Qanmber G, Tahir MHN, Irshad A, Fiaz S, Ahmad F, Ali Z, Sajjad M, Shees M, Usman M, Geng Z. 2021. Characterization of vascular plant one-zinc finger (VOZ) in soybean (Glycine max and Glycine soja) and their expression analyses under drought condition. Plos One 16: e0253836.
- 63. Rizal G, Karki S. 2011. Alcohol dehydrogenase (ADH) activity in soybean (Glycine max [L.] Merr.) under flooding stress. Electron J Plant Breed 2: 50-57.
- 64. Ruiz-Lopez N, Pérez-Sancho J, del Valle AE, Haslam RP, Vanneste S, Catalá R, Perea-Resa C, Van Damme D, García-Hernández S, Albert A, Vallarino J, Lin J, Friml J, Macho AP, Salinas J, Rosado A, Napier JA, Amorim-Silva V, Botella MA. 2021. Synaptotagmins at the endoplasmic reticulum-plasma membrane contact sites maintain diacylglycerol homeostasis during abiotic stress. Plant Cell 33: 2431-2453.
- 65. Ruperti B, Botton A, Populin F, Eccher F, Brilli M, Quaggiotti S, Trevisan S, Cainelli N, Guarracino P, Schievano E, Meggio F. 2019. Flooding responses on grapevine: A physiological transcriptional, and metabolic perspective. Front Plant Sci 26: 339
- 66. Růžička K, Ljung K, Vanneste S, Podhorská R, Beeckman T, Friml J, Benková E. 2007. Ethylene regulates root growth through effects on auxin biosynthesis and transport-dependent auxin distribution. Plant Cell 19: 2197-2212.
- 67. Sairam RK, Kumutha D, Ezhilmathi K, Deshmukh PS, Srivastava GC. 2008. Physiology and biochemistry of waterlogging tolerance in plants. Biol Plant 52: 401-412.
- 68. Sappl PG, Oñate-Sánchez L, Singh KB, Millar AH. 2004. Proteomic analysis of glutathione S-transferases of Arabidopsis thaliana reveals differential salicylic acid-induced expression of the plant-specific Phi and Tau classes. Plant Mol Biol 54: 205-219.
- 69. Sasidharan R, Hartman S, Liu Z, Martopawiro S, Sajeev N, van Veen H, Yeung E, Voesenek L. 2018. Signal dynamics and interactions during flooding stress. Plant Physiol 176: 1106-1117.
- 70. Sauter M. 2013. Root responses to flooding. Curr Opin Plant Biol 16: 282-286.
- 71. Schepetilnikov M, Ryabova LA. 2017. Auxin signaling in regulation of plant translation reinitiation. Front Plant Sci 8: 1014
- 72. Seo CW, Lee SM, Kang SM, Park YG, Kim AY, Park HJ, Kim Y, Lee IJ. 2017. Selection of suitable plant growth regulators for augmenting resistance to waterlogging stress in soybean plants (Glycine max L.). Korean J Crop Sci 62: 325-332.
- 73. Shabala S, Shabala L, Barcelo J, Poschenrieder C. 2014. Membrane transporters mediating root signalling and adptive responses to oxygen deprivation and soil flooding. Plant Cell Environ 37: 2216-2233.
- 74. Sharmin RA, Bhuiyana MR, Lv W, Yu U, Chang F, Kong J, Bhat JA, Zhao T. 2020. RNA-Seq based transcriptomic analysis revealed genes associated with seed-flooding tolerance in wild soybean (Glycine soja Sieb. & Zucc.). Environ Exp Bot 171: 103906.
- 75. Shutov AD, Prak K, Fukuda T, Rudakov SV, Rudakova AS, Tandang-Silvas MR, Fujiwara K, Mikami B, Utsumi S, Maruyama N. 2010. Soybean basic 7S globulin: subunit heterogeneity and molecular evolution. Biosci Biotechnol Biochem 74: 1631-1634.
- 76. Steffens B, Kovalev A, Gorb SN, Sauter M. 2012. Emerging roots alter epidermal cell fate through mechanical and reactive oxygen species signaling. Plant Cell 24: 3296-3306.
- 77. Strelau M. 2017. Analysis of the Arabidopsis synaptotagmin gene expression and protein accumulation during stress using luciferase-based markers. Doctoral Thesis The University of British Columbia.
- 78. Teige M, Scheikl E, Eulgem T, Dóczi R, Ichimura K, Shinozaki K, Dangl JL, Hirt H. 2004. The MKK2 pathway mediates cold and salt stress signaling in Arabidopsis. Mole Cell 15: 141-152.
- 79. Theologis A. 1998. Ethylene signaling: redundant receptors all have their say. Curr Biol 8: R875-R878.
- 80. Thomas DM, Ferguson GD, Herschman HR, Elferink LA. 1999. Functional and biochemical analysis of the C2 domains of Synaptotagmin IV. Mol Biol Cell 10: 2285-2295.
- 81. Tougou M, Hashiguchi A, Yukawa K, Nanjo Y, Hiraga S, Nakamura T, Nishizawa K, Komatsu S. 2012. Responses to flooding stress in soybean seedlings with the alcohol dehydrogenase transgene. Plant Biotechnol 29: 301-305.
- 82. Valliyodan B, Ye ng L, Murphy M, Shannon JG, Nguyen HT. 2017. Genetic diversity and genomic strategies for improving drought and waterlogging tolerance in soybeans. J Exp Bot 68: 1835-1849.
- 83. Vanhee C, Zapotoczny G, le Masquelier D, Ghislain M, Batoko H. 2011. The Arabidopsis multistress regulator TSPO is a heme binding membrane protein and a potential scavenger of porphyrins via an autophagy-dependent degradation mechanism. Plant Cell 23: 782-805.
- 84. Wang Q, Zuo Z, Wnag X, Gu L, Toshizumi T, Yang Z, Yang L, Liu Q, Liu W, Han YJ, Kim JI, Liu B, Wohlschlegel JA, Matsui M, Oka Y, Lin C. 2016. Photoactivation and inactivation of Arabidopsis cryptochrome 2. Science 354: 343-347.
- 85. Wang X, Oh MW, Sakata K, Komatsu S. 2016. Gel-free/label-free proteomic analysis of root tip of soybean over time under flooding and drought stresses. J Proteomics 130: 42-55.
- 86. Warnes GR, Bolker B, Bonebakker L, Gentleman R, Huber W, Liaw A, Lumley T, Maechler M, Magnusson A, Moeller M. 2015. Gplots: Various R programming tools for plotting data. R Package.
- 87. Wilkinson S. 1999. PH as a stress signal. Plant Growth Regul 29: 87-99.
- 88. Wu R, Wang L, Wnag Z, Shang H, Liu X, Zhu Y, Qi D, Deng X. 2009. Cloning and expression analysis of a dirigent protein gene from the resurrection plant Boea hygrometrica. Prog Nat Sci 19: 347-352.
- 89. Xie M, Chung CY, Li M, Wong F, Wang X, Liu A, Wang Z, Leung AK, Wong T, Tong S, Xiao Z, Fan K, Ng M, Qi X, Yang L, Deng T, He L, Chen L, Fu A, Ding Q, He J, Chung G, Isobe S, Tanabata T, Valliyodan B, Nguyen HT, Cannon SB, Foyer CH, Chan T, Lam H. 2019. A reference-grade wild soybean genome. Nat Commun 10: 1216
- 90. Yang Z, Yan B, Dong H, He G, Zhou Y, Sun J. 2021. BIC1 acts as a transcriptional coactivator to promote brassinosteroid signaling and plant growth. EMBO J 40: e104615.
- 91. Yin X, Hiraga S, Hajika M, Nishimura M, Komatsu S. 2016. Transcriptomic analysis reveals the flooding tolerant mechanism in flooding tolerant line and abscisic acid treated soybean. Plant Mol Biol 93: 479-496.
- 91. Zhang J, McDonald SC, Wu C, Ingwers MW, Abdel-Haleem H, Chen P, Li Z. 2022. Quantitative trait loci underlying flooding tolerance in soybean (Glycine max). Plant Breed 141: 236-245.
- 93. Zhao Y, Gao J, Kim JI, Chen K, Bressan RA, Zhu JK. 2017. Control of plant water use by ABA induction of senescence and dormancy: An overlooked lesson from evolution. Plant Cell Physiol 58: 1319-1327.
- 94. Zhao Y, Zhang W, Abou-Elwafa SF, Shabala S, Xu L. 2021. Understanding a mechanistic basis of ABA involvement in plant adaptation to soil flooding: the current standing. Plants 10: 1982