적요
Breeders typically use core collections of a specific trait or core collections selected by a few genotypes to efficiently select breeding materials or to study functional genes. As a result, many accessions have been deemed redundant or duplicated and are no longer considered for use. This study aimed to investigate the agronomical characteristics and genetic diversity of 1,514 previously unused and unstudied wheat germplasms and to confirm their value as breeding materials using population structure analysis. The performance of these wheat germplasms was compared with that of 8,878 wheat breeding materials and 72 known Korean wheat cultivars. The results of agronomic trait diversity comparison showed that the germplasm populations used for breeding research did not completely encompass the unused germplasm populations. The agronomic traits of wheat germplasms varied greatly. ANOVA and PCA results revealed the greatest differences in growth habits (CV=0.339), panicle length (CV=0.330), and awn length (CV=0.296). To accurately assess the value of unused wheat germplasms as breeding materials, 106 SSR markers were extracted from the analysis of four representative Korean cultivars: Geuru, Geumgang, Uri, and Jokyoung. Among these, 24 SSR markers were chosen, and 129 wheat resources were subjected to population structure analysis, which revealed five subpopulations. Most of the 34 germplasms that originated in Korea were distributed in subpopulation 1 (18 accessions, 52.9%) and subpopulation 4 (12 accessions, 35.3%). Subgroups 2, 3, and 5 differed significantly in agronomic traits and genotypes, indicating their potential as breeding materials. The findings of this study could serve as a foundation for breeders and aid in the discovery and utilization of new wheat breeding materials.
서 언
밀은 세계적으로 쌀, 옥수수 등과 함께 5대 곡류 중 하나로, 세계적으로 약 7.7억톤이 생산되어 세계인구 소비 열량의 20%를 제공하며 국내 1인당 연간소비량은 31.6 kg으로 벼(59.2 kg) 다음으로 많아 매우 중요한 작물이다(
Howell et al. 1995,
Kim et al. 2018). 그러나 국내 밀 곡물자급률은 0.5%로 수요는 3.3백만톤 정도이나 국내 생산량은 15천톤에 밖에 되지 않고, 수입의존도가 99%로 매우 높아 밀의 안정적인 자급률 증대가 시급하다(
Ministry of Agriculture 2020). 최근 정부도 밀 자급률 향상에 대한 시급성을 깨닫고 2019년 밀 산업 육성법을 제정하여 2020년부터 시행 중이며 2022년까지 밀 자급률 목표치를 9.9%로 설정하여 달성을 위해 노력 중이다(
Kim et al. 2020). 자급률 향상을 위한 육종가들의 신품종 개발 연구도 꾸준히 진행되어 현재까지 약 50여 품종이 개발되었다(
Kang et al. 2020). 그러나, 무분별한 신품종의 보급은 종 내 유전적 다양성을 감소시킬 수 있다(
Rauf et al. 2010).
유전적 다양성의 증대 및 보존은 작물의 지속적인 생산을 위해 중요하다. 유전자원의 다양성 감소로 인하여 손실되는 유전정보는 생물적 및 비생물적 스트레스에 대한 방어 및 적응성을 가진 유용한 유전정보를 포함할 수 있기 때문에 기후를 포함한 재배환경의 변화에 대응하여 식량안보를 유지하기 위해서는 유전자원 확보 및 다양성 현황을 파악하고 유지 및 증대를 위한 방안이 필요하다. 더욱이 밀은 자식성 식물로 타식성 작물에 비해 유전적 다양성이 낮으므로, 밀의 품질과 생산량에 부정적인 영향을 미칠 수 있기 때문에 다양성을 보호하는 효과적인 전략을 수립해야 한다(
Hughes & Stachowicz 2004,
Jarvis et al. 2007,
Hajjar et al. 2008).
국내에서는 유전자원과 종 다양성 확보 및 보존을 위해 농촌진흥청 국립농업과학원 농업유전자원센터가 있으며, 밀 기준 3만3천여 자원을 보유하고 있어 전 세계에서 여섯번 째로 밀 유전자원을 많이 보유한 종자은행이다(
Genesys 2021). 센터는 연구자들에게 보유 자원의 실물 및 정보를 제공하여 종자산업계과 학계를 지원하고 있는 한편, 신규 자원을 확보하여 유전적 다양성을 확보하고자 노력하고 있다(
Bedő & Láng 2015,
NAC 2021).
연구자는 효율적으로 연구하기 위해 핵심 집단이나 소량의 유전자원을 연구소재로 사용하고 있다. 따라서 대량의 유전자원은 연구자들이 활용할 수 없는 허수일 수 있고, 자원 간 중복 가능성을 포함하고 있다. 센터가 보유한 밀 중 활용사례가 없는 밀은 6천 5백여 자원(약 20%)으로 육종소재를 포함하여 활용가치를 제시할 필요가 있다. 만약 미활용 자원이 연구 소재로 활용된다면, 연구자 입장에서는 신규자원을 확보하였을 때와 동일한 효과를 기대할 수 있기 때문이다.
본 연구를 위해서 농촌진흥청 국립농업과학원 농업유전자원센터에서 보유하고 있는 밀 유전자원을 활용집단과 미활용집단으로 구분하여 연구재료로 선발하였다. 그리고 다양성을 분석하기 위하여 센터의 특성평가 표준안(밀)을 참고로 형태적 표현형을 조사하였고, 표현형을 근거로 대표집단을 작성하여 선발된 24개 SSR마커를 적용, PCR증폭산물 크기로 다양성을 분석하였다. 해당 연구는 미활용 밀 자원들의 육종 가치를 분석하고 그 결과를 연구자들에게 제공하여 육종 소재 탐색 및 선발에 유용하게 활용될 수 있을 것으로 기대된다.
재료 및 방법
재료
농업유전자원센터가 보존중인 밀 33천여 자원 중에서 육종 목적으로 활용사례가 없는 미활용 밀1,514자원을 선발하였고(미활용 집단), 미활용 집단과 비교를 위하여 육종 목적으로 활용되었던 밀 8,878자원을 선발하였다(활용 집단).
또한 미활용 집단의 농업형질과 원산지를 기반으로 PowerCore software (
Kim et al. 2007)를 이용하여 핵심집단 75자원을 선발(모집단의 5.0% 이내)하였고, 한국 원산으로 국내 재배에 적합하여 활용 가치가 높다고 생각되는 50자원을 추가하였다. 대조로는 과거 또는 현재에 품종등록의 기준품종이나 보급종으로 활용되는 그루(Geuru, C1), 금강(Geumgang, C2), 우리(Uri, C3), 조경(Jokyoung, C4) 4자원을 추가하여 총 129자원을 선발하였다(
Table 1).
추가로 서로 다른 군집에 속한 자원 간 교배로 집단 구조와 계통발생 분석 결과 불일치 부분이 존재한다. 군집 간 교배자원으로 인한 분석 오차를 최소화하고 군집 간 농업형질 차이를 정확하게 분석하기 위해 기존에 선발한 129자원에서 집단 구조와 계통발생 분석을 동시 수행하여 동일하게 분류된 80자원을 선발하였다(
Table 1).
농업유전자원센터 실험포장(Latitude: 35.831185, longitude: 127.062037; 전주, 한국)에서 2년간('19-'20년도, '20-'21년도), 단구로 임의배치하여 재배하였다.
'19-'20년도에는 대조자원 그루, 금강, 우리, 조경과 미활용 밀 587자원을 ‘19년 11월 6일에 파종하여, 완숙퇴비를 1,500 kg/10a로 시비하고, 이랑×고랑을 90×60 cm, 재식간격은 90 cm, 휴립조파로 재배하였다.'20-'21년도에는 동일한 대조자원과 미활용 밀 927자원을 '20년 10월 30일에 파종 후 전년과 동일한 조건으로 재배하였다.
농업형질조사
농업유전자원센터의 특성평가 표준안(밀)을 기준으로 조사하였다. 조사 항목으로는 식물체 생장습성(Growth habit, GH, 월동직후 잎과 분얼이 서있는 각도), 엽이 안토시아닌 유무(Auricle Anthocyanin, AA, 출수기에 지엽의 안토시아닌 착색 유무), 파종 후 출수일(Heading dates after sowing, HD, 파종 후 총 경수의 40%이상 출수한 날까지의 소요기간), 지엽직립성 정도(Erectness of flag leaf, EF, 출수기에 지엽의 직립성 정도), 간장(Stem length, SL, 출수 후 지면에서 이삭목까지의 길이), 파종 후 성숙일(The maturity after sowing, TM, 파종 후 제 1절 황변시까지의 소요기간), 수형(Panicle shape, PS, 출수 후 이삭의 형태), 수장(Panicle length, PL, 성숙기에 망을 제외한 이삭 길이), 망장(Awn length, AL, 성숙기에 중앙열의 중앙부에서 2~3개의 망 길이), 종실색(Seed color, SC, 탈곡 후 종피색) 총 10항목을 조사하였다. 형질조사는 형질 분리 시 소수형질을 제외하고, 우점형질을 기준으로 조사하였으며, 길이를 측정하는 수장, 간장, 망장은 3반복으로 수행하였다.
Genomic DNA 추출
밀 종자를 막자 사발에 넣어 잘게 부순 후 시료와 텅스텐 구슬을 2 mL 튜브에 옮겨담아 분쇄기(TissueLyzer II, Qiagen, German)로 고르게 마쇄하였다. DaBead™ Genomic DNA Prep Kit For Plant©(BIOFACT, Korea)를 이용하여 Kit의 설명서에 따라 genomic DNA를 추출하였고, 추출된 DNA는 microplate spectrophotometer (Eon™, BioTek, USA)를 이용하여 정량 후 PCR에 사용하였다.
SSR 선발 및 분석
분자마커 선발의 효율성을 위해 기 보고된 106개의 SSR 마커를 활용하여 PCR증폭산물의 패턴을 확인하였다(
Huang et al. 2002,
Somers & Isaac 2004,
Wang et al. 2015,
Ahmed et al. 2017,
Tékeu et al. 2017,
Salehi et al. 2018). 그 결과 agarose gel을 이용한 전기영동 상에서 단일밴드이지만 증폭산물의 분자량이 달라 다형성(polymorphism)을 가진 24개의 분자표지를 선정하여 대립 유전자의 차이를 분석하였다(
Table 2). PCR은 50 ng의 genomic DNA를 주형으로 하여, 각각의 프라이머 10 pmol, dNTPs 200 uM, MgCl2 1.5 mM, Taq DNA polymerase 1 unit (Promega Co., United States of America)의 조성으로 수행하였다. PCR 조건은 94°C에서 5분동안 변성(denaturation) 후 94°C에서 30초, 각각의 결합(annealing) 온도에서 30초, 72°C에서 30초로 35~40회 신장(elongation) 반복 후 72°C에서 10분간 유지하였다. PCR을 통해 얻어진 증폭 산물을 Fragment Analyzer System (Agilent Technologies, United States of America)으로 전기영동하고, 컴퓨터 분석 프로그램(PROSize 3.0)을 활용하여 증폭 산물의 크기를 분석하였다.
PowerMarker software v3.25 (
Liu & Muse 2005)로 24개 SSR마커를 활용한 PCR 증폭산물의 결과를 이용하여 계통발생 분석을 수행하였다. 129개 자원의 증폭산물 크기로 MEGA X v10.0.4 software (
Kumar et al. 2018)를 사용하여 neighbor-joining방법으로 계통수를 분석하였다. 계통발생수는 nwk형식으로 iTOL v5 (
Letunic et al. 2021)를 사용하여 계통분석도를 시각화하였다.
자원 간 유사성과 농업형질 변이 정도를 확인하기 위하여 10가지 농업형질 조사자료로 SIMCA v14.1 software (Umetrics, Umeå, Sweden)를 이용하여 주성분 분석(Principal Component Analysis, PCA)을 수행하였다.
집단 구조 분석 (Population structure analysis) 결과 집단간 양적형질 차이의 유의성 검정은 XLSTAT software v2019 (Addinsoft, Paris, France)를 사용하여 던컨 다중검정법(Duncan's multiple range test)으로 수행하였다.
결 과
미활용 자원의 농업형질 분포 및 특성
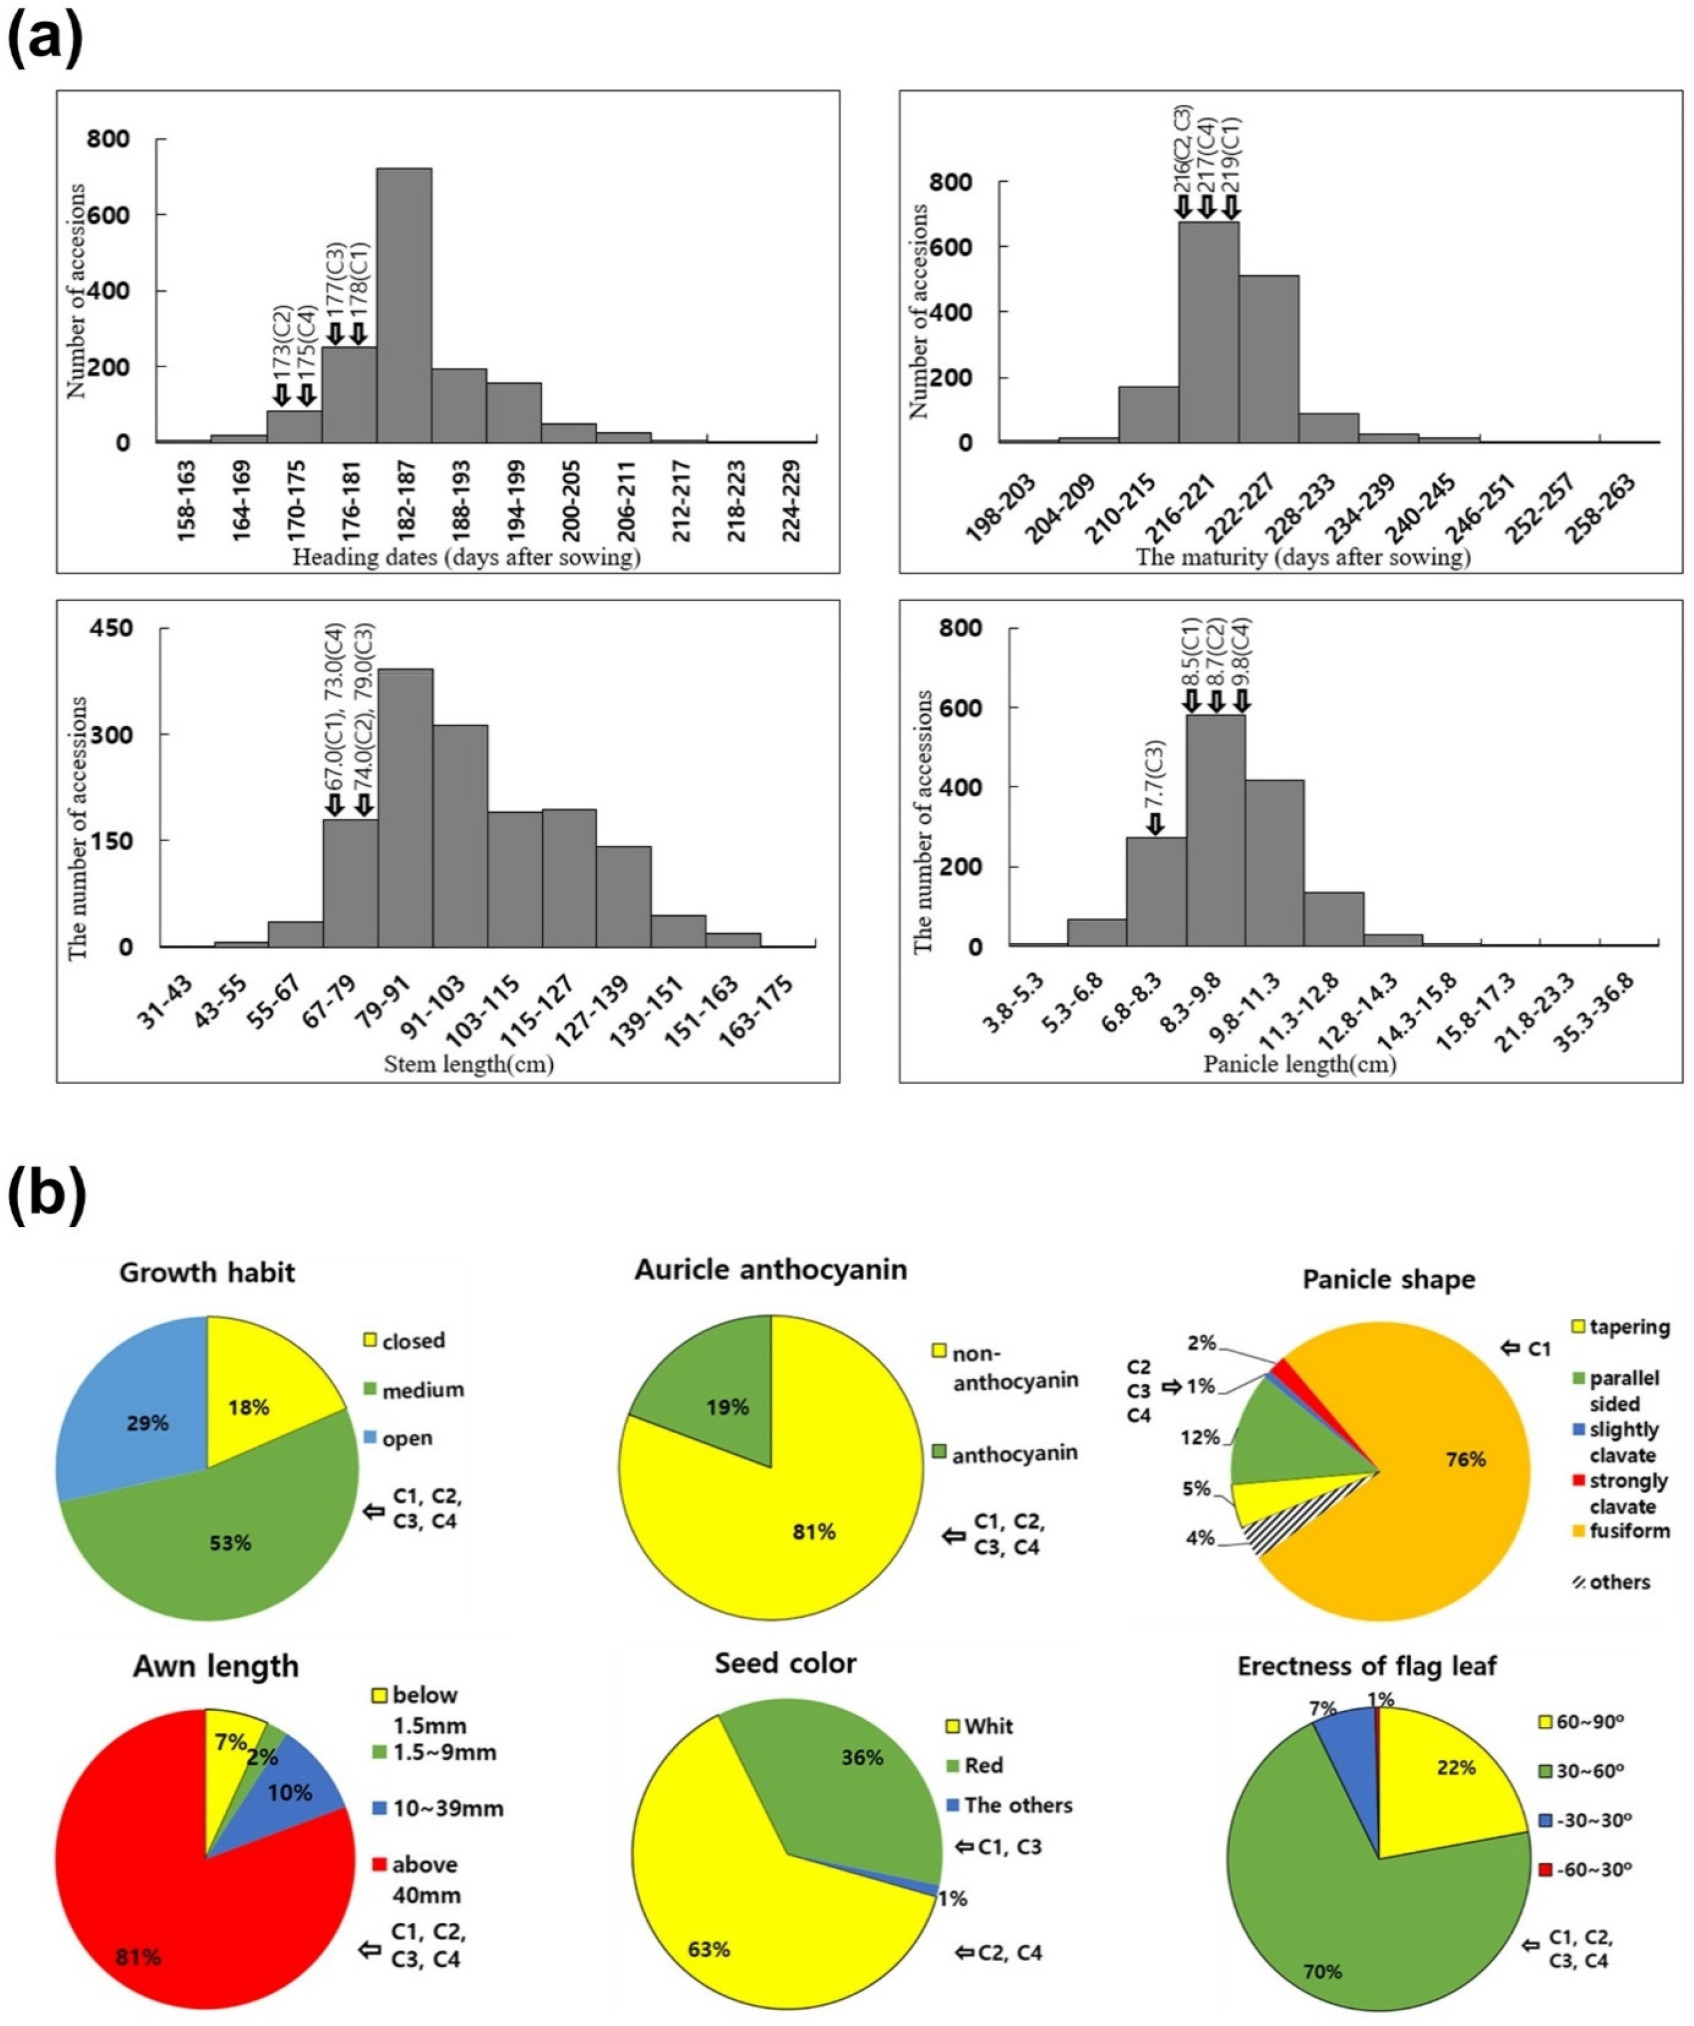
미활용 밀 1,514자원의 파종 후 출수일은 158~225일 까지 분포하였는데, 182~187일 구간이 전체 자원의 47.5%로 가장 많았고 그루(C1), 금강(C2), 우리(C3), 조경(C4)은 각각 178일, 173일, 177일, 175일이었다. 파종 후 성숙일은 192~260일까지 분포하였으며, 216~221일 구간이 전체 자원의 44.5%로 가장 많이 조사되었는데 그루(C1), 금강(C2), 우리(C3), 조경(C4)은 각각 219일, 216일, 216일, 217일 이었다(
Fig. 1a). 간장은 31.0~ 163.9 cm까지 분포하였고 79.0~91.0 cm 구간이 전체 자원의 25.7%로 가장 많이 분포하였는데 그루(C1), 금강(C2), 우리(C3), 조경(C4)은 각각 67.0 cm, 74.0 cm, 79.0 cm, 73.0 cm이었다. 수장은 3.8~36.8 cm까지 분포하였고, 8.3~9.8 cm구간이 전체 자원의 38.2%가 분포하였으며, 그루(C1), 금강(C2), 우리(C3), 조경(C4)은 각각 8.5 cm, 8.7 cm, 7.7 cm, 9.8 cm이었다(
Fig. 1a). 식물체 생장 습성은 대조 품종 4자원을 포함한 전체 자원의 반 이상(53%)이 중간으로 조사되었고, 엽이 안토시아닌 유무는 대조품종 4자원을 포함한 전체의 81%가 없는 것으로 조사되었다(
Fig. 1b). 이삭형태는 그루(C1)를 포함한 전체 76%가 방추형, 12%가 봉형이고 금강(C2), 우리(C3), 조경(C4)이 반곤봉형으로 조사되었으며, 망장은 대조품종 4자원을 포함한 81%가 40 mm 이상으로 조사되었다(
Fig. 1b). 종실색은 금강(C2), 조경(C4)을 포함한 63%가 백립, 그루(C1), 우리(C3)를 포함한 36%가 적립이었고, 지엽직립성 정도는 대조품종 4자원을 포함한 71%가 30~60°, 22%가 60~90°으로 조사되었다(
Fig. 1b).
미활용집단(Group 1), 활용집단(Group 2), 국내 육성품종(Group 3)과 대조자원(Group 4) 간 농업형질을 비교하였다. 그 결과 유의미한 차이를 확인하였는데, 파종 후 출수일, 파종 후 성숙일에서 대조자원 집단이 가장 빨랐으며, 각 집단 간 유의미한 차이가 있음을 확인하였다. 간장과 수장 또한 대조자원 집단이 가장 짧았는데, 간장은 미활용 집단, 활용 집단, 국내 육성품종 및 대조자원 3그룹으로 유의미한 차이가 있었고, 수장은 미활용 집단과 활용집단, 국내 육성품종 및 대조자원 2그룹으로 유의미한 차이가 있었다(
Table 3). 또한 식물체 생장습성, 이삭형태, 종실색, 망길이에서 활용집단과 미활용 집단간의 특성 분포에 차이가 있었다(
Table 4). 각 집단 별 농업형질 분포를 정확히 파악하고자 PCA-X분석을 수행하였고, 집단 별 자원 분포에서 차이가 있음을 확인하였다(
Supplementary Fig. 1)
다만 기존의 연구결과를 보면 농업형질은 야생종, 재래종 그리고 육성품종까지 기후, 지역 등 재배환경에 따라 일정하지 않다(
Meza & Silva 2009,
Sung et al. 2014,
Son et al. 2021). 따라서 농업형질 별 자원 분포 및 농업형질의 PCA-X분석만으로 미활용 집단의 다양성과 육종소재 가능성을 판단하는 것은 정확하지 않을 수 있다. 그러므로 분석의 정확도를 높이기 위하여 미활용 집단 1,514자원의 농업형질 조사결과와 원산지로 PowerCore software를 이용하여 미활용 집단을 대표하는 대표자원 75자원을 선발(모집단의 5.0% 이내)하고, 미활용 집단에서 대표자원과 한국원산 50자원 및 대조품종으로 그루(C1), 금강(C2), 우리(C3), 조경(C4)을 추가하여 129자원을 선발하였다.
유전적 다양성 분석을 위해 앞서 선발한 129자원에 24개 SSR마커를 적용하여 PCR 증폭산물의 크기로 다양성을 분석하였다. 24개 마커의 각 유전자좌에서 대립유전자수의 범위는 6-25개이고 평균 12.167개이다. Xgwm294, Xcfd29, Xgwm539는 20개 이상의 대립유전자를 확인하였다. Nei's gene diversity index (
Nei, 1973)는 0.532-0.932범위에 있고 평균 0.777인데 이중에 Xgwm294, Xcfd29, Xgwm539, gwm437의 genetic diversity가 0.9 이상으로 높았다. Polymorphism information content (PIC)의 범위는 0.501-0.928으로, 평균 0.753이고 Major Allele Frequency의 범위는 0.125-0.659이며 평균은 0.344이다(
Table 5).
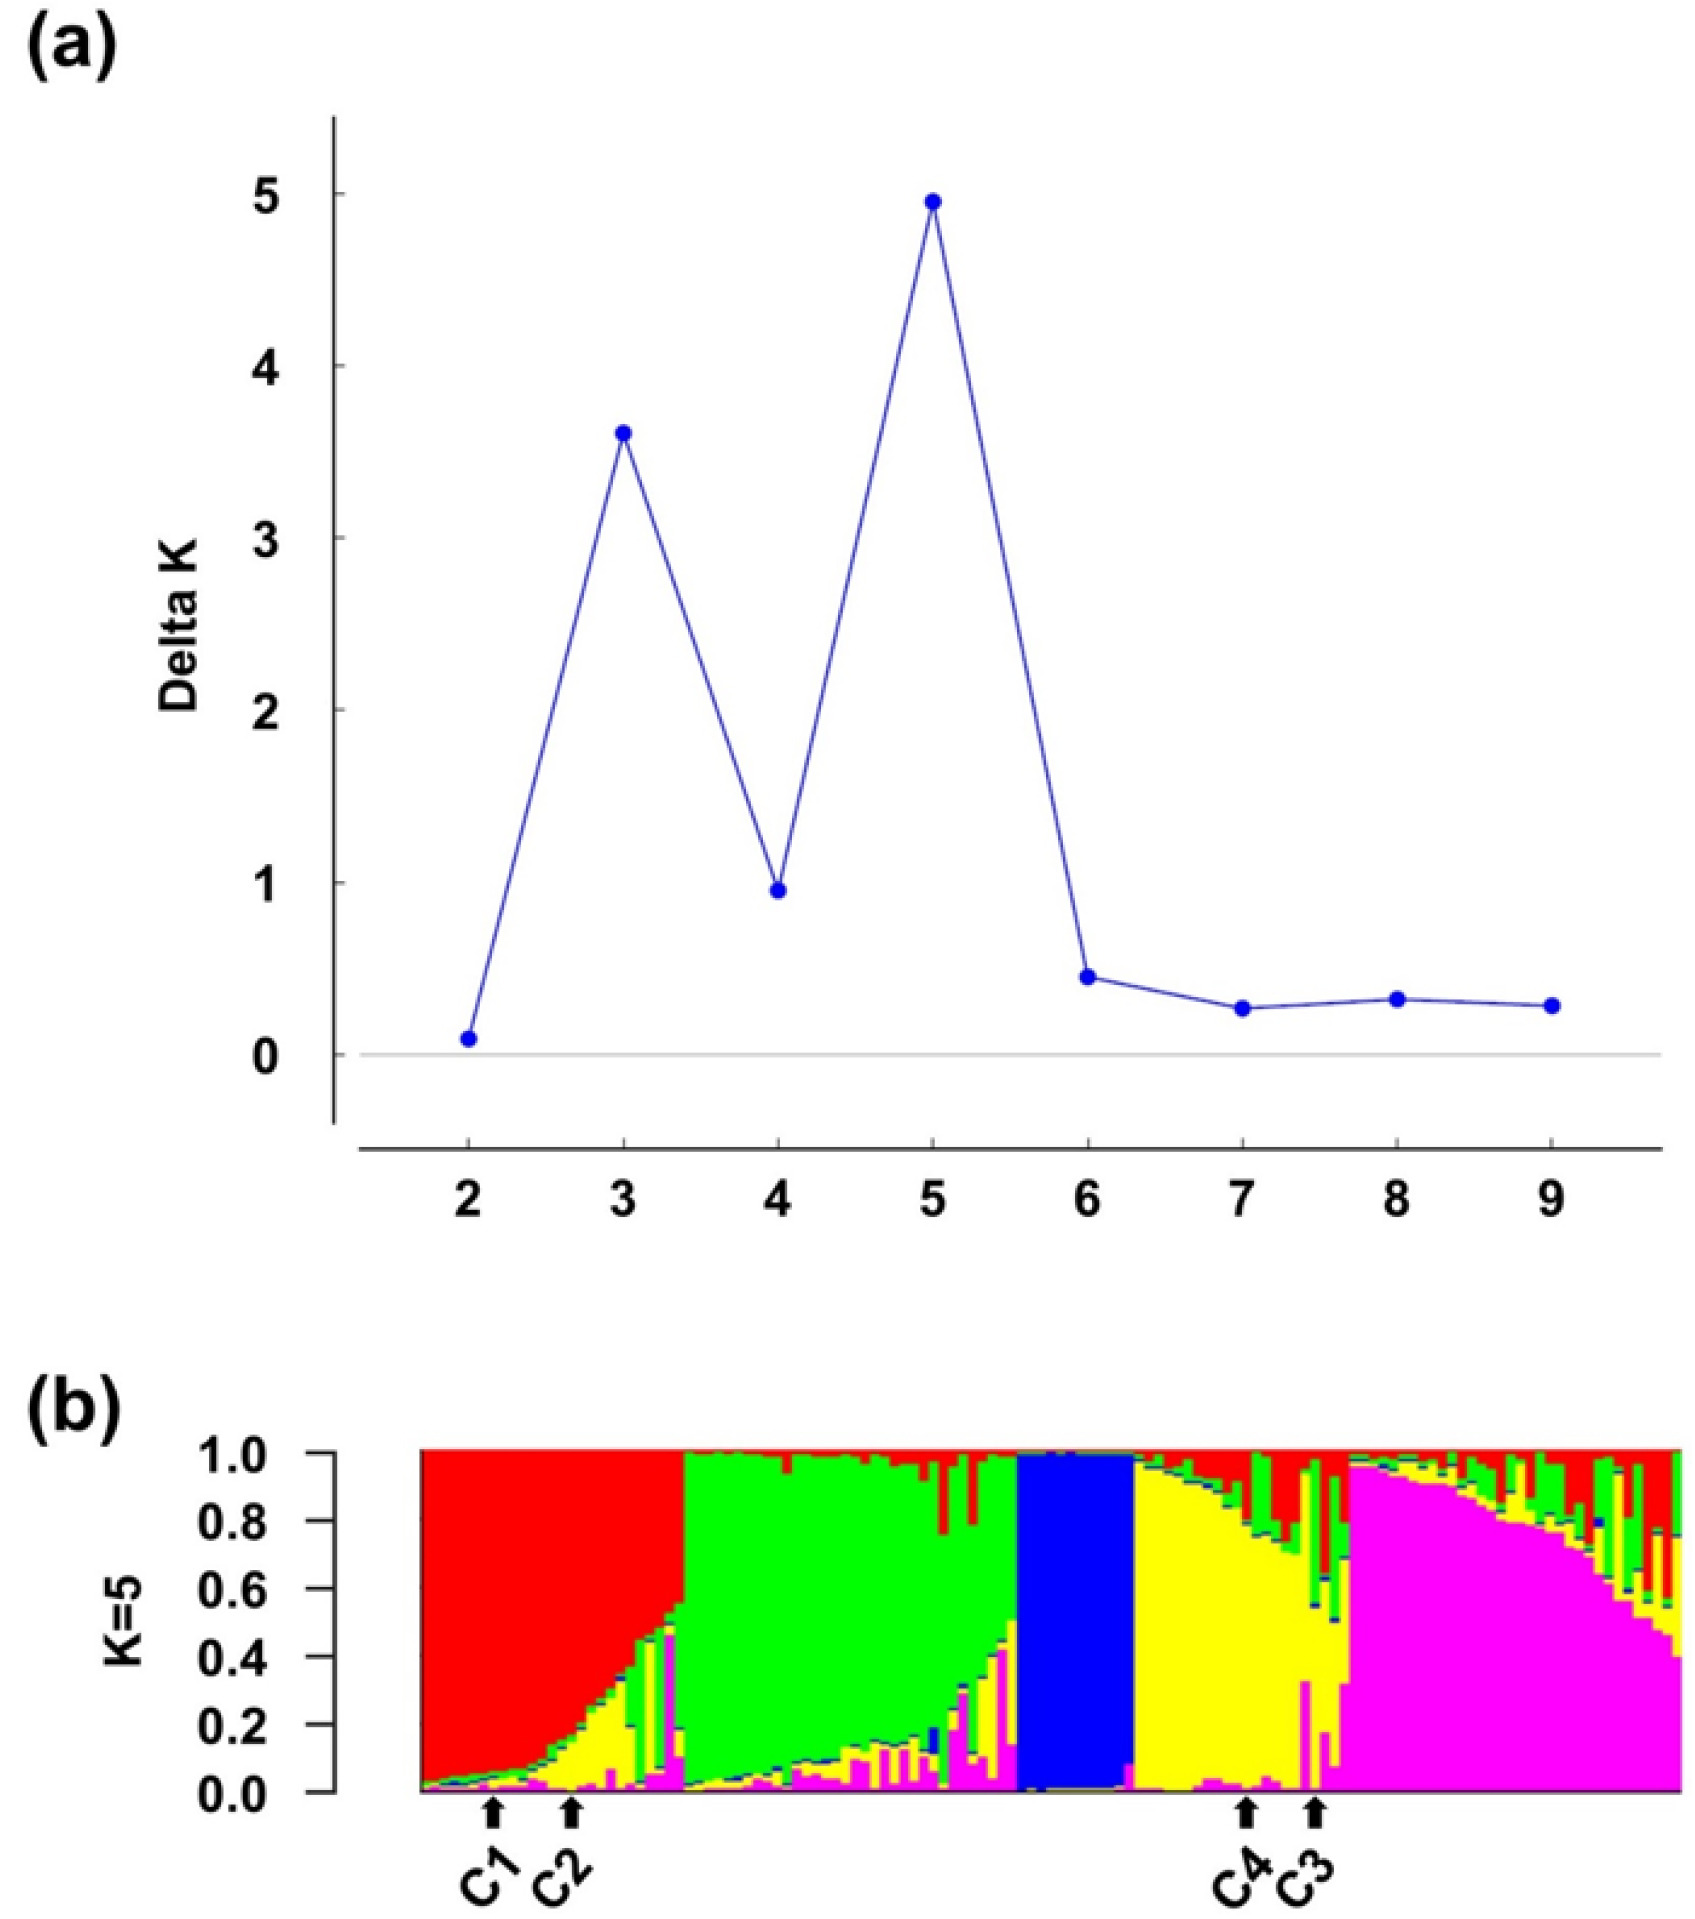
유전적 차이를 확인하기 위하여 PCR증폭 결과로 집단 구조를 분석하였다. 집단 개수의 범위는 2에서 9로 정하고 ΔK값을 구한 결과 K=5일 때 ΔK=4.957767로 가장 높았으며(
Fig. 2a), 집단구조를 K=5로 분석한 결과는 (
Fig. 2b)과 같다.
집단구조 분석을 통하여 각 자원들에 대한 조상 자원의 기여 정도 등을 알 수 있다(
Padhukasahasram 2014). 그 결과 미활용 129자원은 총 5개의 서로 다른 조상을 기원으로 유래되었음을 확인하였다.
추가로 계통발생분석 결과 5개 군집(cluster)으로 분석되었고 집단 구조분석 결과와 62.015%일치하였다. 100% 일치하지 않은 이유는 다른 군집(혹은 아집단)간 교배자원의 서로 다른 분석법에 의한 결과이다. 집단 간 교배자원으로 인한 분석 오차를 최소화 하고 군집 간 차이를 정확하게 관찰하기 위하여 집단구조분석의 아집단과 계통발생분석의 군집을 비교하여 동일하게 분포한 80자원을 선발하였다.
군집(cluster) 간의 농업형질 차이 및 유전적 차이
밀 80자원의 군집 별 농업형질을 살펴본 결과 파종 후 출수일에서는 군집 4가 169.6일±7.3일로 가장 빨랐고, 군집 5가 194.8일± 9.4일로 가장 늦었다. 파종 후 성숙일은 파종 후 출수일과 동일하게 군집 4가 212.0일±6.3일로 가장 빨랐고, 군집 5가 228.9일±9.5일로 가장 늦었다. 간장은 군집 3이 80.9 cm±15.7 cm로 가장 짧았고, 5가 120.5 cm±24.8 cm로 가장 길었으며, 수장도 간장과 마찬가지로 군집 3이 8.3 cm±1.2 cm로 가장 짧았고, 군집 5가 11.4 cm±7.2 cm로 가장 길었다(
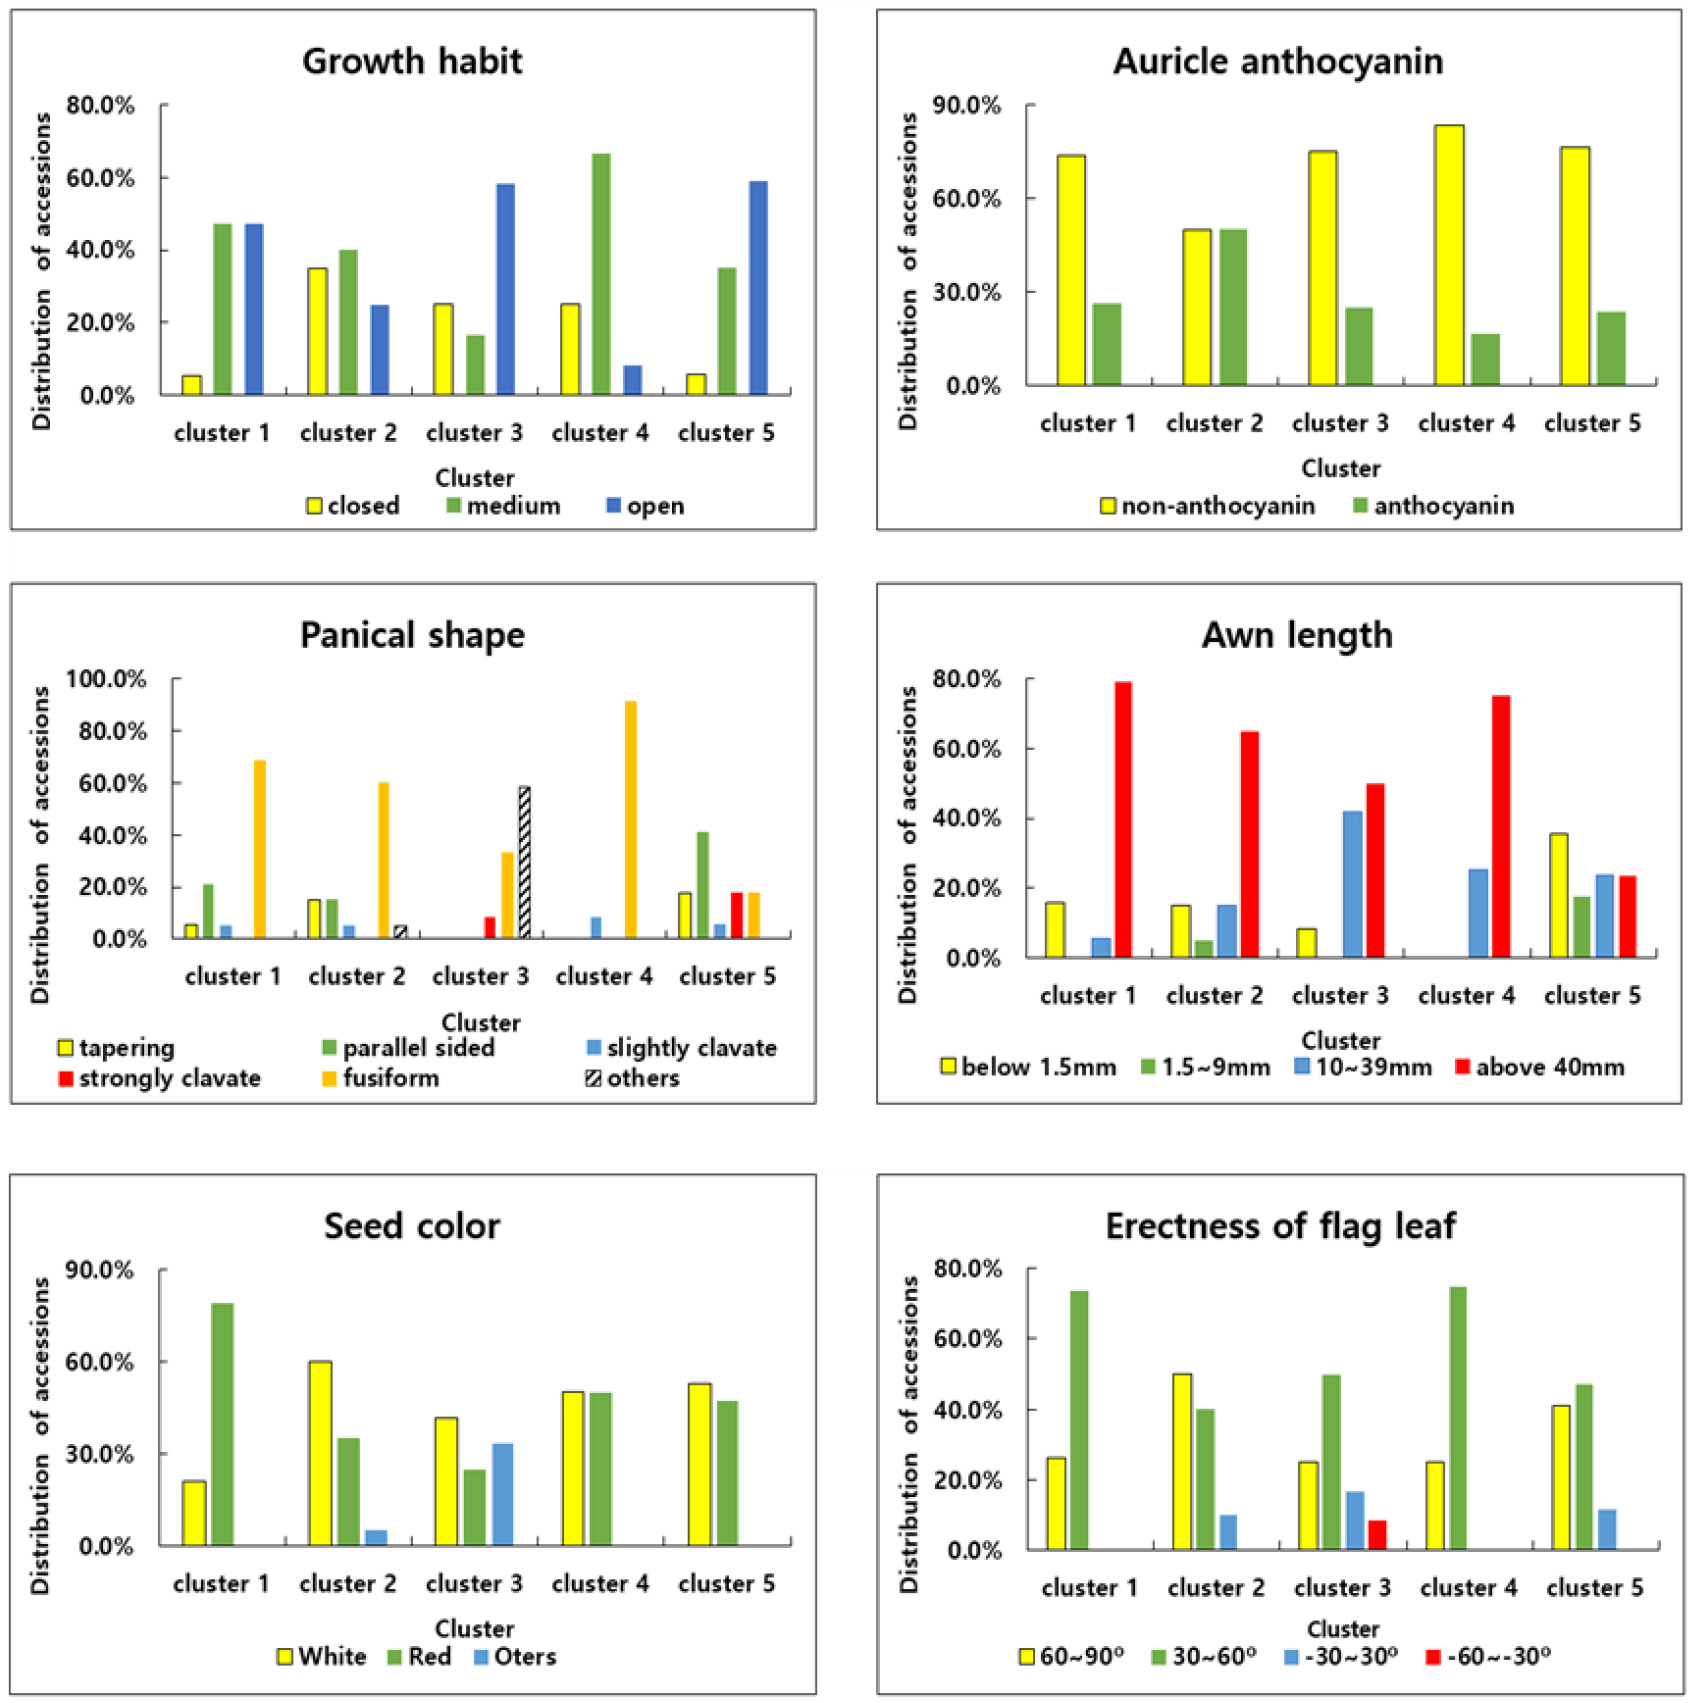
Table 6). 식물체 생장 습성에서는 군집 1~5까지 각각 중간 및 개(동일, 47.4%), 중간(40.0%), 개(58.3%), 중간(66.7%), 개(58.8%)로 가장 많았고, 엽이 안토시아닌 유무는 군집 2에서만 ‘유’와 ‘무’가 반반, 나머지 군집 에서는 약80%의 자원이 ‘무’이었다. 이삭형태에서는 군집 3이 기타(58%), 군집 5가 봉형(41%), 나머지 군집 1, 2, 4 는 방추형(60~90%)이 가장 많았고, 망장은 군집 1~4에서 40 mm이상이 50% 이상으로 가장 많았고, 군집 5에서만 1.5 mm이하가 35%로 제일 많았다. 종실색은 군집 순서 별로 적립(78.9%), 백립(60.0%), 백립(41.7%), 백립 및 적립(각 50%), 백립(52.9%)이 가장 많았고, 지엽 직립성에서는 군집 순서 별로 30~60°(73.7%), 60~90°(50.0%), 30~60° (50.0%), 30~60° (75.0%), 30~60°(47.1%)이 가장 많았다. 군집 별로 파종 후 출수일, 파종 후 성숙일, 수장, 간장의 분포를 던컨의 다중검정법으로 분석한 결과 군집 5는 파종 후 출수일, 파종 후 성숙일, 수장, 간장 모두에서 다른 군집과 유의하게 차이가 있었고, 군집 1과 4는 출수기 외에는 차이가 없었다. 또한 군집 5는 수형과 망장, 군집 3은 종실색, 지엽직립성이 다른 군집과 상이하였다(
Fig. 3).
Pairwise Fst는 집단 간의 유전적 분화 정도를 보여준다(
Table 7). 아집단 1은 다른 아집단과 매우 큰 유전적 차이를 나타내었고 아집단 2, 3, 4, 5는 서로 중간 정도의 유전적 차이를 보였다. 군집 별 Nei's 유전자 다양성 지수 (
Nei 1973)와 6가지 유전적 다양성 지수(
Supplementary Table 1) 에서 군집 5의 유전적 다양성이 제일 높고 군집 4의 유전적 다양성이 제일 낮았다.
고 찰
미활용 밀 유전자원의 원산지는 한국과 미상을 포함하여 총 70여개국이고 광범위한 표현형 다양성을 보였다. 대조자원은 대부분의 형질에서 특정값에 밀집된 것을 볼 수 있는데, 이는 대조자원이 다 국내품종이기 때문에 나타난 결과로 분석된다(
Tables 3,
4). 국내 품종은 국내 재배환경에 적합하고 소비자들의 수요에 맞게 개발되었기 때문에 목표에 맞는 값 또는 방향으로 밀집될 수 밖에 없다(
Kim et al. 2020).
미활용 집단과 활용집단 간 농업형질을 비교한 결과 망장과 식물체 생장습성에서 차이가 큰 것을 볼 수 있다(
Table 4,
Supplementary Fig. 1). 식물체 생장습성은 재배법이 개발되면서 보이는 현상으로 보인다. 밀은 일반적으로 벼 답리작의 후작으로 재배되기 때문에 습해를 방지할 수 있고, 노동력 절감효과도 크며 수량성도 높은 세조파로 재배하는 것이 가장 효율적이다(
RDA 2020). 따라서 초형이 직립형에 가까울수록 밀식이 가능하고, 수량성을 확보할 수 있다. 또한 세조파는 식물체가 균일하다는 전제 하에 광합성 효율이 높은데, 식물체가 넓게 퍼지는 생장습성 ‘개’(개장형) 자원은 잎을 가림으로써 광합성효율이 낮고 수량도 낮을 수 있다(
Innes & Blackwell 1983). 따라서 식물체 생장습성 ‘개’자원의 활용이 낮은 것으로 생각된다.
망장은 몇배체 밀이냐에 따라 유망과 무망의 분포가 다르다. 일반적으로 2배체 밀에서는 전부 유망, 4배체 밀에서는 거의 다 유망에 일부 밀에서 무망, 6배체 밀에서도 대부분 유망이지만 4배체 밀보다 무망의 비율이 높다(
Watkins & Ellerton 1940). 이러한 망의 유무는 수발아 및 수량성과 연관이 있는데, 유망 자원이 무망 자원보다 최대 30%이상 이삭의 수분흡수율이 높으며, 이는 종실의 수분흡수율 증가로 이어져 수발아 발생 빈도를 높이게 된다(
King & Richards 1984). 또한 망장은 종자의 폭, 길이, 천립중과 정의 상관관계임을 확인하였다(
Shin et al. 2013). 활용 집단은 PCA분포에서 밀집한 것을 볼 수 있고 미활용 자원의 범위를 완전히 포함하지 않았다. 또한 표현형이 유사할 지라도 유전형은 그렇지 않을 수 있는데 표현형은 다양한 유전자와 경로를 통하여 결정되기 때문이다. 따라서 육종소재는 유전적 배경이 다양한 자원들을 선발하여 육종하는 것이 생물 및 비생물적 저항성 강화 등 목표형질 개선에 더 효율적이다(
Son et al. 2021). 그러므로 앞으로의 밀 기능성 유전자 발굴이나 육종소재 선발에는 표현형을 떠나서 활용사례가 없는 미활용 자원의 활용도 고려할 필요가 있다.
대조 자원들은 집단 구조 분석과 계통발생 분석에서 5개 군집 중 군집 1, 4로 분석되었다(
Fig. 2b). 기존연구를 보면 FISH (Fluorescence in situ hybridization analysis)분석으로 한국원산 자원이 2개의 다른 그룹으로 밀집되는 것을, 이와 유사한 결과로 생각된다(
Yang et al. 2021). 파종 후 출수일, 파종 후 성숙일은 군집 5가 가장 늦고. 군집 1의 간장과 수장이 가장 짧았다. 따라서 군집 5는 벼와 이모작을 하는 국내 재배환경에 부적합하며, 간장과 수장도 제일 길어 도복에 취약할 것으로 생각된다(
Table 6). 군집 1, 4는 파종 후 출수일, 파종 후 성숙일, 간장, 수장에서 표준편차가 작았는데 90% 이상이 한국 자원(대조 품종 포함)으로 구성되어 있다(
Table 6). 이는 군집 1, 4의 조상 자원이 원래부터 한국 재배 환경에 적합한 자원이라고 생각되며. 대조자원들도 군집 1, 4로 구분되었다. 이는 육종소재 선발 시 한국재배 적합 자원과 개선하고자 하는 형질이 우수한 자원을 교배하여 품종을 만들기 때문에 대조자원이 한국재배에 적합한 자원과 같은 군집으로 구분되었다 생각된다(
Fig. 2b).
군집 별 유전적 분화차이와 농업형질을 비교 시, 군집 5가 유전적 분화에서 다른 군집과 차이가 컸고 농업형질에서는 수형, 망장에서 다른 군집과 차이를 보였다(
Table 7,
Fig. 3). 본 실험은 일부 자원을 나누어 노지에서 2년간('19-'20년도, '20-'21년도) 재배하며 농업형질을 조사하였는데 노지 재배는 환경에 영향을 많이 받아 연차간 변이가 발생할 수 있다. 따라서 동일한 자원을 반복해서 재배하거나 나누어 심을 시 환경에 대한 조절이 가능하도록 실내에서 재배한다면 연차간 변이로 인한 오차를 최소화하고 더 정확한 분석 결과를 얻을 수 있다고 생각한다.
추가로 한국자원의 군집 별 분포를 보면 군집 1에 94.6% (18/19자원), 군집 2에 10% (2/20자원), 군집 3에 0% (0/12자원), 군집 4에 100% (12/12자원), 군집 5에 12% (2/17자원)이다. 군집 1, 4는 96.7% (30/31자원)가 한국자원으로 구성되어 있다(
Table 1). 특히 군집 1, 4의 자원들은 특정 SSR 마커의 증폭산물 크기에 따라 한국원산 30자원으로만 구성이 되었다(
Supplementary Table 2). 이 결과는 SSR마커가 원산지 미상 자원들의 한국원산 여부룰 확인하는 하나의 효율적인 도구로써 가능성을 제시하였다고 생각된다.
향후 연구에서는 모든 밀 유전자원의 표현형 자료와 유전자형 자료를 통합하여 육종가가 직접 적합한 연구재료를 선발할 수 있도록 정보제공을 통한 기반마련에 주력할 것이다.
적 요
본 연구에서는 활용집단과 미활용집단의 표현형 및 유전형 다양성을 비교하였다. 미활용 밀 자원 1,514자원의 농업형질을 조사한 결과 형질 별로 다양하게 분포하였고, 활용 밀 자원8,878자원과 농업형질로 PCA분석한 결과 두 집단의 분포가 일치하지 않았다. 미활용 밀에서 핵심집단(모집단의 95.6%), 한국원산 및 대조자원 129자원을 선발, 24개 분자마커를 이용한 집단구조 분석에서 5개로 구분되었고, 그루, 금강, 조경, 우리를 포함한 한국원산자원 대부분이 아집단 1, 4로 구분되었다. 아집단 1과 아집단 2, 3, 4, 5는 매우 큰 유전적 차이를 나타내었으며 아집단 5의 유전적 다양성이 제일 높고 아집단 4의 유전적 다양성이 제일 낮았다. 군집 2, 3, 5는 군집 1, 4 (그루, 금강, 조경, 우리 포함)와 농업형질의 차이가 확인되었다. 본 연구는 미활용 밀 자원의 육종소재로서 가능성을 제시하여 밀 육종산업과 학계의 발전에 기여할 것으로 생각된다.화하고 체계화하는 것이 매우 중요한 과제로 판단된다.
보충자료
사 사
본 연구는 농촌진흥청 연구사업(공동과제명: 소량 저활력 밀 유전자원 증식 및 기초특성조사, 과제번호: PJ014242022021)에 의해 이루어진 것임.
Fig. 1Ten agronomic trait statistics of unused wheat germplasms. The position of the control group was marked, Geuru (C1), Geumgang (C2), Uri (C3), and Jokyoung (C4).
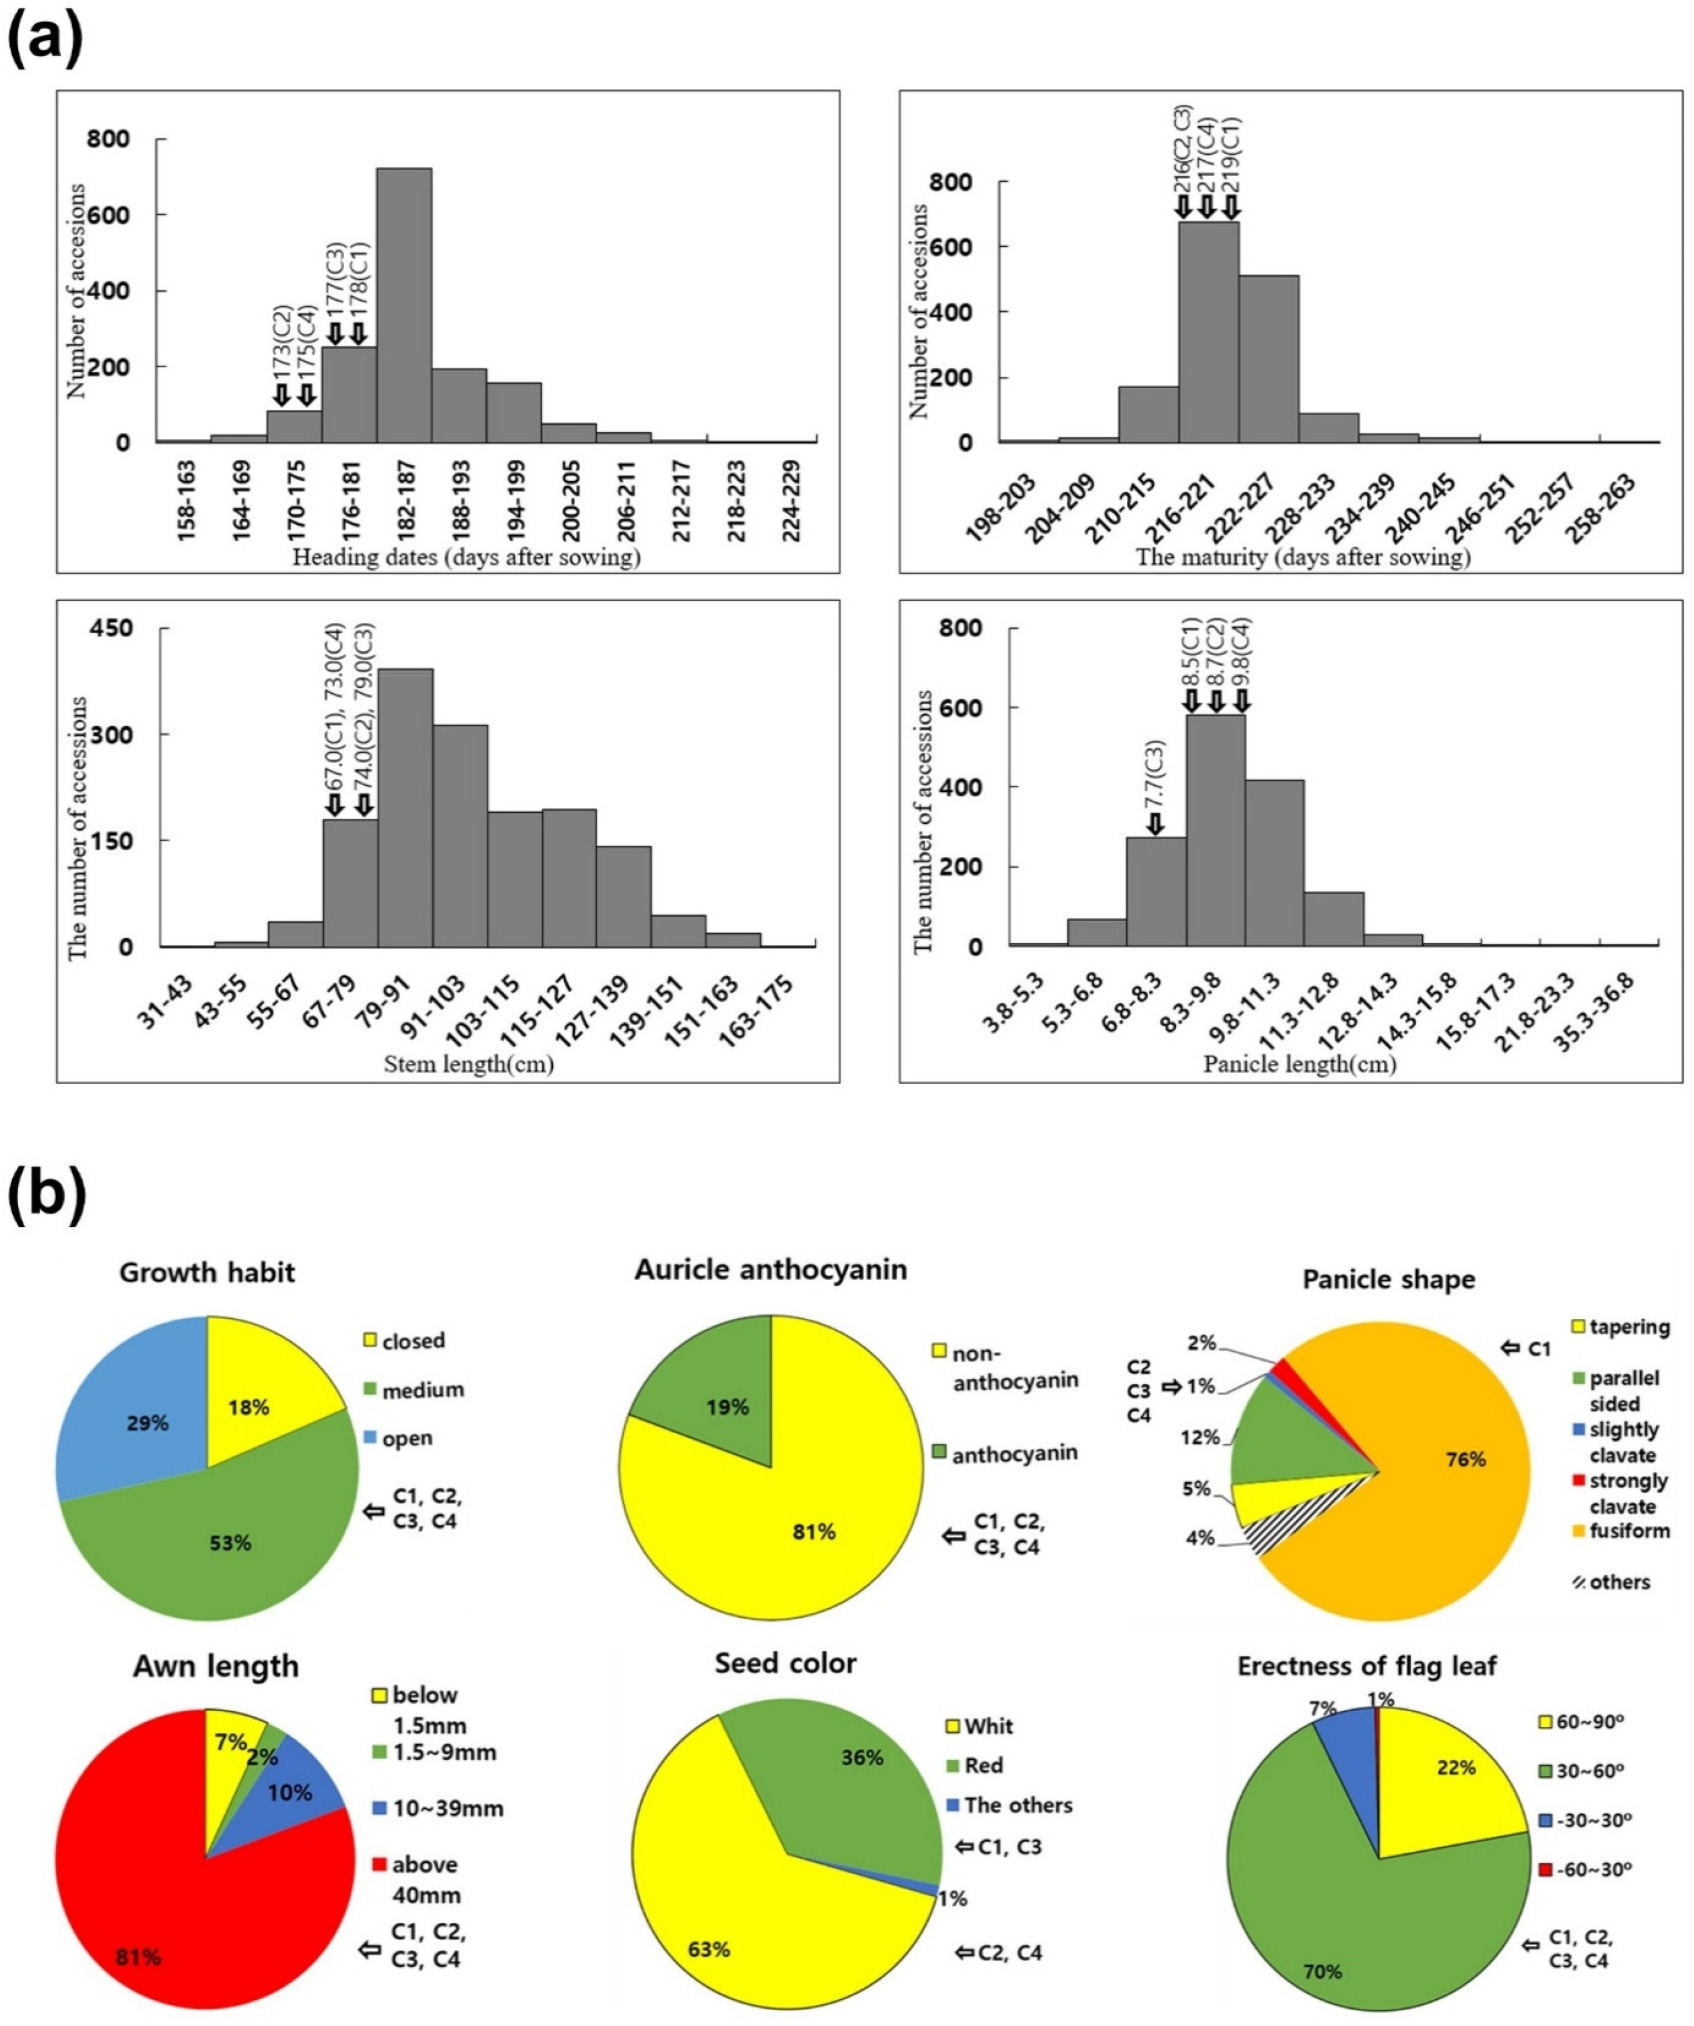
Fig. 2The results of unused wheat germplasms population structure. (a) is analysis to range of K (2~9) used Delta K. (b) is population structure on K=5. The position of the control group was marked, Geuru (C1), Geumgang (C2), Uri (C3), and Jokyoung (C4). Red, cluster 1; green, cluster 2; blue, cluster 3; yellow, cluster 4; and pink, cluster 5.
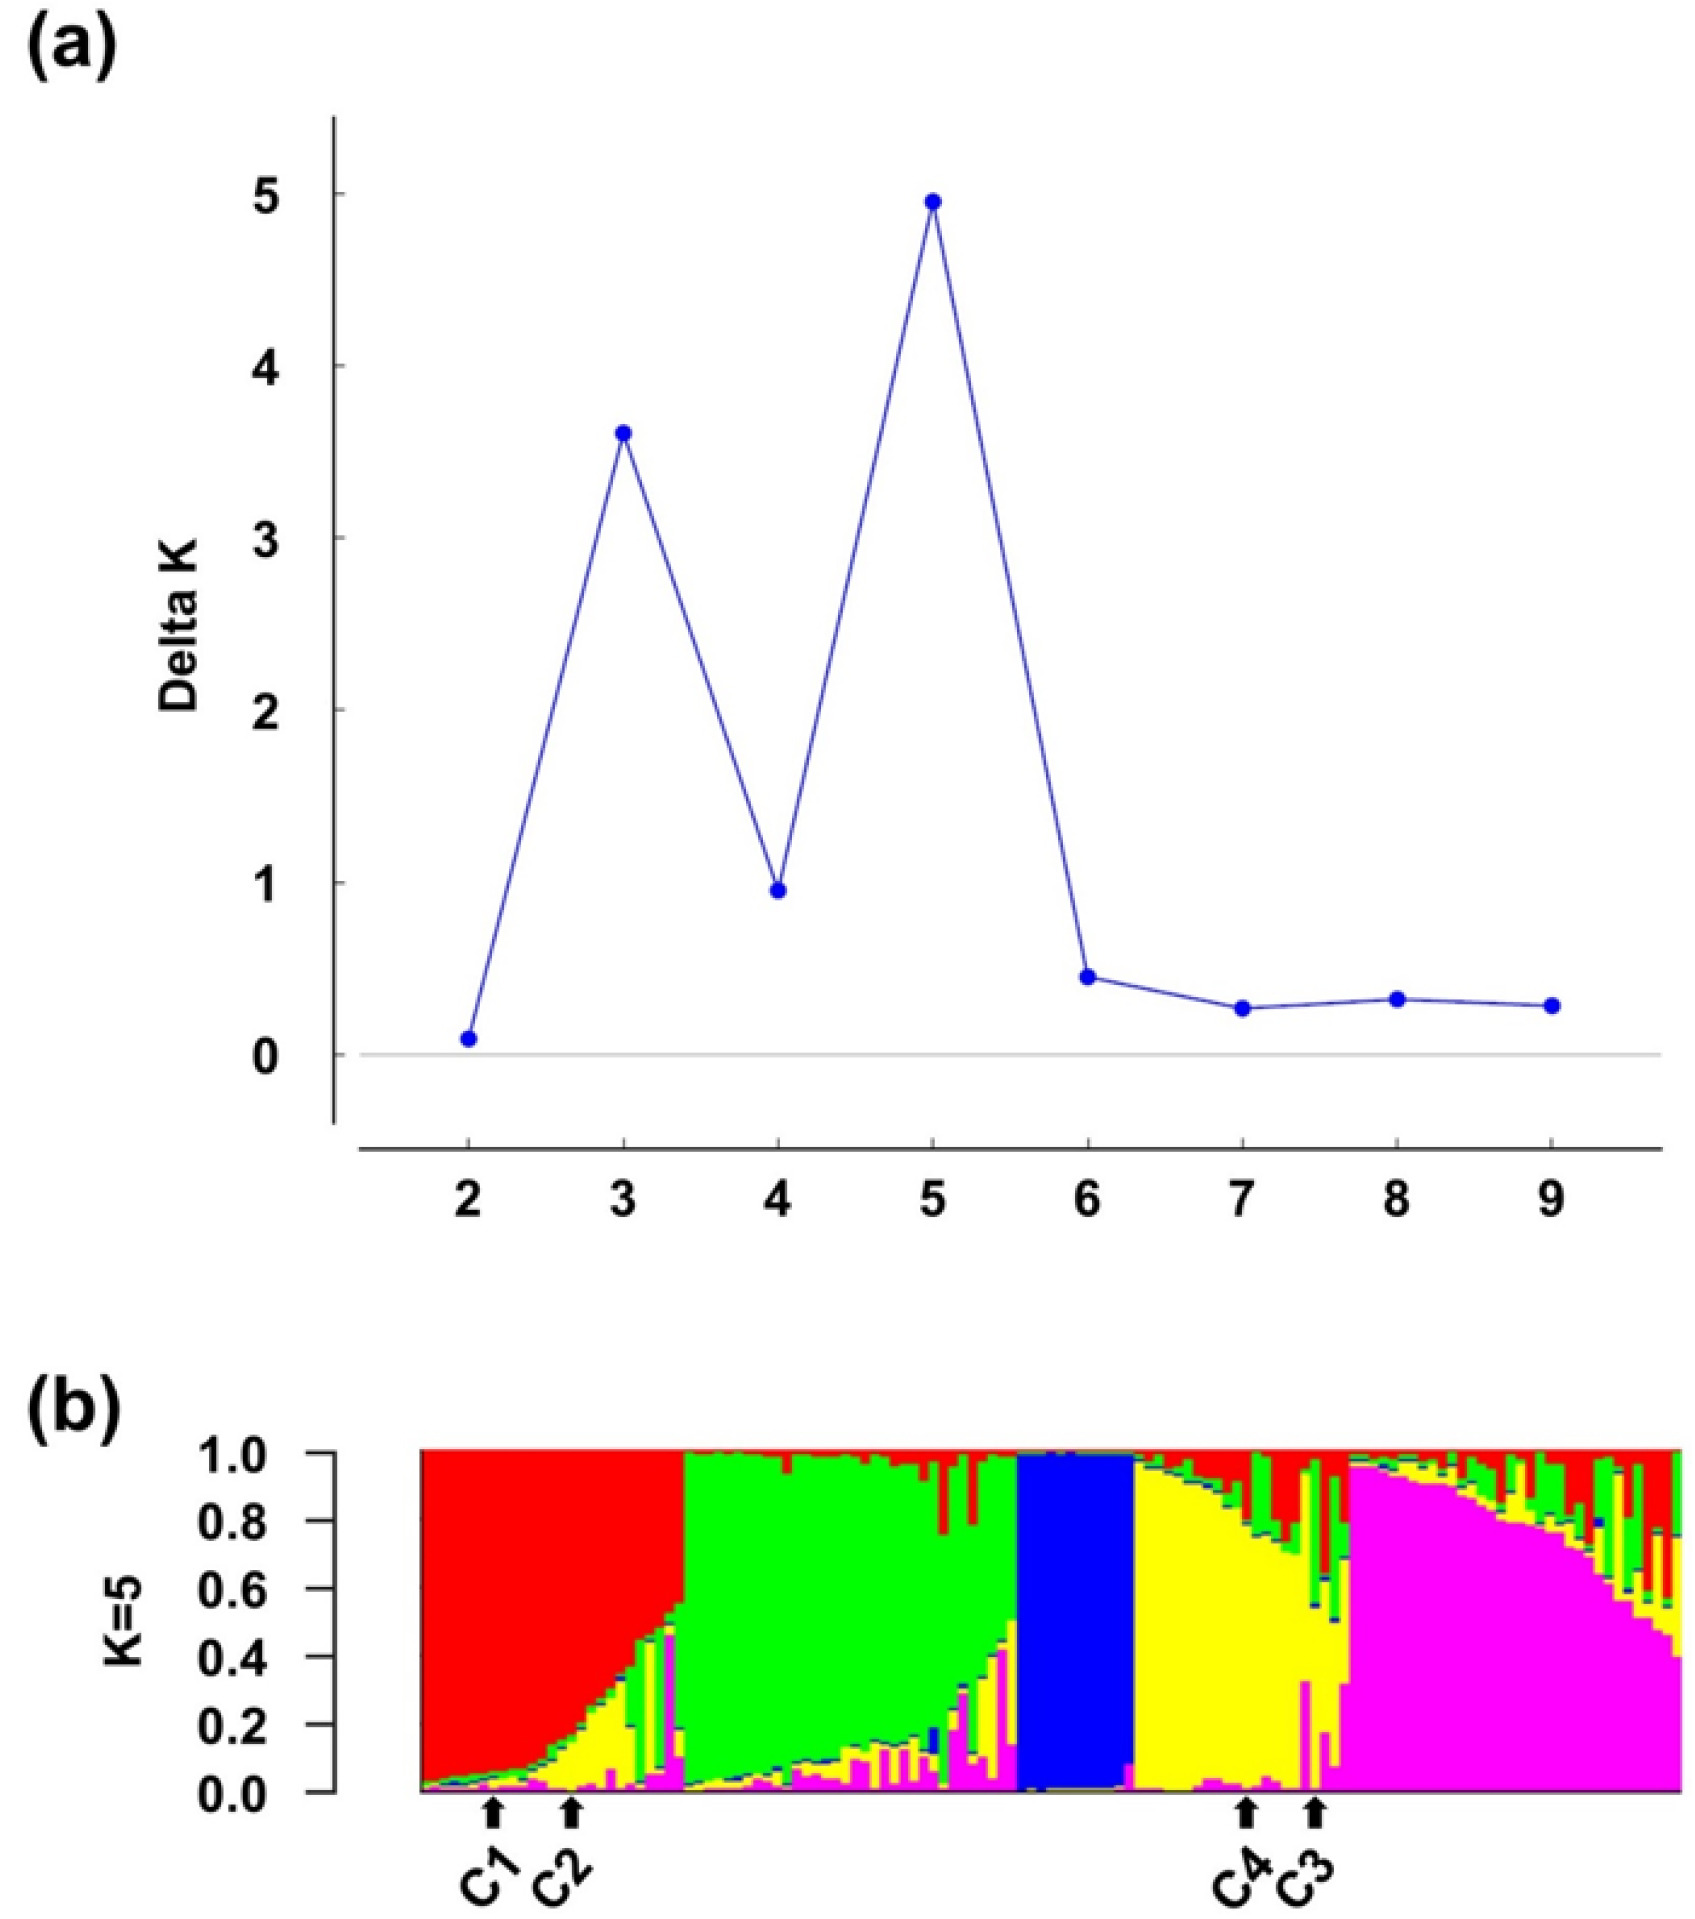
Fig. 3The difference between each cluster in six qualitative traits.
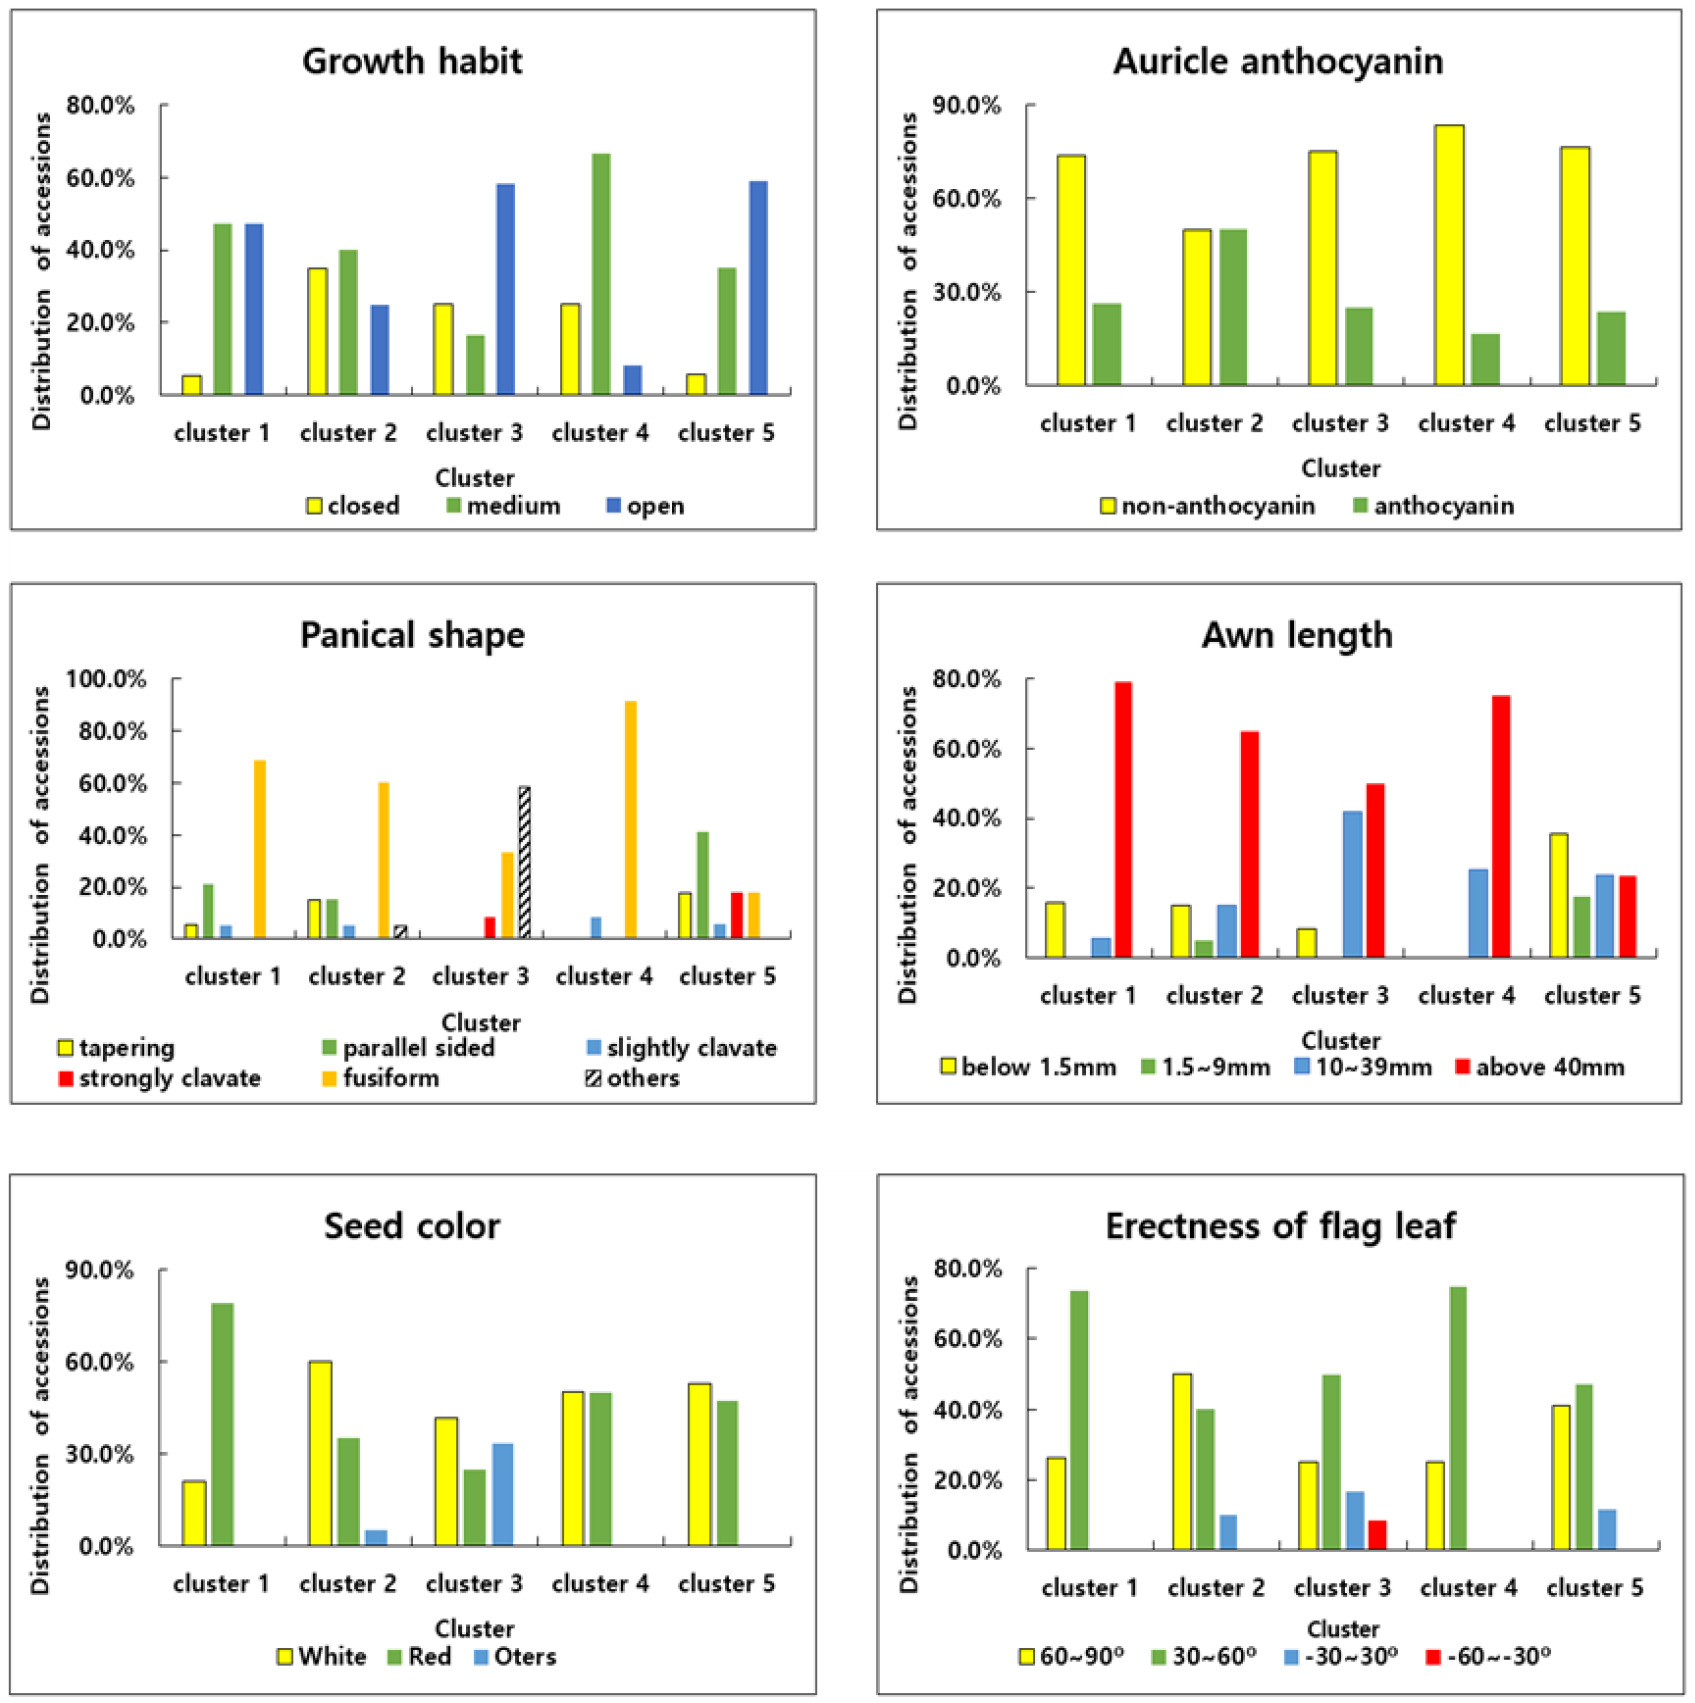
Table 1The list of selected 129 germplasms.
Table 1
|
No. |
Accession No. |
Originz
|
Popy
|
Clux
|
|
1 |
10753 |
KOR |
1 |
1 |
|
2 |
10761 |
KOR |
1 |
- |
|
3 |
10772 |
KOR |
1 |
1 |
|
4 |
10774 |
KOR |
1 |
1 |
|
5 |
10803 |
KOR |
1 |
1 |
|
6 |
10912 |
KOR |
1 |
- |
|
7 |
10913 |
KOR |
1 |
- |
|
8 |
10916 |
KOR |
1 |
- |
|
9 |
11066 |
GEO |
2 |
2 |
|
10 |
11189 |
FIN |
5 |
- |
|
11 |
12247 |
KOR |
1 |
- |
|
12 |
12381 |
UNK |
2 |
- |
|
13 |
12477 |
BIH |
2 |
- |
|
14 |
12551 |
PRT |
2 |
2 |
|
15 |
12570 |
BRA |
2 |
- |
|
16 |
12649 |
ESP |
5 |
5 |
|
17 |
12843 |
HUN |
2 |
2 |
|
18 |
12858 |
YUG |
2 |
2 |
|
19 |
12935 |
TKM |
2 |
- |
|
20 |
12942 |
MDA |
2 |
- |
|
21 |
13004 |
UKR |
5 |
- |
|
22 |
13882 |
KOR |
1 |
1 |
|
23 |
14302 |
KOR |
4 |
- |
|
24 |
14307 |
KOR |
4 |
- |
|
25 |
14330 |
KOR |
1 |
1 |
|
26 |
14402 |
KOR |
2 |
2 |
|
27 |
14923 |
MEX |
2 |
- |
|
28 |
15482 |
KOR |
1 |
1 |
|
29 |
15537 |
KOR |
5 |
- |
|
30 |
15543 |
KOR |
1 |
- |
|
31 |
15552 |
KOR |
4 |
- |
|
32 |
15553 |
KOR |
5 |
- |
|
33 |
15560 |
KOR |
5 |
- |
|
34 |
15567 |
KOR |
1 |
- |
|
35 |
15577 |
KOR |
5 |
- |
|
36 |
16834 |
KOR |
4 |
4 |
|
37 |
16842 |
KOR |
4 |
4 |
|
38 |
100984 |
KOR |
5 |
- |
|
39 |
116142 |
KOR |
1 |
- |
|
40 |
116197 |
KOR |
1 |
1 |
|
41 |
116202 |
KOR |
5 |
5 |
|
42 |
116203 |
KOR |
1 |
1 |
|
43 |
116206 |
KOR |
1 |
1 |
|
44 |
116209 |
KOR |
4 |
- |
|
45 |
116210 |
KOR |
4 |
4 |
|
46 |
116267 |
KOR |
4 |
4 |
|
47 |
137030 |
NPL |
5 |
- |
|
48 |
146983 |
KOR |
1 |
1 |
|
49 |
147028 |
KOR |
1 |
1 |
|
50 |
147032 |
KOR |
4 |
4 |
|
51 |
147052 |
KOR |
1 |
1 |
|
52 |
147072 |
KOR |
4 |
4 |
|
53 |
147077 |
KOR |
4 |
- |
|
54 |
147206 |
KOR |
4 |
4 |
|
55 |
147273 |
KOR |
4 |
4 |
|
56 |
147275 |
KOR |
4 |
4 |
|
57 |
147277 |
KOR |
4 |
4 |
|
58 |
147279 |
KOR |
4 |
- |
|
59 |
150577 |
UNK |
2 |
2 |
|
60 |
151076 |
KOR |
1 |
1 |
|
61 |
172225 |
KOR |
1 |
1 |
|
62 |
173162 |
KOR |
2 |
2 |
|
63 |
175574 |
KOR |
4 |
4 |
|
64 |
176600 |
ITA |
5 |
5 |
|
65 |
176631 |
ISR |
2 |
2 |
|
66 |
176786 |
AUS |
2 |
2 |
|
67 |
178884 |
ZAF |
2 |
- |
|
68 |
180668 |
EGY |
3 |
3 |
|
69 |
187153 |
SYR |
3 |
3 |
|
70 |
187218 |
THA |
2 |
2 |
|
71 |
188131 |
AZE |
3 |
3 |
|
72 |
189924 |
TJK |
5 |
- |
|
73 |
194614 |
MNG |
5 |
5 |
|
74 |
196318 |
CHN |
5 |
5 |
|
75 |
198645 |
ROM |
5 |
5 |
|
76 |
205688 |
ARM |
2 |
- |
|
77 |
205757 |
CSK |
2 |
- |
|
78 |
206106 |
BEL |
4 |
- |
|
79 |
206270 |
RUS |
5 |
- |
|
80 |
206300 |
BLR |
2 |
- |
|
81 |
206682 |
KOR |
1 |
1 |
|
82 |
209956 |
UZB |
3 |
3 |
|
83 |
251106 |
JPN |
4 |
- |
|
84 |
269480 |
KOR |
4 |
- |
|
85 |
269483 |
KOR |
5 |
5 |
|
86 |
284901 |
IND |
2 |
2 |
|
87 |
312053 |
AFG |
1 |
1 |
|
88 |
323382 |
PAK |
2 |
2 |
|
89 |
323409 |
BGR |
5 |
5 |
|
90 |
333284 |
GBR |
5 |
5 |
|
91 |
333285 |
FRA |
5 |
5 |
|
92 |
333293 |
LTU |
5 |
5 |
|
93 |
333294 |
BOL |
2 |
2 |
|
94 |
333296 |
JOR |
2 |
- |
|
95 |
333301 |
POL |
5 |
5 |
|
96 |
333390 |
IRQ |
3 |
3 |
|
97 |
333407 |
TUN |
3 |
3 |
|
98 |
909058 |
LBN |
3 |
3 |
|
99 |
K015784 |
PRK |
5 |
- |
|
100 |
K015785 |
KOR |
5 |
- |
|
101 |
K155155 |
UNK |
3 |
3 |
|
102 |
K155229 |
UNK |
3 |
3 |
|
103 |
K155239 |
IRN |
3 |
3 |
|
104 |
K164152 |
CAN |
2 |
- |
|
105 |
K164262 |
SWE |
5 |
5 |
|
106 |
K164554 |
USA |
2 |
2 |
|
107 |
K176105 |
AUT |
5 |
- |
|
108 |
K212020 |
NLD |
5 |
5 |
|
109 |
K223677 |
DNK |
5 |
5 |
|
110 |
K224554 |
MLI |
5 |
- |
|
111 |
K261485 |
COL |
2 |
2 |
|
112 |
K261488 |
CHL |
2 |
2 |
|
113 |
K261527 |
ARG |
2 |
2 |
|
114 |
K264032 |
URY |
2 |
2 |
|
115 |
K264037 |
BGD |
2 |
2 |
|
116 |
K264053 |
DEU |
5 |
5 |
|
117 |
K264055 |
PER |
2 |
- |
|
118 |
K264064 |
PER |
5 |
- |
|
119 |
K264084 |
ERI |
3 |
3 |
|
120 |
K264094 |
ETH |
3 |
3 |
|
121 |
K264241 |
MEX |
2 |
2 |
|
122 |
K269896 |
SRB |
5 |
5 |
|
123 |
K269974 |
TUR |
5 |
- |
|
124 |
K270024 |
KAZ |
2 |
- |
|
125 |
K270039 |
CHE |
5 |
- |
|
126 |
Geuru (C1) |
KOR |
1 |
1 |
|
127 |
Geumgang(C2) |
KOR |
1 |
1 |
|
128 |
Uri(C3) |
KOR |
4 |
4 |
|
129 |
Jokyoung(C4) |
KOR |
4 |
- |
Table 2The list of selected 24 SSR markers from 106.
Table 2
|
Name |
Forward Primer |
Reverse Primer |
Product sizez
|
Anneal Temp. |
|
barc21 |
GCGTCTTCCGGTTTTGTTTACTTTTC |
CGTCTTCCGGTTTTGTTTACTTTTC |
220 bp |
62℃ |
|
Xbarc80 |
CGAATTAGCATCTGCATCTGTTTGAG |
CGGTCAACCAACTACTGCACAAC |
112 bp |
66℃ |
|
Xcfa2155 |
TTTGTTACAACCCAGGGGG |
TTGTGTGGCGAAAGAAACAG |
221 bp |
60℃ |
|
Xcfd152 |
TGGAAGTCTGGAACCACTCC |
GCAACCAGACCACACTCTCA |
288 bp |
60℃ |
|
Xcfd29 |
GGTTGTCAGGCAGGATATTTG |
TATTGATAGATCAGGGCGCA |
181 bp |
60℃ |
|
Xcfd33 |
TACCGCAATAATCACACCCA |
GGTCGATGGACTGTCCCTAA |
170 bp |
60℃ |
|
Xcfd48 |
ATGGTTGATGGTGGGTGTTT |
ATGTATCGATGAAGGGCCAA |
258 bp |
64℃ |
|
Xcfd8 |
ACCACCGTCATGTCACTGAG |
GTGAAGACGACAAGACGCAA |
156 bp |
60℃ |
|
Xgwm161 |
GATCGAGTGATGGCAGATGG |
TGTGAATTACTTGGACGTGG |
154 bp |
60℃ |
|
Xgwm190 |
GTGCTTGCTGAGCTATGAGTC |
GTGCCACGTGGTACCTTTG |
213 bp |
60℃ |
|
Xgwm294 |
GGATTGGAGTTAAGAGAGAACCG |
GCAGAGTGATCAATGCCAGA |
100 bp |
60℃ |
|
Xgwm304 |
AGGAAACAGAAATATCGCGG |
AGGACTGTGGGGAATGAATG |
217 bp |
60℃ |
|
Xgwm325 |
TTTCTTCTGTCGTTCTCTTCCC |
TTTTTACGCGTCAACGACG |
138 bp |
58℃ |
|
Xgwm437 |
GATCAAGACTTTTGTATCTCTC |
GATGTCCAACAGTTAGCTTA |
107 bp |
55℃ |
|
Xgwm539 |
CTGCTCTAAGATTCATGCAACC |
GAGGCTTGTGCCCTCTGTAG |
145 bp |
60℃ |
|
Xgwm577 |
ATGGCATAATTTGGTGAAATTG |
TGTTTCAAGCCCAACTTCTATT |
133 bp |
60℃ |
|
Xgwm610 |
CTGCCTTCTCCATGGTTTGT |
AATGGCCAAAGGTTATGAAGG |
167 bp |
60℃ |
|
Xwmc1 |
ACTGGGTGTTTGCTCGTTGA |
CAATGCTTAAGCGCTCTGTG |
154 bp |
60℃ |
|
Xwmc264 |
CTCCATCTATTGAGCGAAGGTT |
CAAGATGAAGCTCATGCAAGTG |
133 bp |
64℃ |
|
Xwmc278 |
AAACGATAGTAAAATTACCTCGGAT |
TCAAAAAATAGCAACTTGAAGAC |
165 bp |
58℃ |
|
Xwmc428 |
TTAATCCTAGCCGTCCCTTTTT |
CGACCTTCGTTGGTTATTTGTG |
257 bp |
60℃ |
|
Xwmc457 |
CTTCCATGAATCAAAGCAGCAC |
CATCCATGGCAGAAACAATAGC |
161 bp |
60℃ |
|
Xwmc468 |
AGCTGGGTTAATAACAGAGGAT |
CACATAACTGTCCACTCCTTTC |
154 bp |
60℃ |
|
Xwmc532 |
GATACATCAAGATCGTGCCAAA |
GGGAGAAATCATTAACGAAGGG |
176 bp |
60℃ |
Table 3Four quantitative traits in accessions with each group.
Table 3
|
Traits |
Value |
Group |
|
1 |
2 |
3 |
4 |
Total |
|
HD |
Range |
158-225 |
125-222 |
159-229 |
173-178 |
125-229 |
|
Mean±SD |
185.349±8.162z
|
192.228±10.757y
|
200.044±17.093x
|
175.75±1.92w
|
191.278±10.778 |
|
CV |
0.044 |
0.056 |
0.085 |
0.011 |
0.056 |
|
Skewness |
0.768 |
-0.896 |
0.125 |
-0.278 |
-0.599 |
|
Kurtosis |
1.614 |
2.447 |
-0.865 |
-1.427 |
1.804 |
|
TM |
Range |
198-260 |
168-261 |
208-268 |
216-219 |
168-268 |
|
Mean±SD |
220.739±6.079z
|
227.716±8.471y
|
235.75±16.612x
|
217±1.225w
|
226.755±8.637 |
|
CV |
0.028 |
0.037 |
0.070 |
0.006 |
0.038 |
|
Skewness |
0.938 |
-1.039 |
0.312 |
0.816 |
-0.613 |
|
Kurtosis |
4.680 |
3.268 |
-1.272 |
-1.000 |
2.372 |
|
SL |
Range |
31-163.9 |
12-628 |
46-148.5 |
66.5-78.5 |
12-628 |
|
Mean±SD |
100.189±21.467z
|
103.23±23.975y
|
77.412±16.07x
|
72.875±4.263x
|
102.611±23.7 |
|
CV |
0.214 |
0.232 |
0.208 |
0.058 |
0.231 |
|
Skewness |
0.422 |
1.426 |
1.217 |
-0.261 |
1.314 |
|
Kurtosis |
-0.349 |
25.496 |
3.877 |
-0.992 |
22.730 |
|
PL |
Range |
3.8-36.8 |
0.8-19 |
6.7-13.5 |
7.65-9.8 |
0.8-36.8 |
|
Mean±SD |
9.388±1.792z
|
9.752±2.033y
|
9.175±1.509z
|
8.65±0.766z
|
9.695±2.001 |
|
CV |
0.191 |
0.208 |
0.164 |
0.089 |
0.206 |
|
Skewness |
2.732 |
0.445 |
0.497 |
0.288 |
0.698 |
|
Kurtosis |
37.567 |
0.616 |
-0.280 |
-1.000 |
3.936 |
Table 4Percentage of phenotypic distribution of six quality traits in each group.
Table 4
|
Traits |
Categories |
Group |
|
|
1 |
2 |
3 |
4 |
Total(%) |
|
GH |
closed |
18.560 |
98.513 |
48.529 |
0.000 |
86.583 |
|
medium |
52.840 |
1.408 |
41.176 |
100.000 |
9.146 |
|
open |
28.600 |
0.079 |
10.294 |
0.000 |
4.272 |
|
AA |
anthocyanin |
19.353 |
28.599 |
11.765 |
0.000 |
27.141 |
|
non-anthocyanin |
80.647 |
71.401 |
88.235 |
100.000 |
72.859 |
|
PS |
fusiform |
76.552 |
28.666 |
25.000 |
25.000 |
35.570 |
|
others |
3.699 |
0.034 |
0.000 |
0.000 |
0.564 |
|
parallel sided |
12.285 |
36.382 |
25.000 |
0.000 |
32.808 |
|
slightly clavate |
0.661 |
2.760 |
13.235 |
75.000 |
2.552 |
|
strongly clavate |
2.048 |
1.543 |
1.471 |
0.000 |
1.615 |
|
tapering |
4.756 |
30.615 |
35.294 |
0.000 |
26.892 |
|
SC |
red |
35.601 |
66.310 |
57.353 |
50.000 |
61.802 |
|
the others |
1.189 |
19.047 |
41.176 |
0.000 |
16.600 |
|
white |
63.210 |
14.643 |
1.471 |
50.000 |
21.598 |
|
AL |
1.5~9 mm |
2.312 |
24.341 |
45.588 |
0.000 |
21.282 |
|
10 mm~39 mm |
10.106 |
4.472 |
11.765 |
0.000 |
5.333 |
|
above 40 mm |
80.713 |
52.670 |
41.176 |
100.000 |
56.670 |
|
below 1.5 mm |
6.869 |
18.518 |
1.471 |
0.000 |
16.714 |
|
EF |
-30~30° |
6.869 |
6.195 |
14.706 |
0.000 |
6.346 |
|
30~60° |
70.542 |
60.115 |
69.118 |
100.000 |
61.697 |
|
-60~-30° |
0.396 |
0.000 |
0.000 |
0.000 |
0.057 |
|
60~90° |
22.193 |
33.690 |
16.176 |
0.000 |
31.900 |
Table 5The information of the selected 24 SSR markers.
Table 5
|
Locus |
Naz
|
Hy
|
PICx
|
MAFw
|
|
gwm190 |
10 |
0.774 |
0.752 |
0.411 |
|
gwm437 |
14 |
0.901 |
0.894 |
0.194 |
|
gwm577 |
15 |
0.879 |
0.868 |
0.249 |
|
wmc278 |
8 |
0.556 |
0.522 |
0.636 |
|
Xbarc21 |
9 |
0.731 |
0.706 |
0.466 |
|
Xbarc80 |
7 |
0.532 |
0.501 |
0.659 |
|
Xcfa2155 |
8 |
0.704 |
0.655 |
0.411 |
|
Xcfd152 |
13 |
0.797 |
0.771 |
0.311 |
|
Xcfd29 |
21 |
0.932 |
0.928 |
0.125 |
|
Xcfd33 |
7 |
0.722 |
0.674 |
0.349 |
|
Xcfd48 |
13 |
0.809 |
0.784 |
0.28 |
|
Xcfd8 |
11 |
0.755 |
0.723 |
0.396 |
|
Xgwm161 |
10 |
0.687 |
0.653 |
0.497 |
|
Xgwm294 |
20 |
0.912 |
0.906 |
0.14 |
|
Xgwm304 |
15 |
0.888 |
0.878 |
0.202 |
|
Xgwm325 |
10 |
0.831 |
0.81 |
0.256 |
|
Xgwm539 |
25 |
0.918 |
0.912 |
0.156 |
|
Xgwm610 |
10 |
0.8 |
0.771 |
0.295 |
|
Xwmc1 |
9 |
0.793 |
0.764 |
0.303 |
|
Xwmc264 |
10 |
0.817 |
0.791 |
0.233 |
|
Xwmc428 |
13 |
0.615 |
0.587 |
0.59 |
|
Xwmc457 |
6 |
0.556 |
0.509 |
0.621 |
|
Xwmc468 |
15 |
0.868 |
0.855 |
0.249 |
|
Xwmc532 |
13 |
0.875 |
0.863 |
0.225 |
|
Mean |
12.167 |
0.777 |
0.753 |
0.344 |
Table 6The difference between each cluster quantitative traits.
Table 6
|
Cluster |
Heading date
(days) |
The maturity
(days) |
Stem length
(cm) |
Panicle length
(cm) |
|
1 |
177.2±10.2z
|
216.8±7.1zy
|
80.9±15.7z
|
8.3±1.2z
|
|
2 |
183.1±12.7z
|
221.9±11z
|
91.8±24.6bz
|
9.3±1.9zy
|
|
3 |
184.1±8.0z
|
219.5±7.7zy
|
105.3±30.5yx
|
8.5±2.5z
|
|
4 |
169.6±7.3y
|
212.0±6.3y
|
83.3±4.5z
|
8.4±0.6z
|
|
5 |
194.8±9.4x
|
228.9±9.5x
|
120.5±24.8y
|
11.4±7.2y
|
Table 7The genetic differentiation between each 5 clusters by Pairwise Fst.
Table 7
|
cluster 1 |
cluster 2 |
cluster 3 |
cluster 4 |
cluster 5 |
Gene diversity |
|
cluster 1 |
- |
|
|
|
|
0.546875 |
|
cluster 2 |
0.34523 |
- |
|
|
|
0.670343 |
|
cluster 3 |
0.361857 |
0.122308 |
- |
|
|
0.624829 |
|
cluster 4 |
0.348075 |
0.120699 |
0.084887 |
- |
|
0.639807 |
|
cluster 5 |
0.327794 |
0.063218 |
0.082207 |
0.095055 |
- |
0.743512 |
References
- 1. Ahmed H, Khan AS, Khan SH, Kashif M. 2017. Genome wide allelic pattern and genetic diversity of spring wheat genotypes through SSR markers. Int J Agric Biol 19: 1559-1565.
- 2. Bedő Z, Láng L. 2015. Wheat breeding: current status and bottlenecks. In Alien introgression in wheat. Springer, Cham: pp. 77-101.
- 3. Earl DA, VonHoldt BM. 2012. Structure harvester: a website and program for visualizing structure output and implementing the Evanno method. Conserv Genet Resour 4: 359-361.
- 4. Genesys. 2021. https://www.genesys-pgr.org/
- 5. Hajjar R, Jarvis DI, Gemmill-Herren B. 2008. The utility of crop genetic diversity in maintaining ecosystem services. Agric Ecosyst Environ 123: 261-270.
- 6. Howell TA, Steiner JL, Schneider AD, Evett SR. 1995. Evapotranspiration of irrigated winter wheat-Southern high plains. T Asae 38: 745-759.
- 7. Huang X, Börner A, Röder M, Ganal M. 2002. Assessing genetic diversity of wheat (Triticum aestivum L.) germplasm using microsatellite markers. Theor Appl Genet 105: 699-707.
- 8. Hughes AR, Stachowicz JJ. 2004. Genetic diversity enhances the resistance of a seagrass ecosystem to disturbance. P NATL ACAD SCI USA 101: 8998-9002.
- 9. Innes P, Blackwell R. 1983. Some effects of leaf posture on the yield and water economy of winter wheat. J Agric Sci 101: 367-376.
- 10. Jarvis DI, Padoch C, Cooper HD. 2007. Managing biodiversity in agricultural ecosystems. Columbia University Press, New York: pp. 492-
- 11. Kang CS, Kim KH, Seo YW, Woo SH, Heo MR, Choo BK, Hyun JN, Kim KJ, Park CS. 2014. Current regional cultural situation and evaluation of grain characteristics of Korean wheat. I. Survey of production practices in Korean wheat cultivar growers by region. Korean J Breed Sci 59: 1-15.
- 12. Kang TG, Kim KM, Kang SW, Kang CS, Chun J, Park CS, Cho SW. 2020. Mapping of QTL for spike length in doubled haploid population of Korean wheats. Korean J Breed Sci 52: 104-114.
- 13. Kim KM, Kang CS, Kim YK, Kim KH, Park JH, Yoon YM, Park HH, Jeong HY, Choi CH, Park J. 2020. Past and current status, and prospect of winter cereal crops research for food and forage in Korea. Korean J Breed Sci 52: 73-92.
- 14. Kim KW, Chung HK, Cho GT, Ma KH, Chandrabalan D, Gwag JG, Park YJ. 2007. PowerCore: a program applying the advanced M strategy with a heuristic search for establishing core sets. Bioinformatics 23: 2155-2162.
- 15. Kim YK, Lee MJ, Kim KH, Park JH, Park TI, Yoon YM, Choi CH, Son JH, Kang CS. 2018. Waxy black barley (Hordeum vulgare L.) cultivar,'Heuksoojeongchal', with high yield and low amylose content. Korean J Breed Sci 50: 504-509.
- 16. King R, Richards R. 1984. Water uptake in relation to pre-harvest sprouting damage in wheat: ear characteristics. Aust J Agr Res 35: 327-336.
- 17. Kobayashi S, Yoshida T. 2005. Identification of main paddy rice cultivars in Tochigi prefecture [Japan] by RAPD analysis. JPN J Crop Sci 74: 207-211.
- 18. Kumar S, Stecher G, Li M, Knyaz C, Tamura K. 2018. MEGA X: molecular evolutionary genetics analysis across computing platforms. Mol Biol Evol 35: 1547-1549.
- 19. Letunic I, Bork P. 2021. Interactive Tree Of Life (iTOL) v5: an online tool for phylogenetic tree display and annotation. Nucleic Acids Res 49: 293-296.
- 20. Liu K, Muse SV. 2005. PowerMarker: an integrated analysis environment for genetic marker analysis. Bioinformatics 21: 2128-2129.
- 21. Meza FJ, Silva D. 2009. Dynamic adaptation of maize and wheat production to climate change. Climatic Change 94: 143-156.
- 22. Ministry of Agriculture, F. a. R. a. M.2020. Agriculture, food and rular affair statics.
- 23. NAC (National Agrobiodiversity center). 2021. http://genebank.rda.go.kr/
- 24. Nei M. 1973. Analysis of gene diversity in subdivided populations. P Natl Acad Sci USA 70: 3321-3323.
- 25. Padhukasahasram B. 2014. Inferring ancestry from population genomic data and its applications. Front Genet 5: 204
- 26. Pritchard JK, Stephens M, Donnelly P. 2000. Inference of population structure using multilocus genotype data. Genetics 155: 945-959.
- 27. Rauf S, Da Silva JT, Khan AA, Naveed A. 2010. Consequences of plant breeding on genetic diversity. Int J Plant Breed 4: 1-21.
- 28. Salehi M, Arzani A, Talebi M, Rokhzadi A. 2018. Genetic diversity of wheat wild relatives using SSR markers. Genetika 50: 131-141.
- 29. Shin S, Kim K, Kang C, Park J, Hyun J, Park C. 2013. Effects of agronomic characteristics and grain morphology on pre-harvest sprouting in Korean wheat cultivar. Korean J Breed Sci 45: 346-357.
- 30. Somers D, Isaac P. 2004. Detection of DNA polymorphism, genetic diversity and genotype identification by using microsatellites in bread wheat (Triticum aestivum L.). Int J Sci and Engin Res 4: 2229-5518.
- 31. Son JH, Yang J, Kang CS, Kim KH, Kim KM, Jeong HY, Park J, Son JY, Park TI, Choi C. 2021. Annual analysis of the agronomic traits of global wheat germplasms in the Korean environment. Korean J Crop Sci 66: 120-129.
- 32. Song Q, Quigley C, Nelson R, Carter T, Boerma H, Strachan J, Cregan P. 1999. A selected set of trinucleotide simple sequence repeat markers for soybean cultivar identification. Plant Varieties and Seeds 12: 207-220.
- 33. Sun M, Choi K, Kim H, Song B, Woo S, Lee C, Jong S, Cho Y. 2009. Genetic diversity and discrimination of recently distributed Korean cultivars by SSR markers. Korean J Breed Sci 41: 115-125.
- 34. Sung B, Kim J, Jang G, Choi K, Kang C. 2014. Regional stability in heading date and yield character of wheat variety 'Keumkangmil'. J Korean Soc Int Agric
- 35. Tékeu H, Ngonkeu EM, Djocgoué FP, Ellis A, Lendzemo V, Springfield L, Moulin L, Klonowska A, Diouf D, Botes WC. 2017. Genetic diversity of Cameroonian bread wheat (Triticum aestivum L.) cultivars revealed by microsatellite markers. Afr J Biotechnol 16: 1832-1839.
- 36. Uchimura Y, Furusho M, Yoshida T. 2004. Identification of Japanese two-rowed barley cultivars by DNA markers. JPN J Crop Sci 73: 35-41.
- 37. Wang LX, Jun Q, Chang LF, Liu LH, Li HB, Pang BS, Zhao CP. 2015. Assessment of wheat variety distinctness using SSR markers. J Integr Agric 14: 1923-1935.
- 38. Watkins A, Ellerton S. 1940. Variation and genetics of the awn inTriticum. J Genet 40: 243-270.
- 39. Yang X, Tan B, Yang Y, Zhang X, Zhu W, Xu L, Wang Y, Zeng J, Fan X, Sha L, Zhang H, Wu D, Ma J, Chen G, Zhou Y, Kang H. 2021. Genetic diversity of Asian and European common wheat lines assessed by fluorescence in situ hybridization. Genome 64: 959-968.