적요
The use of digital cameras in plant phenotyping studies using RGB sensors has increased. However, the need for standardization has become apparent because of the diverse analytical approaches used by individual researchers. In this study, we optimized the image acquisition conditions for apples, including scaling tool positioning, lighting conditions, and background color selection. In addition, we developed an ImageJ-based automated image acquisition and analysis program. We generated 240 images of four apple cultivars (Hongan, Hongro, Fuji, and Hwangok) and used 12 image indices to analyze the fruit size, width, length, and shape. We measured the accuracy by comparing the results with actual measurements. Significantly high correlation values were observed between fruit width and the major index (R2=0.947-0.993) as well as between fruit length and the height index (R2=0.964-0.984) based on the analysis using R-squared values to assess accuracy. These findings are expected to enhance the efficiency of apple fruit sorting in the future and can be applied to investigate the shapes of other fruits.
서 언
사과(
Malus pumila Mill)는 장미목 장미과에 속하는 관속식물로서 전 세계적으로 약 6,500종 이상의 품종이 개발된 주요 과일에 하나이다(
Gencer & Serce 2022). 국내에서 육성된 사과 품종 중에는 대표적으로 ‘홍로’와 ‘감홍’이 있으며, 이중 ‘감홍’은 과실 당도가 극히 높고, 식미 품질이 우수하지만, 생리장해가 심해 국내 재배면적이 증가하지 못하고 있으며(
Kang et al. 2016,
Kweon et al. 2019), 대다수 사과 재배 농가에서는 전통적으로 많이 재배됐던 ‘후지’(부사)와 착색 품질이 우수한 ‘홍로’를 재배하고 있다(
Kwon et al. 2023). 이는 사과 과실을 포함한 과일을 구매하는 소비자의 구매 경향에 기인한 것으로, 대부분 소비자는 과실의 형태, 색상, 생리장해 및 병징 증상 유무와 같이 외부 형태적인 요소를 먼저 고려하여 구매 여부 및 가격을 판단하는 경향을 보이기 때문이다(
Jaeger et al. 2018). 따라서 생산자는 과실 선별 과정에서 외부 형태적인 요소를 주요 기준으로 활용하여 선별하지만, 작업에 따른 노동력과 시간이 많이 소요되며, 작업자 간에 편차가 존재하게 된다.
디지털육종으로의 전환 추세에 따라 국내외에서는 이미지 기반 표현체 기술을 농업연구 분야에 접목한 연구를 활발히 진행 중에 있다(
Jeon et al. 2023,
Sung 2015). 표현체 관련 연구는 기하급수적으로 증가하고 있지만, 대부분 모델 식물인 애기장대나 주요 작물인 벼, 밀에 치중 되어있고, 사과를 포함한 과실류의 경우 상대적으로 표현체 연구가 미진한 상황이다(
Costa et al. 2019,
Yang et al. 2020). 표현체 연구에 활용되는 이미지 센서에는 가시광(RGB), 근적외선(NIR), 초분광(Hyperspectral) 등의 영상 센서들을 활용하고 있으며, 이 영상 센서와 전자동 대량 분석 시스템을 도입하여 육종 연구에 활용한다(
Laraswati et al. 2021,
Tardieu et al. 2017). 국내에서도 주요 작물인 벼를 대상으로 형질을 고속, 대량으로 분석할 수 있는 시설을 국립농업과학원에서 구축하여 연구를 수행하고 있으며(
Lee et al. 2021), 추가적으로 방사선 돌연변이육종을 통한 유망 계통 신속 선발(한국원자력연구원) 시설과 과채류, 화훼류 원예작물 연구(국립원예특작과학원)를 위한 시설 등이 준공 완료되어 앞으로 표현체 연구 활성화가 기대된다. 하지만 대량 분석이 가능한 표현체 분석 시설들의 경우 초기 구축 비용이 많이 소요되어, 앞서 언급된 정부 기관이나 정부출연 연구기관과 같은 곳에서 가능하고, 개인 연구자 또는 육종가들은 현실적으로 도입하기 어려운 실정이다.
표현체 연구에 활용되는 영상 센서 중 가시광 센서는 일반 디지털카메라로 촬영이 가능하다는 장점이 있어 가장 많이 활용되고 있는 센서 중의 하나이다. 국내에서도 디지털카메라를 활용한 연구가 다수 보고되어 있으며(
Choi et al. 2020,
Lee et al. 2022), 사과 과실을 대상으로도 RGB 이미지를 기반으로 획득된 색상 정보로 당도 측정에 관한 연구가 수행되었다(
Kim 2020). 그러나 이런 디지털카메라를 활용한 표현체 연구는 각각의 연구기관 또는 연구자의 연구 환경에 맞춰 실험을 수행하다 보니 이미지 촬영 및 분석 기법이 표준화되지 않아 보고된 내용을 바탕으로 연구를 수행할 때 재현성이 낮아지는 단점이 있다.
따라서 본 연구에서는 표준화된 RGB 이미지 데이터 생산 및 분석 기법을 개발하고자, 디지털카메라로 이미지 촬영 시 조명을 포함한 촬영 환경별 이미지 추출 값을 비교하여 최적화 작업을 수행하였고, 이미지 데이터 분석은 오픈소스 프로그램인 imageJ 기반 자동 추출프로그램을 제작하여 분석에 활용하였다. 또한 프로그램에서 추출된 이미지 지표값의 정확도를 검증하기 위해 형태와 색상이 각기 다른 4개의 사과 품종을 대상으로 실측값과 비교하여 정확도를 검증하였다. 이 연구 결과는 향후 사과를 포함한 과실류 형태 분석 및 선별 과정에 활용 가능할 것이라 기대된다.
재료 및 방법
식물재료
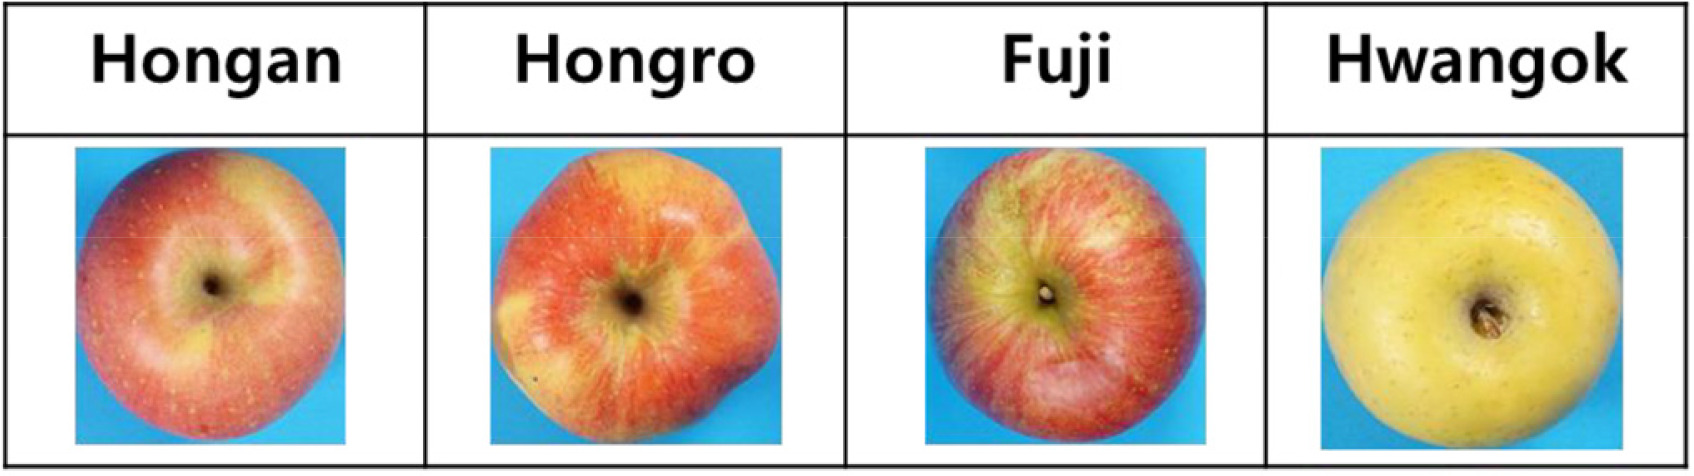
이미지 촬영 최적 조건을 확립하기 위한 실험에는 사과의 대표적인 품종인 후지를 이용하여 이미지 촬영 조건을 확인하였고, 확립된 이미지 촬영 조건을 바탕으로 제작된 이미지 데이터 자동 추출 프로그램 검증에는 사과 품종 간 차이를 비교하기 위해 홍안(Hongan), 홍로(Hongro), 후지(Fuji), 황옥(Hwangok) 4품종을 이용하여 형태 분석 및 실측값 비교 분석을 수행하였다(
Fig. 1).
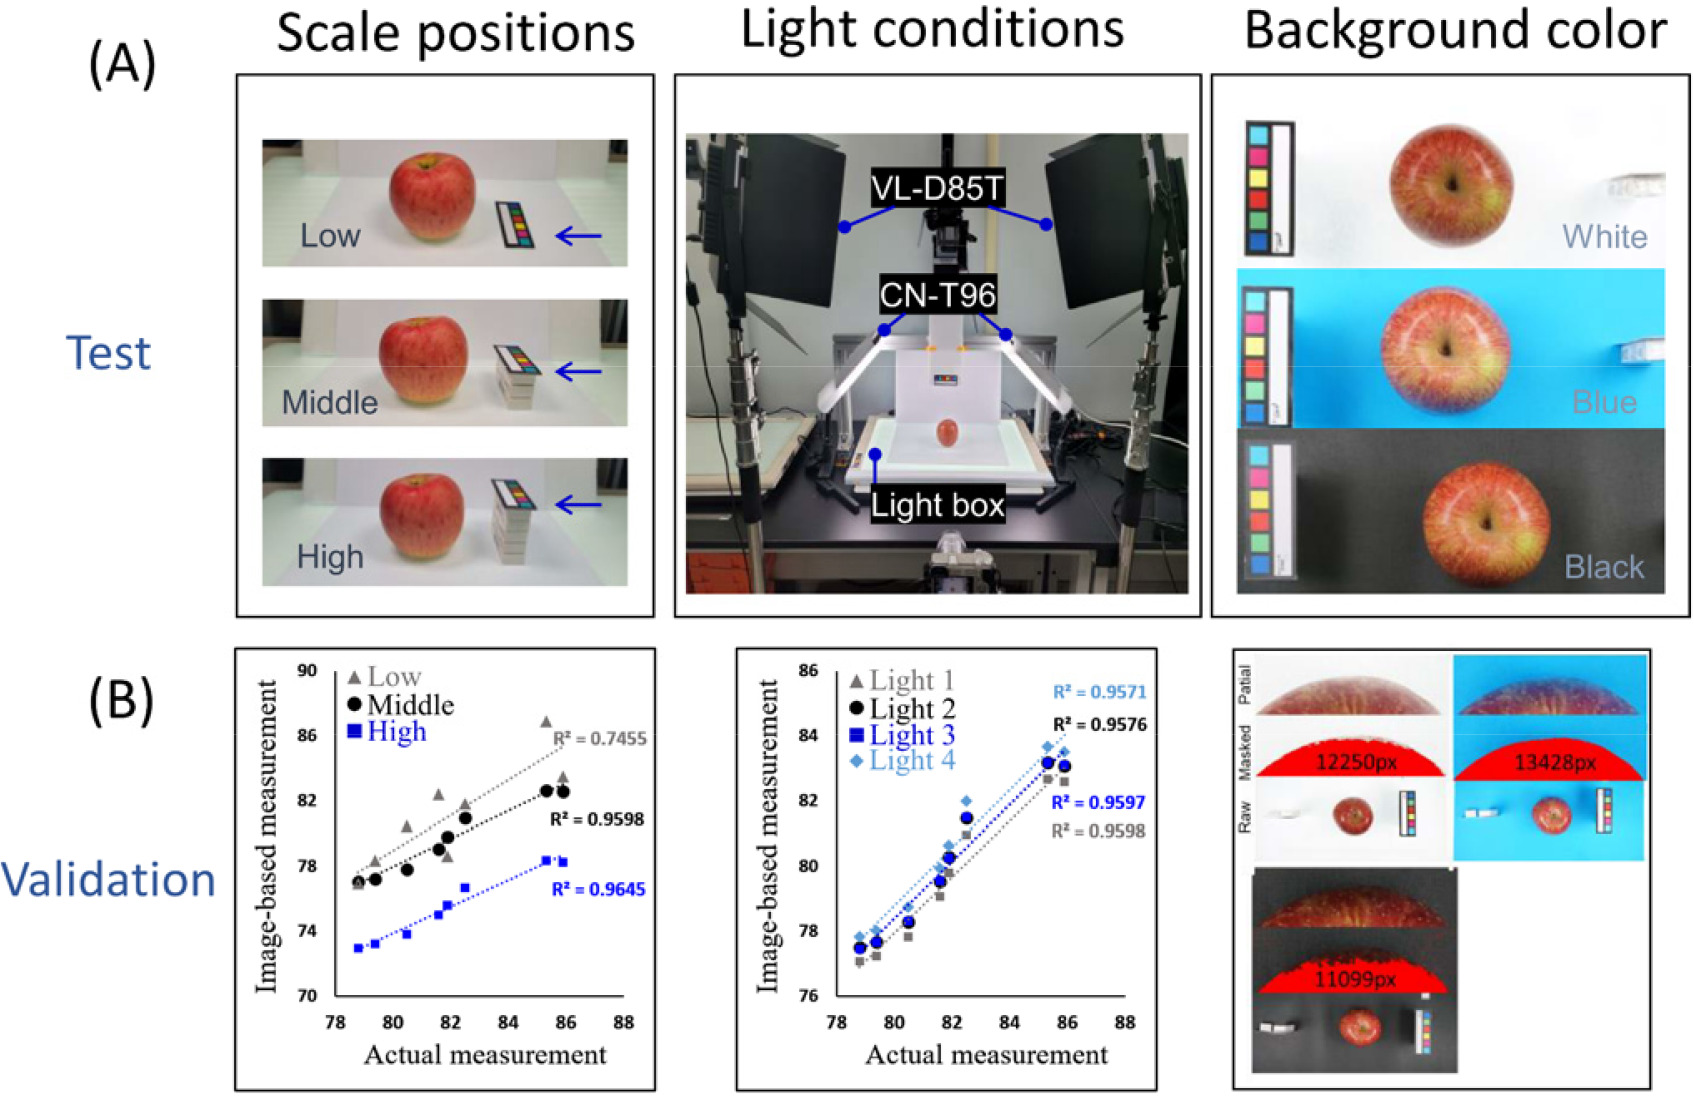
본 연구에서는 이미지 촬영 환경조건에 따른 이미지 추출 값 변화를 확인하여 사과 과실 촬영의 최적 조건을 조사하였다. 우선 상단 이미지 픽셀값에서 과실의 크기를 환산할 때 사용된 보정용 도구(스케일 바+컬러 차트)의 위치를 거치대 바닥(low), 과실의 중간 위치(middle), 과실의 상단 위치(high)에 놓고 측정한 후 실측값과 비교하였고, 조명은 과실 거치대 아래쪽에 LED Light box (ART-4W, 라이텍)와 상단 측면에 LED 조명1(CN-T96, Prodean), LED 조명2(VL-D85T, VILTROX)를 설치한 후 4가지로 조합(Light 1: light box, Light 2: light box+LED조명1, Light 3: light box+LED조명 2, Light 4: light box+LED 조명1+LED 조명 2)하여 광량 및 생산된 이미지의 차이를 확인하였다. 마지막으로 과실 촬영 배경색(흰색, 파란색, 검은색)을 변화시켜 최적의 이미지 생산 조건을 조사하였다. 촬영 기본 조건으로는 디지털카메라(a6000, SONY)를 상단과 측면에 각각 설치하여 이미지를 생산하였고, 기본 설정값은 ISO 값을 100, 조리개 f/14, 셔터 속도 1/4로 상단과 측면 카메라 모두 동일하게 사용하였으며, 촬영 이미지는 PNG 파일 형식의 6000×4000 (350dpi) 해상도로 저장하여 분석에 이용하였다. 또한 과실의 촬영 방향에 따른 편차를 줄이기 위해 0º, 90º, 180º로 과실을 회전시켜 3회 촬영으로 획득된 지표의 평균을 과실 개체의 대푯값으로 사용하였다.
이미지 데이터 분석 방법
생산된 RGB 이미지 데이터 분석은 기존 대두 종자를 대상으로 개발된 자동 이미지 추출 방법을 토대로 과실 분석에 맞게 변형하여 사용하였다(
Baek et al. 2020). 이미지 분석은 ImageJ (
Abràmoff et al. 2004) 프로그램을 기반으로 하여 촬영, 이미지 처리, 데이터 추출 등으로 다음과 같이 수행하게 된다. 촬영 단계에서 과실을 RGB 카메라 설정값에 맞춰 PNG 형식의 이미지를 컴퓨터에 저장한다. 이미지 처리 단계는 영상 오류를 일으키는 요소를 제거하고 배경과 과실의 영역을 분리하기 위해 수행하는 과정으로 전처리와 본처리로 나누어 진행하였다. 먼저 보정용 도구와 실험 재료 이름표를 제거(crop)하는 과정, 길이 측정을 위해 이미지 픽셀에 따라 mm으로 변환하는 스케일 바 설정 등 전처리 과정을 수행하였고, 과실 부위만 분석데이터로 활용하기 위한 관심 영역(ROI; region of interest) 설정, 과실의 색상 값에 따라 배경과 분리하는 작업(Segment)과정, 분리된 과실 이미지 픽셀을 계산하기 위해 이진화(Binary)작업 등 본 처리 과정을 진행하였다. 이후 형태와 관련된 12개의 지표로 분석을 수행하기 위해 처리된 이미지에서 데이터 추출 과정을 진행하였다. 12개의 지표로서는 면적(크기)과 관련된 area, perimeter 2개의 지표와 길이(diameter)와 관련된 6개 지표(width, height, major, minor, ferret, minferet), 그리고 과실의 원형 정도를 확인할 수 있는 4개 지표(circularity, aspect ratio, roundness, solidity)로 구성되어 있다(
Table 1).
생산된 이미지의 정확도를 확인하기 위해 실제 측정된 과실의 횡경과 종경을 버니어 캘리퍼스(BD-DC200P, 블루텍)를 이용하여 측정하였고, 사과 품종별로 과실 30개체를 각각 분석하여 이미지 데이터와 비교하였다. 생산된 이미지 데이터의 품종 간 측정값 비교를 위해 일원분산분석(One-way ANOVA)과 사후 검정(Post-Hoc analysis)으로는 Duncan’s test를 수행하였고, 원형도 지표를 활용하여 주성분 분석(Principal Component Analysis, PCA)을 수행하여 총 120개체 사과의 제 1, 2 주성분 값으로 PCA plot을 그려 종경과 횡경의 비율이 다른 비 상품과를 판별하였다. 분석에 사용한 프로그램은 SPSS v.25 (SPSS Inc. USA)를 이용하였다.
결과 및 고찰
과실 형태 분석을 위한 이미지 촬영 최적 조건 규명
본 연구에서는 RGB 이미지 기반 과실 분석의 최적 조건을 규명하기 위해 이미지 촬영 환경조건 별 측정값을 비교하였다(
Fig. 2). 우선 상단 이미지 측정 시 정확도를 높이기 위해 보정용 도구의 높이(low, middle, high)를 조정하여 실측값과의 정확도를 비교하였다. 이미지 촬영 최적 조건 조사 실험에서의 실측 값은 보정용 도구의 크기를 환산하여 측정하였다. 이미지 거치대 바닥(low)에 보정용 도구를 위치한 경우에는 실측값과의 R
2값이 0.7455로 나타나 비교적 오차가 큰 것을 확인하여, 상단 이미지 측정 시에는 과실의 중간 이상의 위치에 보정용 도구를 위치하는 것이 정확한 이미지 측정값 획득에 필요할 것으로 보인다. 이미지 생산에 있어 중요한 환경요인 중 하나인 조명에 따른 과실 촬영 위치의 광량의 변화를 확인하기 위해 3가지 종류(Light box, CN-T96, VL-D85T)의 조명의 4개 조합에 따른 광량 지표 변화를 관찰하였다(
Table 2). 조도(illuminance), 입사 광량(irradiance)값으로 광량을 확인한 결과, 예상할 수 있듯이 조명이 가장 많이 사용된 4 번 조합(light box+CN-T96+VL-D85T)에서 최대값을 보였고, 1번 조합(light box)에서는 2개 지표 모두에서 최소값을 보였다. 조도는 이미지 생산에 있어 명도 및 채도 결정에 영향을 주며, 일반적으로 조도가 강할수록 카메라 설정 중 셔터 속도를 더 높일 수 있고, ISO 설정을 낮출 수 있어 이미지 노이즈를 최소화, 그림자 부위 발생을 감소시킬 수 있는 장점이 있다. 입사 광량은 카메라 센서에 영향을 주는 광량으로 렌즈 조리개 설정에 영향을 준다. 다만 본 연구의 카메라 설정 값(ISO 100, 조리개 f/14, 셔터 속도 1/4) 에서는 4개 조명 조건 간에 실측값 비교 시 정확도에 있어 큰 차이가 없으며(
Fig. 2A), VL-D85T 조명의 경우 이동성이 낮고, 고가의 장비라는 단점을 생각했을 때 최종적으로 2번 조합이 대중적으로 활용할 수 있을 것으로 판단되어 최종 선택하였다.
선택된 조명 조건으로 이미지 촬영 시 배경색에 따른 정확도 차이를 확인하기 위해 추출된 이미지 지표 값과 실측 값을 비교했을 때, PNG 이미지에서 관심 영역 추출 과정에서 흰색 배경의 경우 조명 빛이 강하게 반사되어 일부 과실 경계가 불명확해져 배경 분리에 오류가 발생하는 단점이 발생하였고, 반대로 검은색의 경우 빛을 과다하게 흡수하여 배경색과 경계 부위에 그림자 효과가 발생하여 정확한 area 값 획득이 어려움을 확인하여 최종적으로 파란색 배경을 선택하였다(
Fig. 2B). 파란색 배경은 영상 분야에서 크로마키(chroma key) 기법 활용에 많이 사용되는 색상으로서 사물체를 배경에서 쉽게 분리할 수 있는 특징을 가지고 있다(
Kim et al. 2017). 이미지 기반 식물 표현체 연구 분야에서도 배경색으로 파란색을 활용하면 배경과 식물 부위 분리에 탁월한 효과가 있음을 확인하여(
Junker et al. 2015), 현재까지 이미지 표현체 연구에 활발히 활용되어 오고 있다(
Henke et al. 2021,
Hüther et al. 2020,
Lee et al. 2021).
종합적으로 사과 과실 이미지 촬영 최적 조건은 상단 촬영으로 과실 크기를 계산하기 위한 보정용 도구의 위치는 과실의 중간 이상의 위치에 설치하고, 조명은 거치대에 light box와 CN-T96 보조 LED 조명을 추가하고, 촬영 시 배경색은 파란색이 실측값과의 정확도나 과실 부위 추출에 최적의 조건으로 판단된다.
사과 품종별 이미지 데이터 분석
최적화된 사과 과실 촬영 조건을 바탕으로 이미지 자동 추출프로그램을 활용하여 사과 품종(홍안, 홍로, 후지, 황옥) 별 형태 특성 조사를 수행하였다. ImageJ 기반 이미지 자동 추출 분석프로그램은 총 32개의 지표를 생산하며, 이중 과실의 형태 측정에 활용할 수 있는 총 12개 지표를 과실용 지표로 선발하여 사과 품종별 이미지 데이터 값을 획득하였다(
Table 3). Feret 직경 지표는 이미지에 투영된 대상의 양쪽 끝 사이, 또는 일정한 방향의 평행선 간의 거리를 측정하는 지표로서 캘리퍼스 측정 원리와 비슷하여 ‘캘리퍼스직경’ 이라고도 불린다. 이 지표는 불규칙한 형태 대상의 직경을 측정할 때 주로 사용되며, 일반적으로 입자 수준에서 활용되는 직경 측정 방법이었으나 최근에는 식물체의 세포(
Konstankiewicz et al. 2001), 기관(
Trubetskaya et al. 2017), 잎, 줄기(
Golbach et al. 2016) 측정에도 활용되고 있다.
사과 품종 별 이미지 지표 값을 비교한 결과(
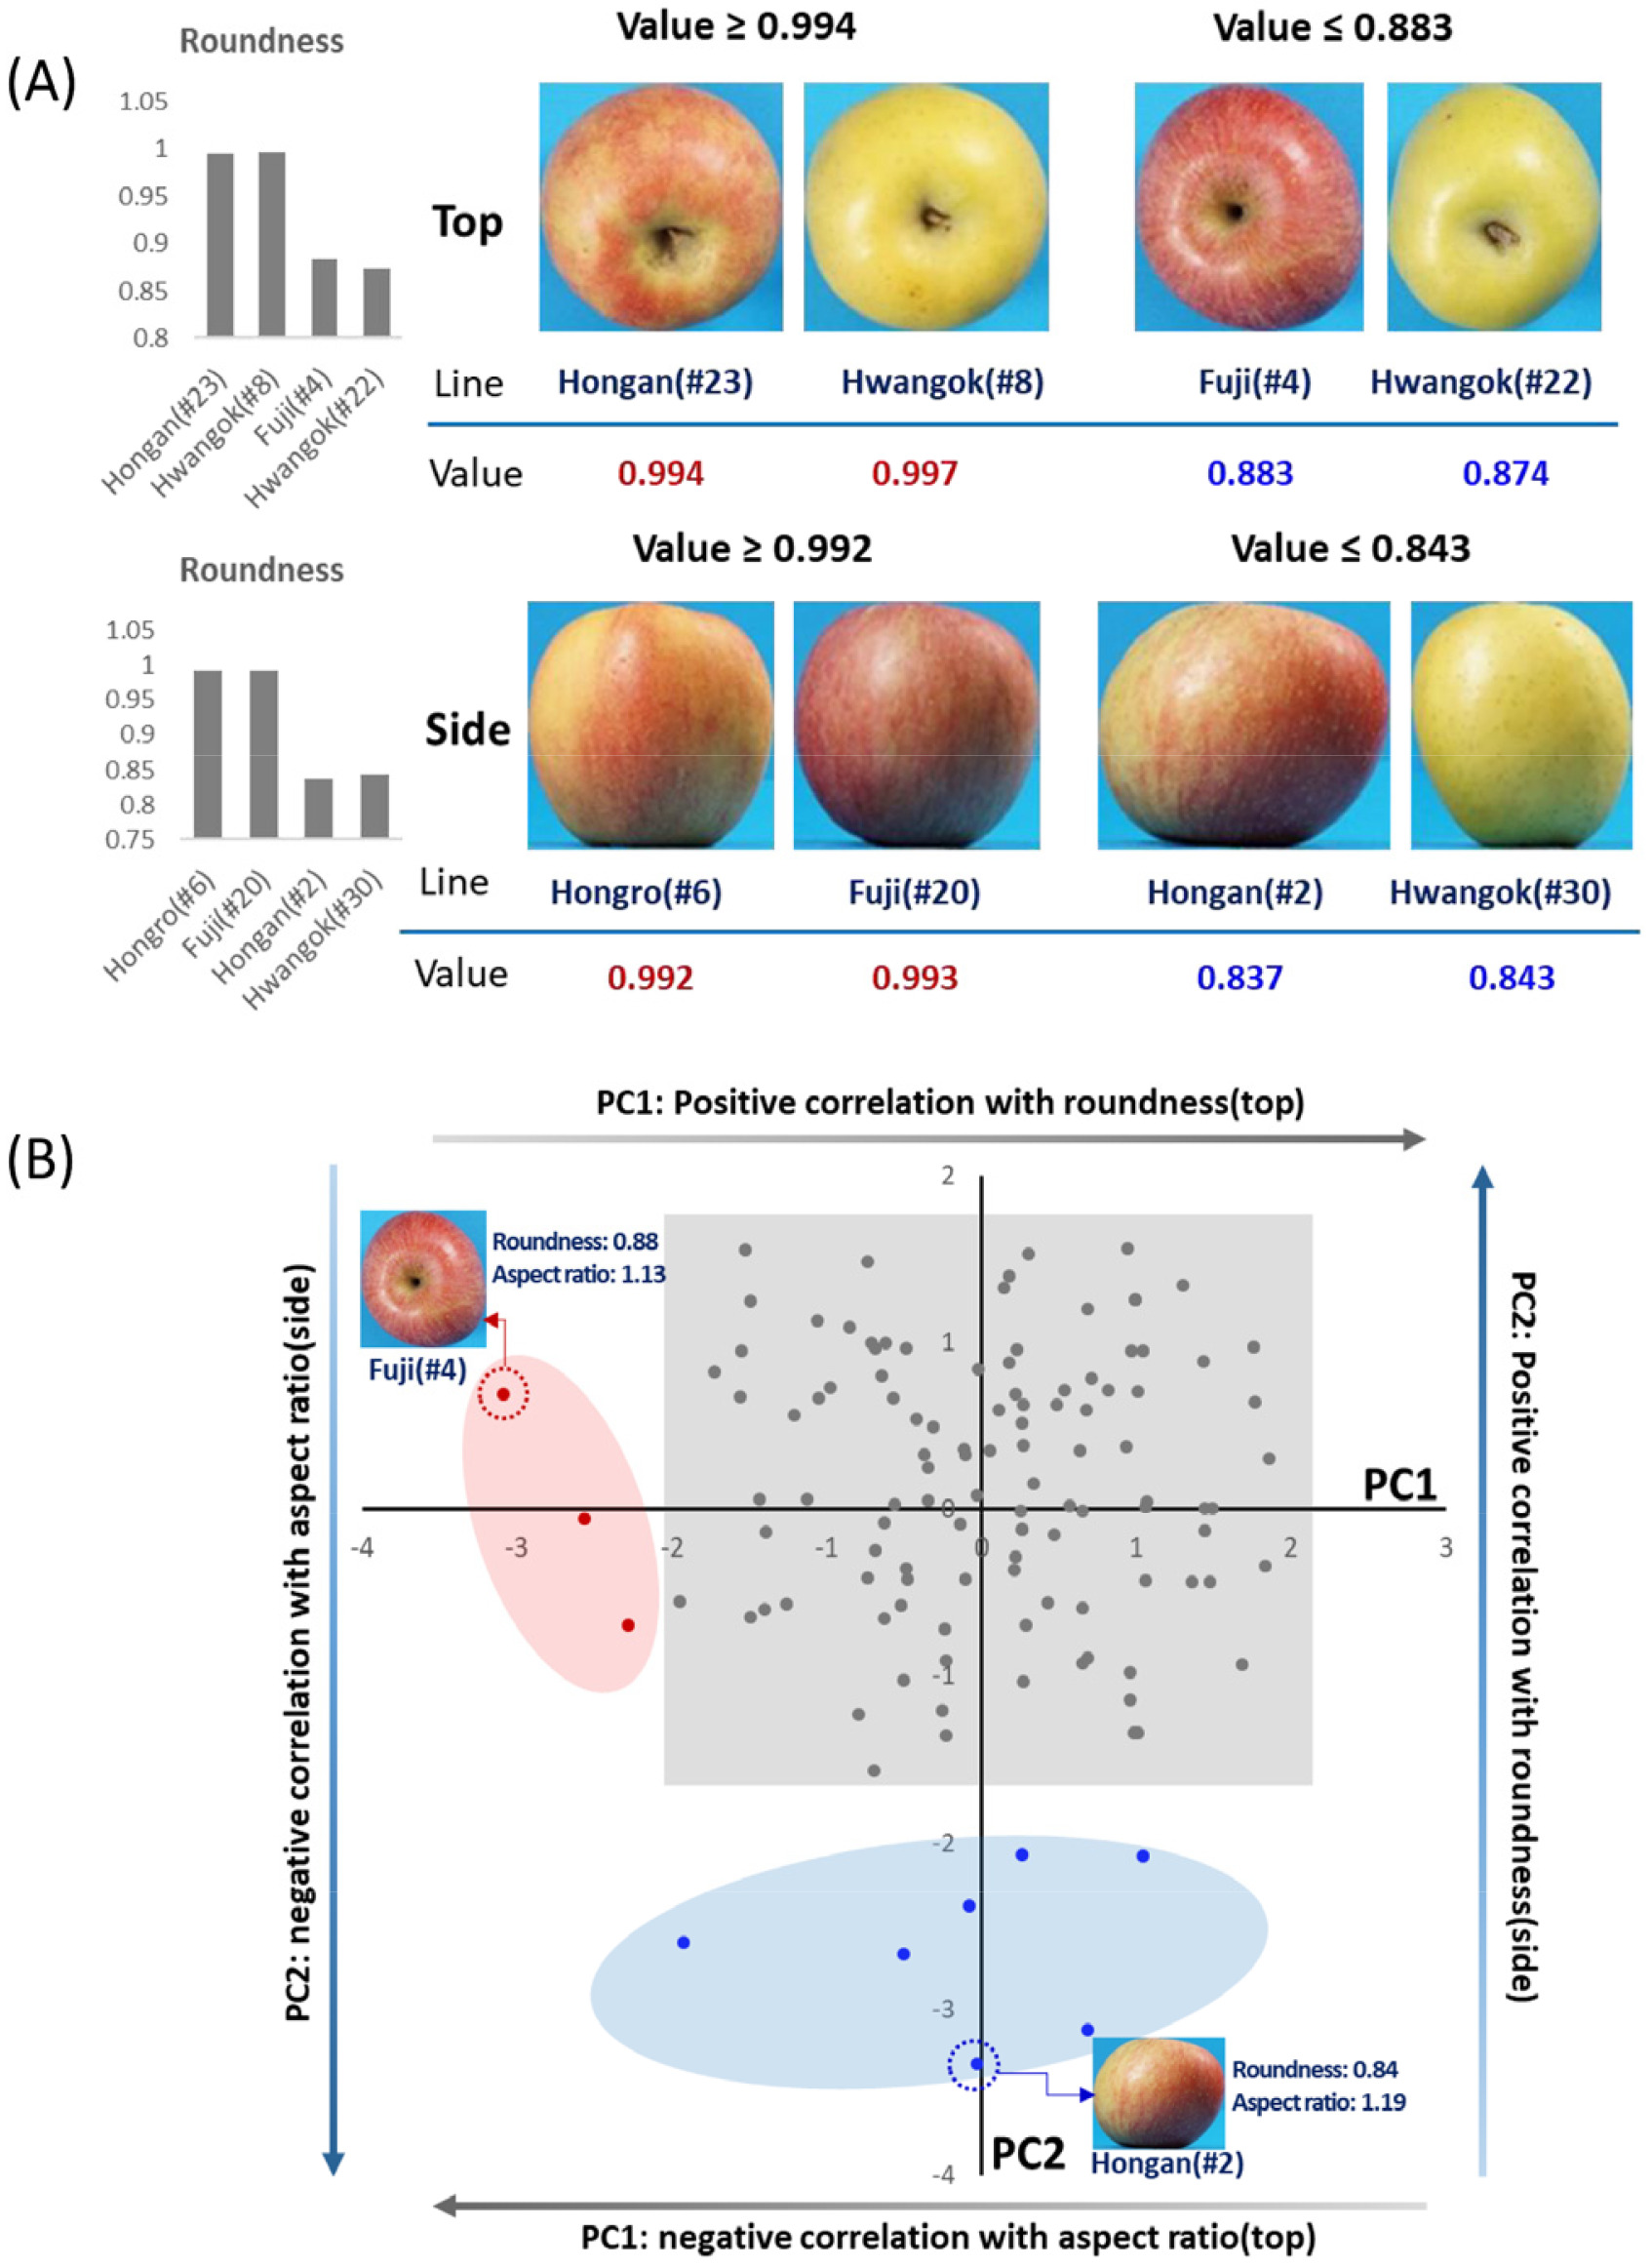
Table 3), 과실의 크기는 area, perimeter 지표 값을 토대로 홍안이 가장 크며, 그 다음으로는 홍로와 후지, 그리고 황옥이 가장 작은 것으로 측정되었다. 또한 과실의 종경 또는 횡경 값으로 활용 가능한 6개의 지표값 역시 과실의 크기 결과와 비례하여 나타났다. 기본적으로 원형 과실인 사과의 각 품종의 평균값은 4개의 지표에서 품종 간에 미세한 차이를 보였지만, 통계적으로 확인하였을 때는 상단 이미지 기준은 홍안이 가장 원형에 가깝고, 측면 이미지 기준으로는 홍로가 가장 원형에 가까운 것으로 확인되었다. 하지만 원형 모양(shape)과 관련된 4개 지표의 경우 비율이나 직경, 둘레 데이터를 기반으로 수식하여 원형 정도를 나타내므로 상대적으로 판단할 수 밖에 없다. 예를 들면, Roundness지표값을 기준으로 최대값을 보인 개체와 최소값을 보인 개체의 사진을 비교해보면 원형 정도에 있어서 뚜렷한 차이를 확인할 수 있다(
Fig. 3A). 그리고 상단과 측면의 4개의 지표(Aspect ratio, roundness, circularity, soliditiy) 값으로 주성분(PCA) 분석을 수행했을 때 원형정도에서 차이를 보이는 개체들을 판별하고 원형 정도 결정에 주요하게 작용하는 지표를 확인할 수 있었다(
Fig. 3B). 주성분 분석 결과, 주성분 1의 경우 상단 이미지 4개 지표 중 roundness와 aspect ratio 지표가 각각 0.990, -0.990 성분 행렬을 보여 주요하게 주성분 1값에 관여했음을 알 수 있었고, 주성분 2에서는 마찬가지로 측면의 roundness와 aspect ratio 가 0.994, -0.994 수치를 나타내 상단과 측면 이미지의 원형 정도 파악에 있어 4개의 지표 중 roundness, aspect ratio 지표가 다른 2개 지표(circularity, solidity)보다 원형 정도 값 결정에 주요하게 작용한다는 것을 확인하였다. 따라서 원형 지표 4개의 경우에는 과실 품종의 평균값을 활용하여 원형 정도를 파악할 수도 있지만, 각 개체값을 바탕으로 통계 분석과정을 통해 모양이 비 정상적인 과실 선별에 더 활용성이 높은 지표라 판단된다. 이상으로 이미지 데이터를 기반으로 추출된 크기, 직경, 원형도와 관련된 지표들과 분석 기법은 향후 신속한 사과 형태 분석 및 선별 장치 개발에 적용 가능한 기술이라 생각된다.
획득된 이미지 데이터의 정확도(R
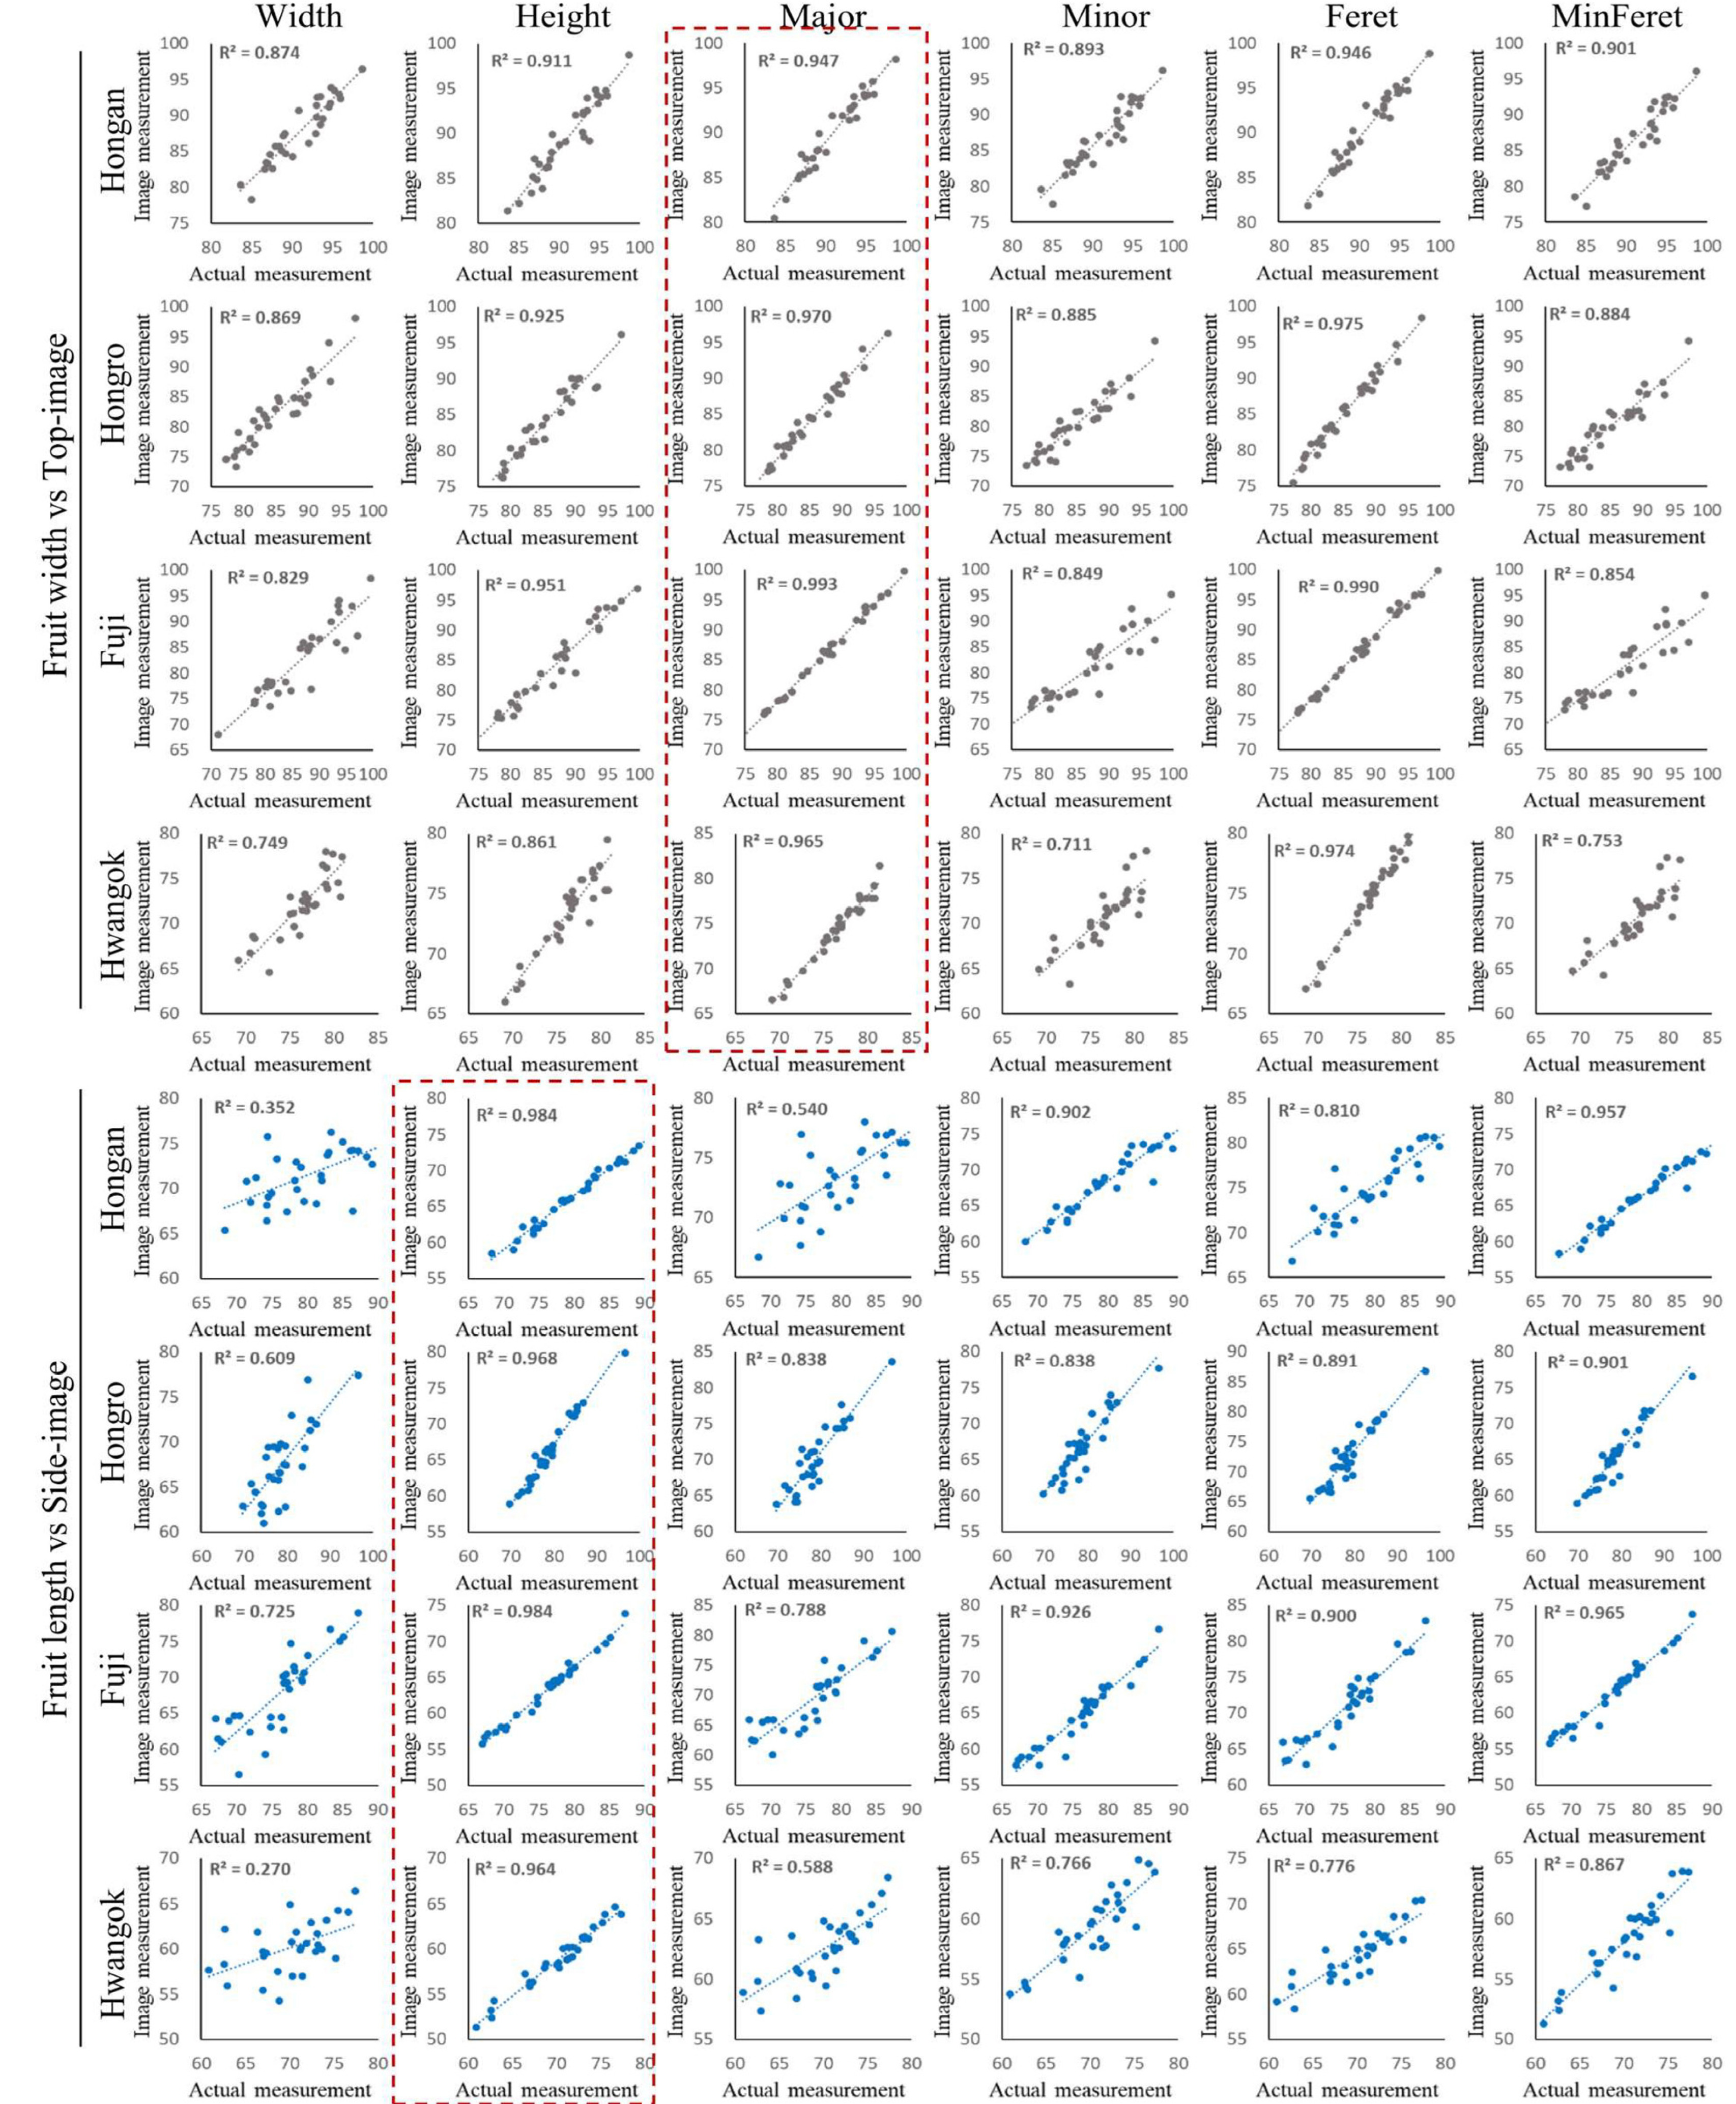
2)를 확인하기 위해 과실의 실측값(횡경, 종경)을 사과 4품종 30개체씩 버니어 캘리퍼스로 측정한 후 이미지 촬영을 수행하여 횡경은 상단 이미지와 종경은 측면 이미지와 각각 비교하였다(
Fig. 4), 과실의 품종별 횡경 값은 major 지표에서 전체적으로 가장 높은 0.947 (홍안)에서 0.993 (후지)로 나타났다. 종경 값과 측면 이미지 데이터값 비교에서는 0.964 (황옥)에서 0.984 (홍안)로 나타나 횡경과 직경의 정확도는 거의 유사한 수준이었다. 이미지 기반 정확도 측정 결과, 횡경 및 종경값 정확도 비교 모두 품종에 따라 최소 0.94 이상의 수치로서 이는 기존 같은 분석프로그램 기반으로 수행된 대두 형태 분석의 정확도(0.91-0.97)와 유사하거나 약간 더 높음을 확인 할 수 있었다(
Baek et al. 2020). 본 연구에서 실측값과 이미지 데이터 간에 비교 결과, 정확도가 가장 높았던 지표가 상단과 측면 이미지에서 서로 달랐던 것은 상단과 측면 촬영 시 특성 차이 또는 사과 과실의 종경 및 횡경의 크기 차이에 기인한 것으로 생각되며, 이는 상단과 측면 이미지를 동시에 활용하는 연구에 있어서 획일적인 한 개의 지표 값으로 실측값을 추산할 것이 아니라 이미지 촬영 방향과 과실 또는 식물체의 특성을 고려하여 최적의 지표 값을 선택, 활용해야 함을 보여준다고 할 수 있다. 이러한 연구 결과를 토대로 본 연구에서 사용된 분석 기법을 활용하여 사과 과실 형질 조사의 디지털화를 모색할 수 있을 것으로 생각되며, 향후 다른 과실류 형태 분석에도 이용할 수 있을 것으로 판단된다.
적 요
이미지 기반 표현체 연구의 활성화로 디지털카메라를 이용한 식물체의 형태 또는 색상과 관련된 연구가 활발히 진행되고 있지만 작물별 또는 식물 부위별로 연구를 수행하는 환경조건에 따라 제각각 분석을 수행하고 있어 표준화된 촬영 및 분석 기법의 정립이 필요하다. 본 연구에서는 우리나라에서 소비가 높은 사과 과실을 대상으로 이미지 촬영 최적 조건을 규명하고, 오픈소스 프로그램을 기반으로 자동 분석프로그램을 제작하여 과실 형태 분석을 체계화하였다. 최적의 이미지 촬영 조건으로는 보정용 도구를 과실 중간 이상 위치에 배치한 후 조명은 Light box+보조 LED 조명(CN-T96)을 사용하는 것이 좋으며, 이미지에서 과실 부위를 추출할 때는 파란색의 배경을 사용하는 것이 과실과 배경 분리에 유리하다. 또한 제작된 분석프로그램으로 분석 시에 모든 품종에서 0.94 이상의 R2 수치를 확인 할 수 있어 최적화된 촬영 조건과 분석프로그램의 정확성을 검증할 수 있었다. 이 결과들을 통해 기존 작업자에 의해 수행됐던 선별 과정 보다 더 효율적인 사과 과실 형질 조사 및 선별이 가능 할 것이라 생각되며 향후 과실 선별 장비에 기술을 도입하면 선별에 필요한 노동력과 시간을 절약할 수 있을 것으로 기대된다.
사 사
본 연구는 농촌진흥청 연구사업(과제명: 사과, 배 생산성 향상을 위한 영상기반 정밀 생리⋅생태 진단기술 개발, 과제번호: RS-2021-RD009026)에 의해 이루어진 것임.
Fig. 1Photographs of the four apple cultivars used for image analysis in this study.
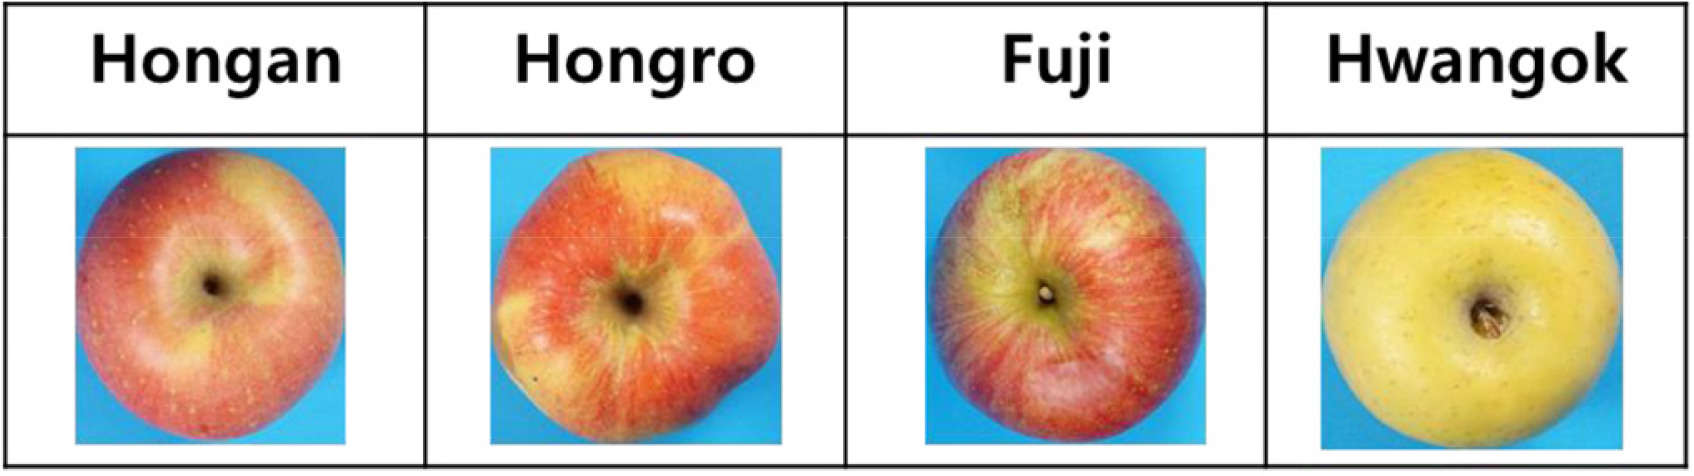
Fig. 2Optimization of apple fruit image acquisition conditions based on scale bar position, lighting conditions, and background color variation. (A) Images from testing the three image acquisition conditions for optimization. (B) Validation of image acquisition conditions using scatter plot and masked images.
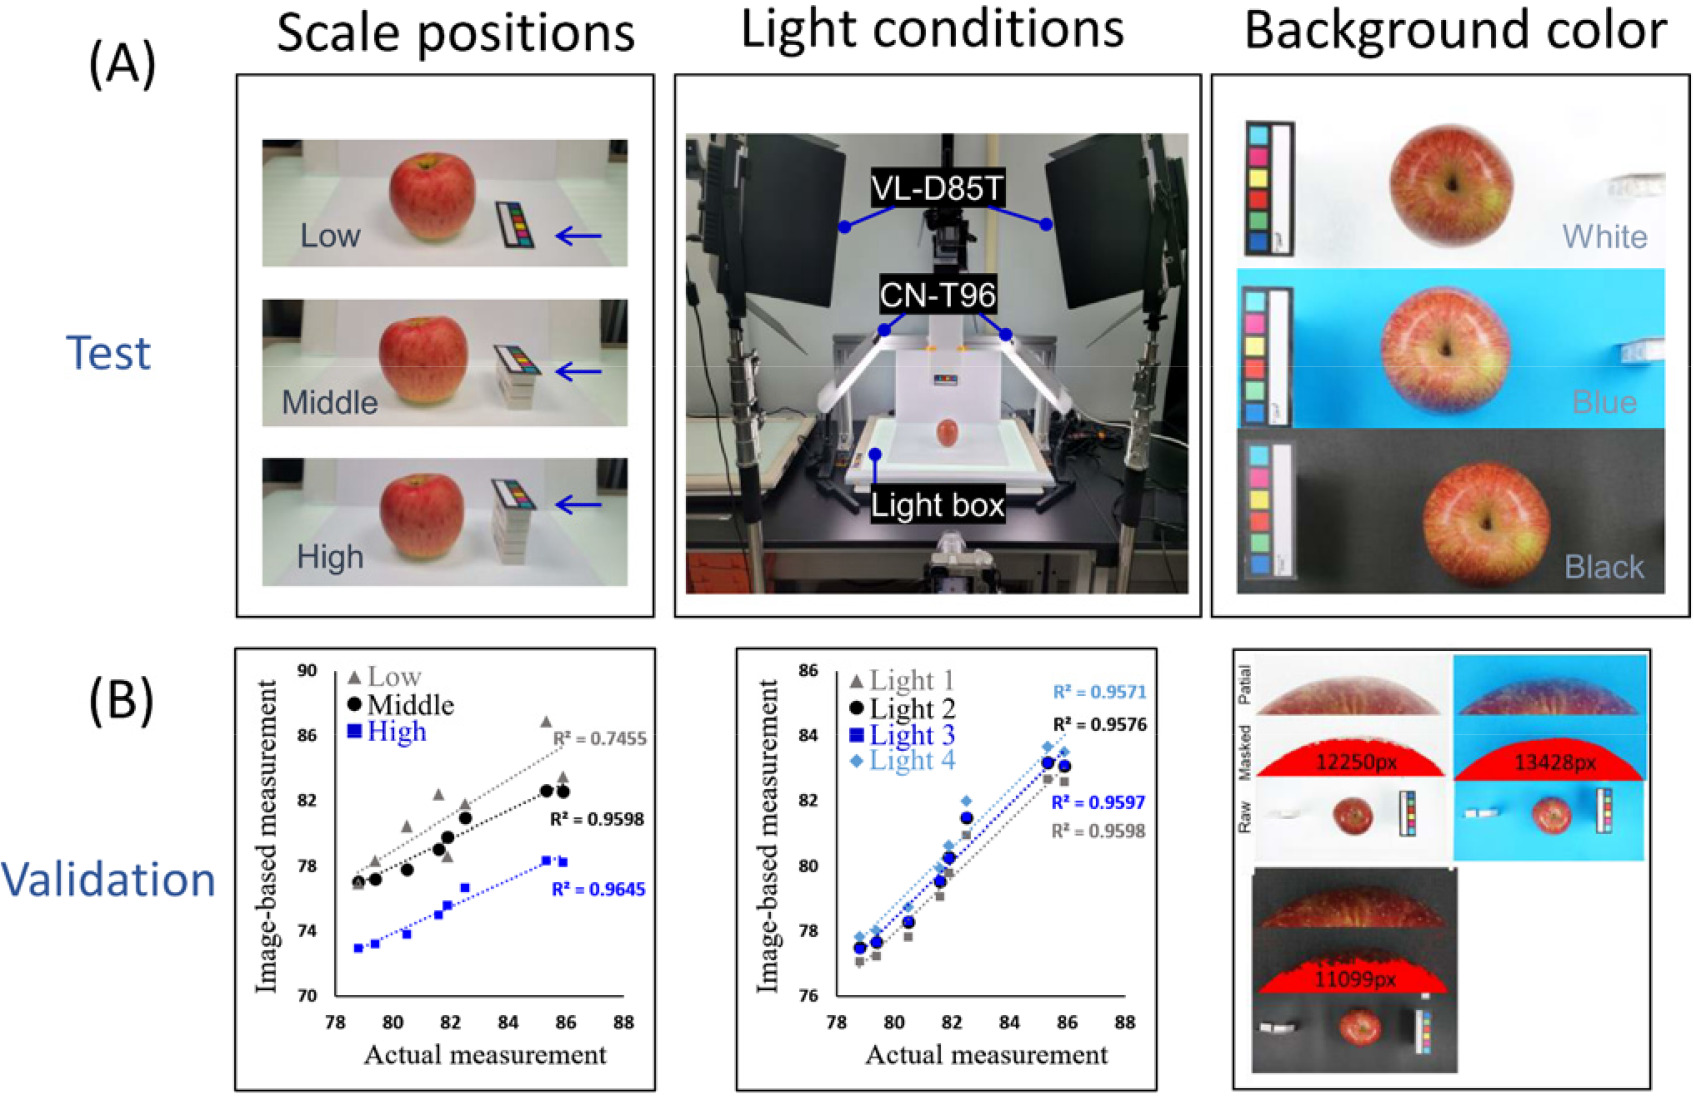
Fig. 3Comparison of differences among individual fruits based on fruit roundness index values. (A) Comparing the maximum and minimum values of fruits using the roundness index. (B) PCA plot based on four index values including aspect ratio, roundness, circularity, solidity.
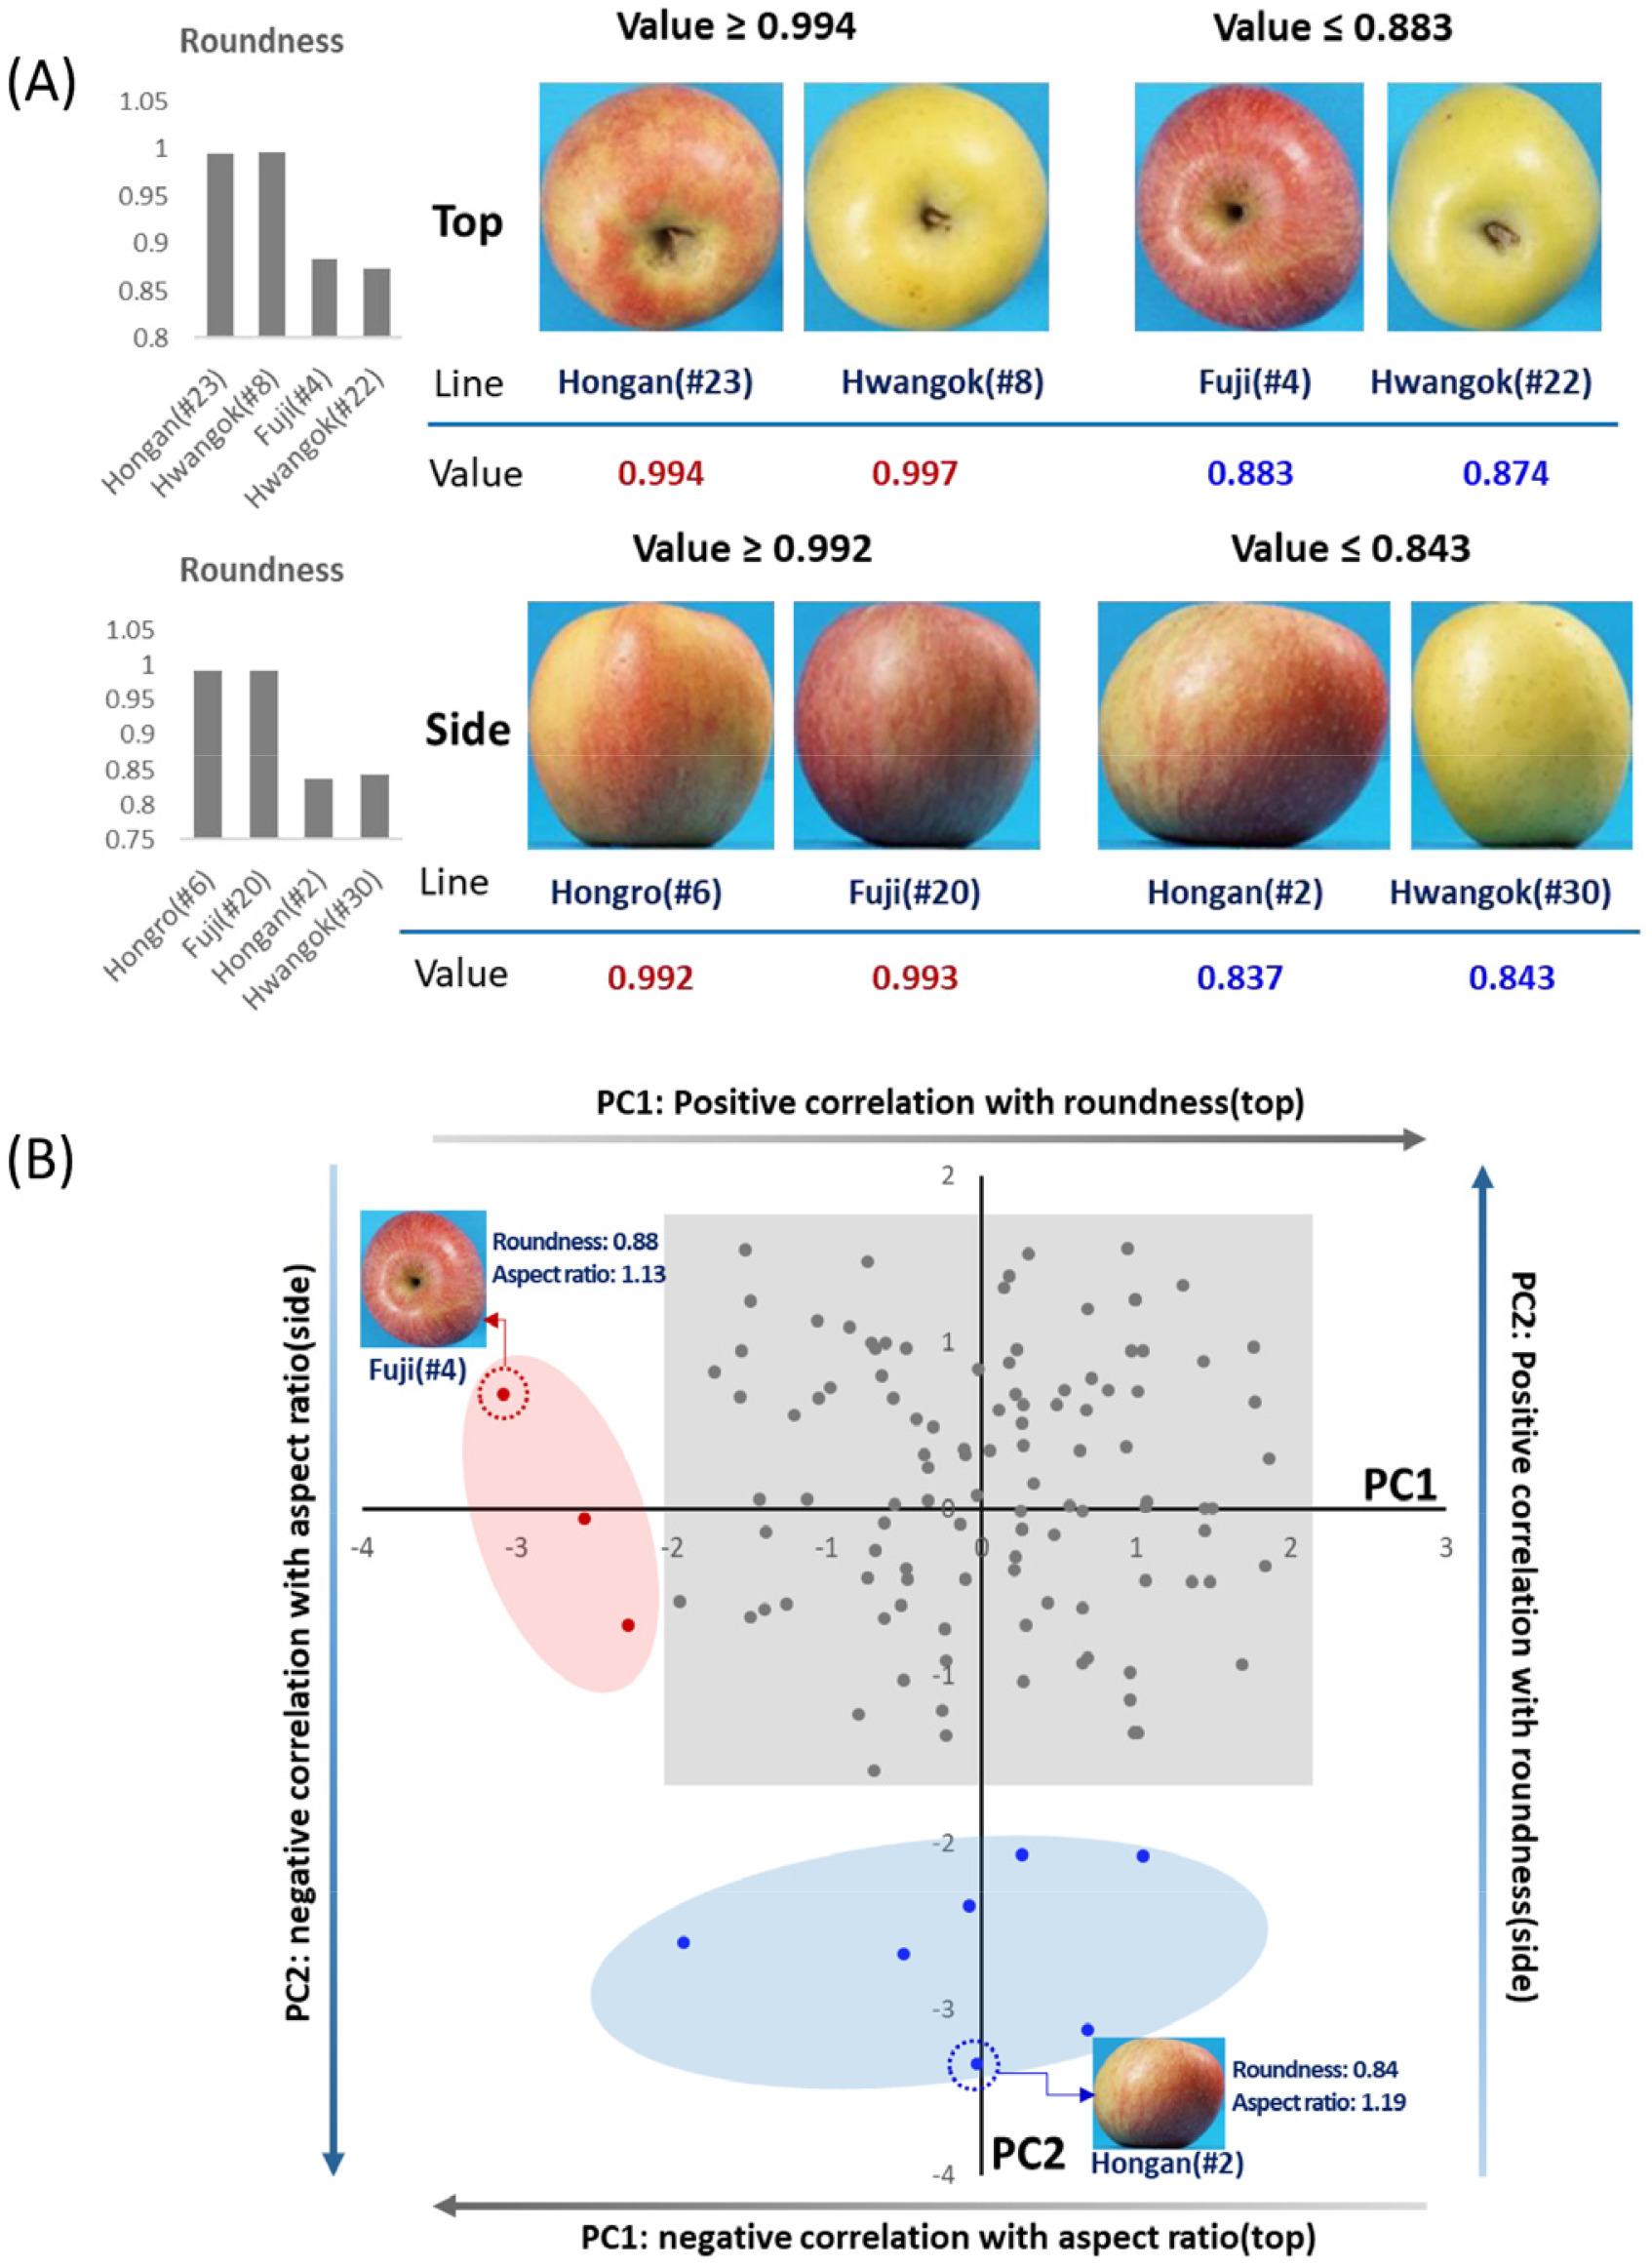
Fig. 4Accuracy comparison of Top and Side image indices with actual length and width measurements of fruits. In this analysis, Vernier calipers were used for actual measurements, and a total of 30 fruits per cultivar were analyzed. The results were compared with six diameter-related indices.
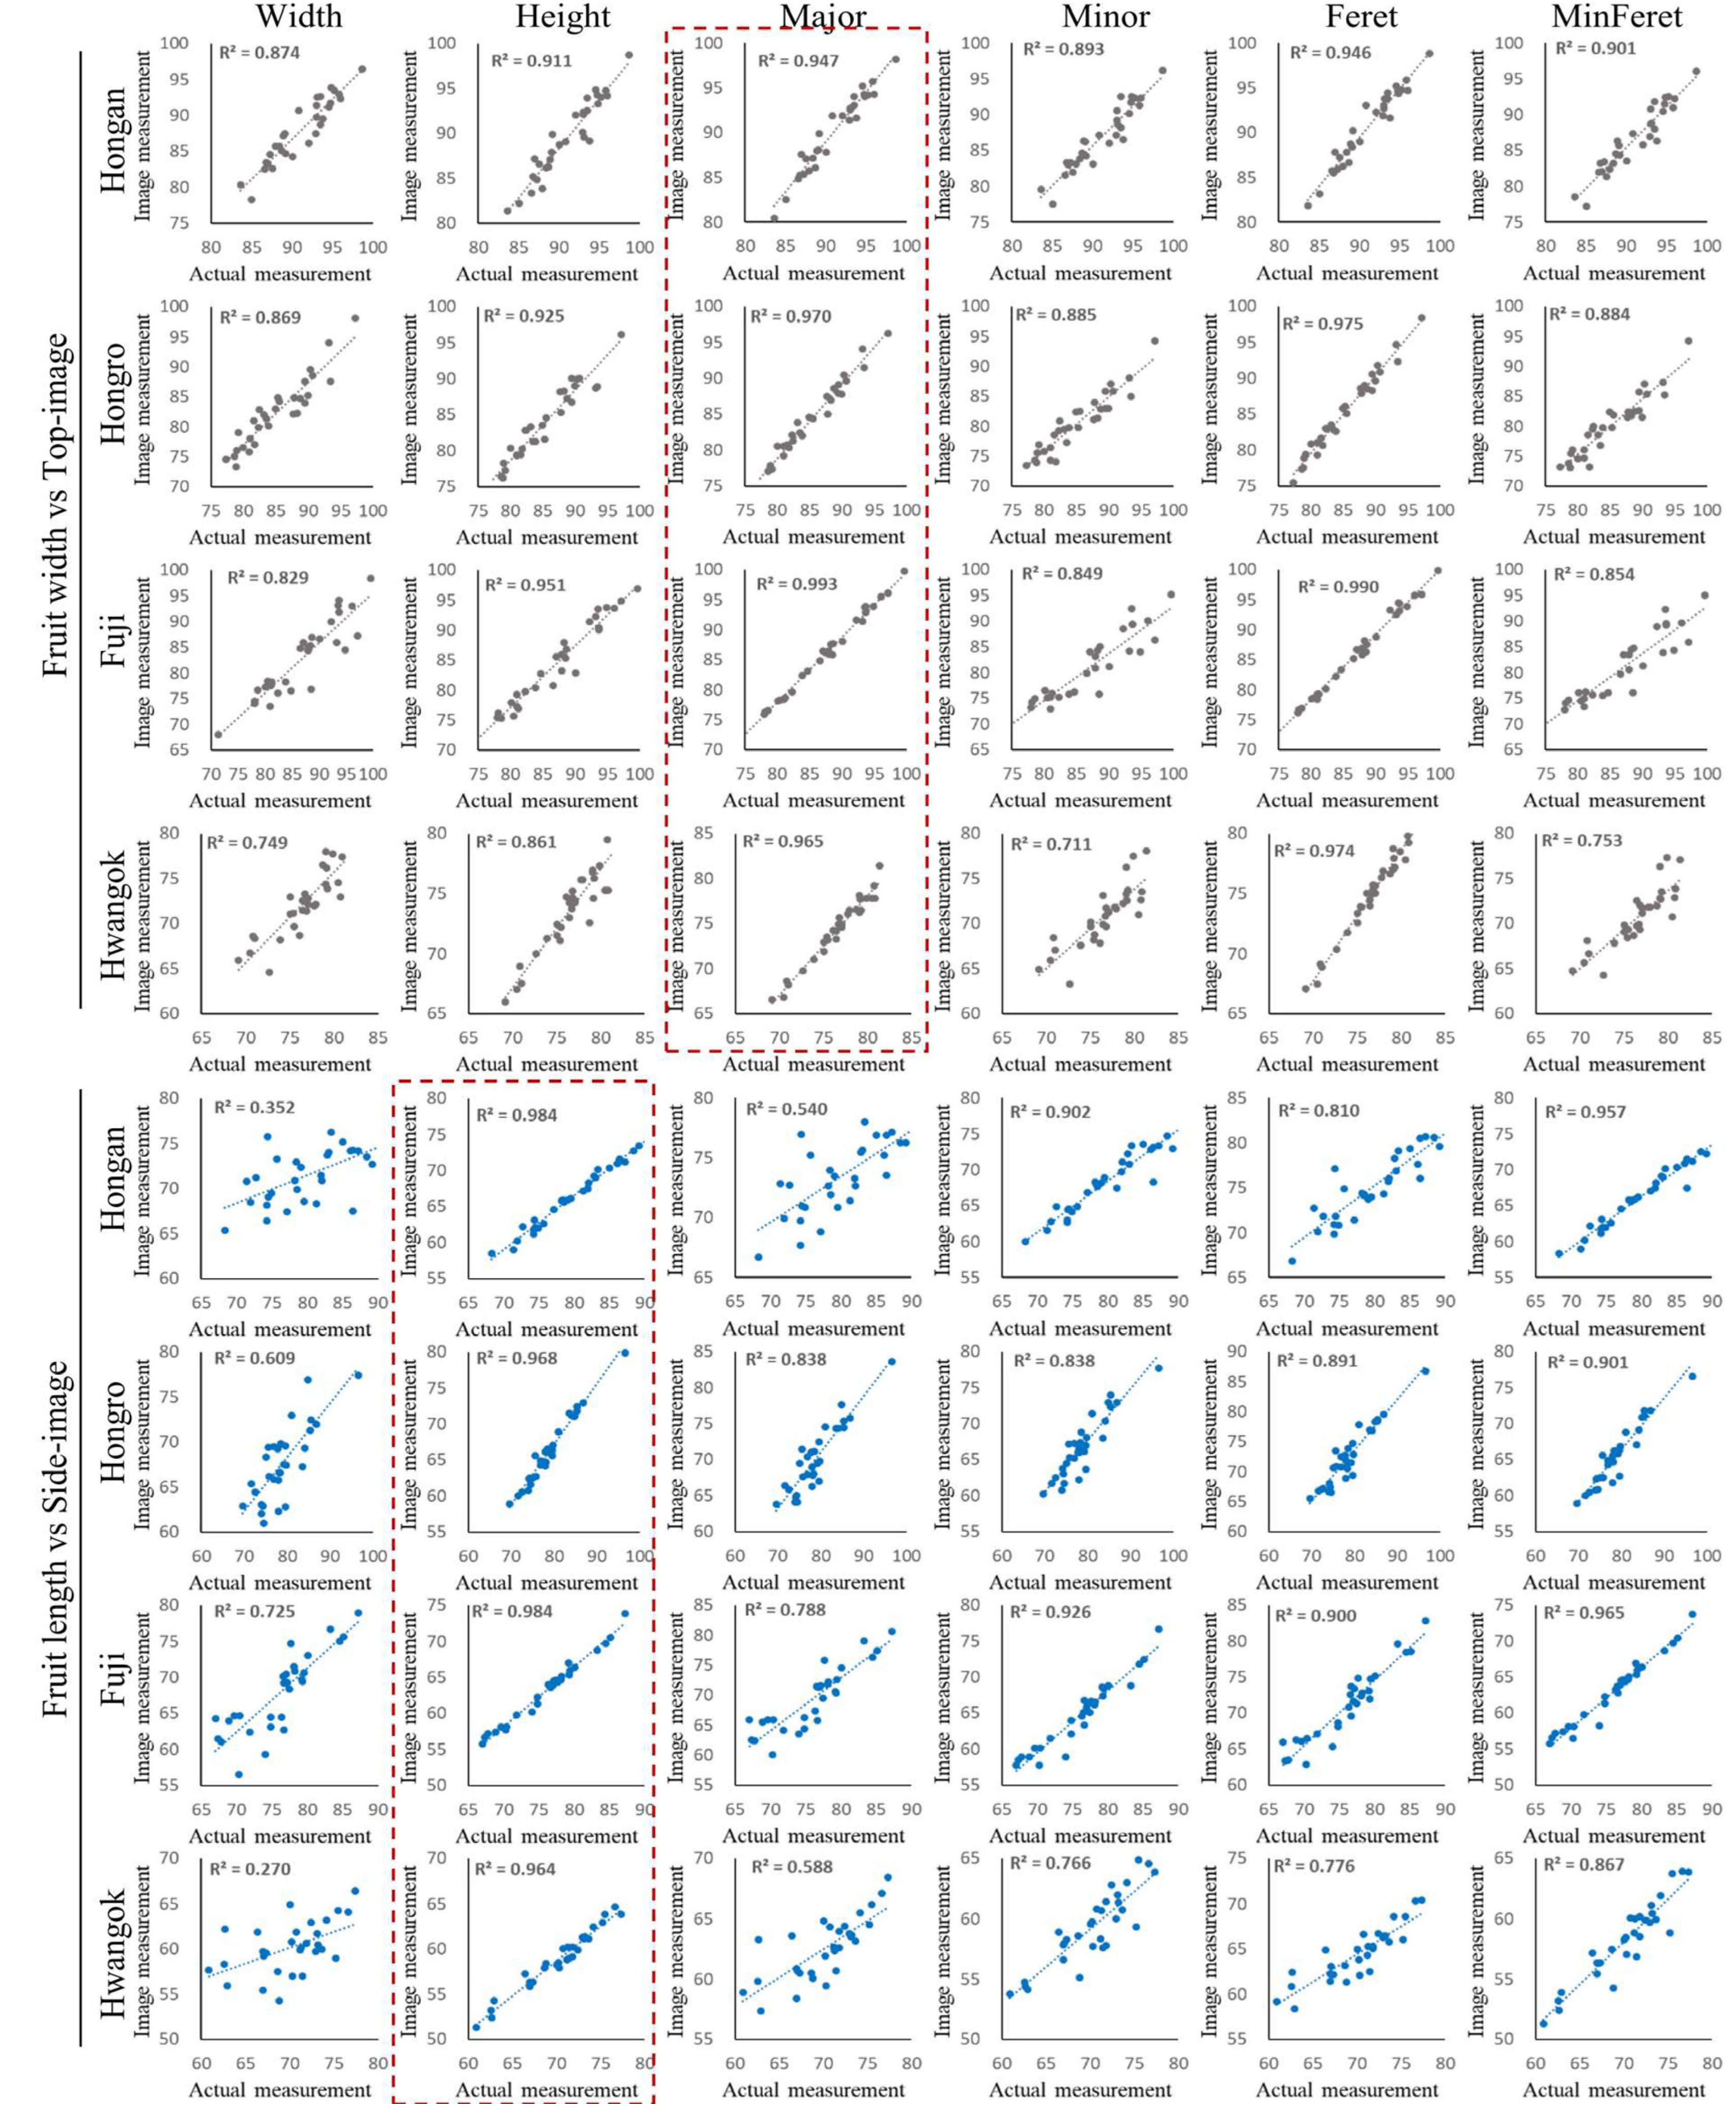
Table 1Definitions of the 12 imageJ-based indices used in this study.
Table 1
|
Category |
Index |
Description |
|
Size |
Area |
Area of selection in square pixels or in calibrated square units |
|
Perimeter |
The length of the outside boundary of the selection |
|
Diameter |
Height |
Measure the height of a digitized object with ROI |
|
Width |
Measure the width of a digitized object with ROI |
|
Major |
Major axis (transverse diameter) |
|
Minor |
Minor axis (conjugate diameter) |
|
Feret |
The longest distance between any two points along the selection boundary, also known as maximum caliper. |
|
MinFeret |
The shortest distance between any two points along the selection boundary, also known as minimum caliper. |
|
Shape |
Aspect ratio |
The aspect ratio of the particle’s fitted ellipse, i.e., [Major Axis]/[Minor Axis] |
|
Roundness |
4×[Area]/(π×[Major axis]2 or the inverse of aspect ratio. |
|
Circularity |
4π×[Area]/[Perimeter]2 with a value of 1.0 indicating a perfect circle. |
|
Solidity |
[Area]/[Convex area]
*Convex hull can be thought of as a rubber band wrapped tightly around the points that define the selection, and determined by gift wrap algorithm
|
Table 2Variations in irradiance and illuminance based on four lighting conditions.
Table 2
|
Lighting conditions |
Irradiance(W/m2) |
Illuminance(lux) |
|
1 (light box) |
3.32±0.20 |
1046.87±59.57 |
|
2 (light box+CN-T96) |
11.66±0.36 |
3239.40±103.09 |
|
3 (light box+VL-D85T) |
18.60±0.53 |
4965.40±142.66 |
|
4 (light box+CN-T96+VL-D85T) |
26.56±0.47 |
7052.87±127.33 |
Table 3Mean values of 12 indices extracted from Top and Side fruit images for 4 Apple cultivars.
Table 3
|
Index |
Image type |
Hongan |
Hongro |
Fuji |
Hwangok |
|
Area |
Top |
6160.68±597.04a
|
5343.83±665.38b
|
5468.55±927.4b
|
4143.31±385.01c
|
|
Side |
3955.82±404.98a
|
3694.56±484.16b
|
3554.53±525.69b
|
2916.51±260.23c
|
|
Perimeter |
Top |
297.73±14.98a
|
276.6±17.53b
|
278.57±23.99b
|
247.65±11.5c
|
|
Side |
254.46±13.13a
|
240.92±14.78b
|
241.62±18.38b
|
221.53±10.46c
|
|
Width |
Top |
87.88±4.49a
|
82.45±5.72b
|
82.89±7.39b
|
72.29±3.77c
|
|
Side |
71.45±3.1a
|
67.61±4.18b
|
67.85±5.58b
|
60.23±2.87c
|
|
Height |
Top |
89.54±4.34a
|
83.73±5.19b
|
84.23±7.26b
|
73.67±3.47c
|
|
Side |
66.5±4.53a
|
66.15±4.66a
|
63.29±4.48b
|
58.83±3.36c
|
|
Major |
Top |
90.14±4.33a
|
84.19±5.36b
|
85.43±7.5b
|
74.36±3.65c
|
|
Side |
73.44±3.13a
|
70.12±4.65b
|
69.53±5.31b
|
62.58±2.63c
|
|
Minor |
Top |
86.83±4.44a
|
80.53±4.95b
|
80.95±6.85b
|
70.8±3.39c
|
|
Side |
68.43±4.49a
|
66.83±4.28ab
|
64.77±4.77b
|
59.23±3.05c
|
|
Feret |
Top |
90.65±4.22a
|
85.18±5.6b
|
85.83±7.52b
|
74.88±3.6c
|
|
Side |
75.23±3.87a
|
72.58±4.91b
|
71.09±5.13b
|
64.51±2.98c
|
|
MinFeret |
Top |
86.65±4.54a
|
80.16±5.04b
|
80.86±6.82b
|
70.74±3.26c
|
|
Side |
66.3±4.39a
|
65.47±4.14a
|
63.09±4.59b
|
58.21±3.25c
|
|
Circularity |
Top |
0.8713±0.01a
|
0.8753±0.01ab
|
0.8797±0.01b
|
0.8477±0.02c
|
|
Side |
0.77±0.03b
|
0.8±0.03a
|
0.76±0.03bc
|
0.75±0.04c
|
|
Aspect ratio |
Top |
1.0393±0.02a
|
1.0463±0.02ab
|
1.0555±0.03b
|
1.0500±0.03ab
|
|
Side |
1.0750±0.05a
|
1.0507±0.02b
|
1.0738±0.03a
|
1.0573±0.03ab
|
|
Roundness |
Top |
0.9633±0.02a
|
0.9573±0.02ab
|
0.9483±0.03b
|
0.9530±0.02ab
|
|
Side |
0.9320±0.04a
|
0.9533±0.02b
|
0.9321±0.03a
|
0.9467±0.03ab
|
|
Solidity |
Top |
1.00±0.00 |
1.00±0.00 |
1.00±0.00 |
1.00±0.00 |
|
Side |
0.99±0.00 |
0.99±0.00 |
0.99±0.00 |
0.99±0.00 |
References
- 1. Abràmoff MD, Magalhães PJ, Ram SJ. 2004. Image processing with ImageJ. Biophotonics Int 11: 36-42.
- 2. Baek JH, Lee EG, Kim NH, Kim SL, Choi IC, Ji HS, Chung YS, Choi M-S, Moon J-K, Kim K-H. 2020. High throughput phenotyping for various traits on soybean seeds using image analysis. Sensors 20: 248
- 3. Choi SH, Park GH, Yang OS, Lee CW, Kim YU, Lee EG, Baek JH, Kim KH, Lee HR. 2020. Implementation of phenotype trait management system using OpenCV. J Korea Ind Inf Syst Res 25: 25-32.
- 4. Costa C, Schurr U, Loreto F, Menesatti P, Carpentier S. 2019. Plant phenotyping research trends, a science mapping approach. Front Plant Sci 9: 1933
- 5. Gencer O, Serce S. 2022. Determination of morphological, pomological and molecular variations among apples in Niğde, Turkey using iPBS primers. J Agric Sci 28: 296-306.
- 6. Golbach F, Kootstra G, Damjanovic S, Otten G, van de Zedde R. 2016. Validation of plant part measurements using a 3D reconstruction method suitable for high-throughput seedling phenotyping. Mach Vis Appl 27: 663-680.
- 7. Henke M, Neumann K, Altmann T, Gladilin E. 2021. Semi-automated ground truth segmentation and phenotyping of plant structures using k-means clustering of eigen-colors (kmSeg). Agriculture 11: 1098
- 8. Hüther P, Schandry N, Jandrasits K, Bezrukov I, Becker C. 2020. ARADEEPOPSIS, an automated workflow for top-view plant phenomics using semantic segmentation of leaf states. Plant Cell 32: 3674-3688.
- 9. Jaeger SR, Antúnez L, Ares G, Swaney-Stueve M, Jin D, Harker FR. 2018. Quality perceptions regarding external appearance of apples: Insights from experts and consumers in four countries. Postharvest Biol Technol 146: 99-107.
- 10. Jeon D, Kang Y, Lee S, Choi S, Sung Y, Lee T-H, Kim C. 2023. Digitalizing breeding in plants: a new trend of next-generation breeding based on genomic prediction. Front Plant Sci 14: 1092584.
- 11. Junker A, Muraya MM, Weigelt-Fischer K, Arana-Ceballos F, Klukas C, Melchinger AE, Meyer RC, Riewe D, Altmann T. 2015. Optimizing experimental procedures for quantitative evaluation of crop plant performance in high throughput phenotyping systems. Front Plant Sci 5: 770
- 12. Kang S-B, Moon Y-E, Kweon H-J, Park M-Y, Park W-J, Sagong D-H. 2016. Effect of exposed length of rootstocks on the occurrence of bitter pit and tree vigor of'Gamhong'/M. 26 apple cultivar. Korean J Soil Sci Fert 49: 449-455.
- 13. Kim S-J. 2020. Association analysis of sugar contents based on color information of apple fruit images. J KIIT 18: 41-49.
- 14. Kim Yu, Noh Y, Jae S, Hong SJ. 2017. A study on the augmented reality display for educating power tiller operator using chroma-key. J Agric Life Sci 51: 205-212.
- 15. Konstankiewicz K, Pawlak K, Zdunek A. 2001. Quantitative method for determining cell structural parameters of plant tissues. Int Agrophys 15: 161-164.
- 16. Kweon H-J, Park M-Y, Song Y-Y, Lee D-Y, Sagong D-H. 2019. Influence of crop load on bitter pit incidence and fruit quality of'Gamhong'/M. 9 adult apple trees. Korean J Environ Agric 38: 145-153.
- 17. Kwon YS, Kim J-H, Sagong D-H, Park JT. 2023. Influence of M. 7 Apple rootstock on productivity and fruit quality of high density 'Fuji', 'Hongro' and 'Sansa' apple trees. Korean J Environ Agric 42: 239-252.
- 18. Laraswati AA, Padjung R, Farid M, Nasaruddin N, Anshori MF, Nur A, Sakinah AI. 2021. Image Based-Phenotyping and Selection Index Based on Multivariate Analysis for Rice Hydroponic Screening under Drought Stress. Plant Breed Biotech 9: 272-286.
- 19. Lee CW, Choi IC, Lee HS, Kim NH, An ES, Kim SL, Baek JH, Ji HS, Yoon I-S, Kim K-H. 2021. Determination of the conditions for image analysis of rice based on a crop phenomic platform. Korean J Breed Sci 53: 450-457.
- 20. Lee MH, Baek J-k, Kim K-M, Kim K-H, Kang C-S, Lee GE, Choi JY, Son J, Ko J-M, Choi C. 2022. Assessment of cold tolerance traits of wheat cultivars using RGB images. Korean J Breed Sci 54: 171-176.
- 21. Sung DY. 2015. High-throughput phenotyping platforms for transgenic plants in the research and product development. Plant Breed Biotech 3: 291-298.
- 22. Tardieu F, Cabrera-Bosquet L, Pridmore T, Bennett M. 2017. Plant phenomics, from sensors to knowledge. Curr Biol 27: 770-783.
- 23. Trubetskaya A, Beckmann G, Wadenbäck J, Holm JK, Velaga SP, Weber R. 2017. One way of representing the size and shape of biomass particles in combustion modeling. Fuel 206: 675-683.
- 24. Yang W, Feng H, Zhang X, Zhang J, Doonan JH, Batchelor WD, Xiong L, Yan J. 2020. Crop phenomics and high-throughput phenotyping: Past decades, current challenges, and future perspectives. Mol Plant 13: 187-214.