적요
In the present study, we conducted a detailed analysis of the genetic diversity and structural organization of 96 domestic Korean rice varieties (Oryza sativa L.) using 2,565 high-resolution TCS-based single nucleotide polymorphism (SNP) markers. Genetic structural variations were investigated using diversity indices, PCA, genetic similarity, and network analysis. Genetic diversity analysis revealed a significant expansion of the genetic foundation after the 1980s, marked by a sharp increase in the number of alleles (Na) from the 2000s. Despite this, high genetic homogeneity was maintained, with an average similarity of 77.7%. The observed 10% difference among same-cross varieties suggests that critical genetic variations are fixed by strong selection pressures for quality traits. Network analysis (85% similarity threshold) confirmed that the Korean rice breeding population followed a distinct core-periphery model (eight communities). The connected 84 varieties had a centrality range of 0.01 0.39. Core Variety Groups (e.g., ‘Junam’ and ‘Sindongjin’) exhibited the highest centrality (up to 0.39), indicating their extensive use as key breeding parents and their function as the central axis of the genetic network. Bridge Variety Groups (e.g., ‘Hwayeong’ and ‘Samkwang’) played an intermediary role linking clusters. Crucially, 12 ‘isolated accessions’ showed zero centrality (0.00), representing a genetic disconnect from the main pool. This quantitative network-based assessment provides essential fundamental data for breeders to select appropriate germplasms. Furthermore, the findings suggest that the current cultivar naming system, which inadequately reflects genetic relationships, requires reassessment, and that the establishment of objective management standards based on this research is warranted.
서언
벼(
Oryza sativa L.)는 한국의 식량 안보에 있어 가장 중요한 작물로, 지난 반세기 동안 국가 정책에 따른 수량성, 재배 안정성 및 품질 증진 등 다양한 목표를 달성하기 위해 새로운 유전자원을 이용하는 등 품종 개발 사업이 진행되어 왔다(
Cho et al. 2020). 그러나 국내 재배여건에 적합한 계통을 집중적으로 선발하는 과정속에서 필연적으로 벼 품종의 유전적 다양성의 감소를 초래하였다(
Mo et al. 2020). 일반적으로 자포니카 벼품종은 인디카 벼품종보다 유전적 다양성이 협소하다고 알려져있으나(
Ni et al. 2002), 국내에서 육성된 자포니카 벼 품종은 유전적 다양성이 협소함에도 불구하고 농업적 주요 형질에서 표현형적 차이가 뚜렷하게 보인다(
Cheon et al. 2019,
Hori et al. 2017). 따라서 이러한 국내 벼 품종의 유전적 다양성 구조를 정밀하게 분석하고, 이에 따른 표현형적 차이를 명확히 규명할 필요가 있다.
벼 유전적 다양성 연구는 주로 소수의 RAPD (Randomly amplified polymorphic DNA)나 SSR (Simple sequence repeats) 마커 등을 활용하여 품종 간 다양성 및 유연관계를 확인하고 품종 판별 및 군집 분류를 수행하는 수준에 머물렀다(
Sun et al. 2009,
Xiao et al. 2012). 예를 들어,
Kwon et al. (1999)은 1930년부터 1997년까지 육성된 117개의 품종을 24개 RAPD와 17개 microsatellite 마커로 분석하여 육성 연도 및 기관별 유전적인 변이를 분석하였고,
Kim et al. (2017)은 1982년부터 2013년까지 육성된 243개 벼 품종을 20개 SSR 마커를 이용하여 품종 간 유전적 다양성을 분석하였다. 또한,
Mo et al. (2020)는 1970년부터 2006년에 육성된 179 품종을 192개 SSR 마커를 이용하여 유전적 다양성을 분석하고 출수기 등 농업형질과 연관분석한바 있다. 하지만 이러한 SSR 마커 기반 연구들은 다형성(polymorphism)은 높지만, 분석 효율성과 유전체상의 위치 정확도가 낮고, 마커 수가 제한적이라는 한계로 인해 유전적 구조의 세밀한 해석이나 정밀한 QTL (Quantitative trait locus) 분석에는 한계가 있다. 따라서 기존 마커의 한계를 극복하고 육종 효율성을 극대화하기 위해서는 더 높은 해상도의 유전체 정보가 필수적이며, 이를 충족시키는 SNP (Single Nucleotide Polymorphisms) 마커가 작물 유전학 및 육종 분야에서 가장 중요한 DNA 마커로 자리 잡았다.
SNP 마커는 유전체 전반에 걸쳐 풍부하게 분포하며, 공우성(codominant) 특징을 바탕으로 유전자 지도 작성, 전장 유전체 연관 분석(GWAS), 유전자원 다양성 분석, 마커 보조 선발 등 다양한 연구에 활용되고 있다(
Zhao et al. 2010). 특히, SNP 분석은 효율성, 안정성, 대량 분석에 대한 수요가 증가함에 따라 고속 대량 SNP 유전자형 분석 플랫폼 개발이 핵심이 되었다. 차세대 염기서열 분석(NGS) 기반 플랫폼 중 하나인 표적 포획 시퀀싱(Target Capture Sequencing, TCS) 기술은 수백에서 수천 개의 표적 SNP를 포함하는 DNA 조각을 프로브로 포획하여 염기서열을 분석하는 방식이다(
Lee et al. 2022). 이 기술은 적용 가능한 마커 수에 대한 유연성이 매우 높고 새로운 SNP를 쉽게 추가하여 플랫폼을 개선하기 용이하며, 벼를 포함한 옥수수 등 다양한 작물에서 효율적인 유전체 분석 시스템 구축에 핵심적인 역할을 한다(
Guo et al. 2019). 최근 TCS 기술을 활용한 벼 SNP 유전자형 분석 플랫폼이 개발되어 이를 이용한 유전적 분석 연구가 보고되었으나, TCS 기술의 확립과 수발아 QTL 등을 분석에 관한 내용으로 본 연구의 유전적 유사도와 네트워크 분석과는 거리가 멀다(
Lee et al. 2022).
국내에서 지역 특화 및 품종명을 활용한 브랜드 쌀 시장이 급격히 성장하면서, 미곡종합처리장(RPC) 중심의 특정 품종에 대한 의존도가 심화되는 현상이 나타났다. 대표적으로 전북의 ‘신동진’, 철원의 ‘오대’, 충남의 ‘삼광’, 경북의 ‘일품’ 등이 있으며, 이들 품종은 개발된 지 20여 년이 지났음에도 불구하고 해당 지역에서 오랜 기간 주력 품종으로 재배되고 있다. 이러한 품종 고착화 현상은 특정 품종의 높은 인지도를 활용한 RPC들의 브랜드 전략과 밀접하게 연관되어 있다. 일례로, 2024년 기준으로 전북 지역 RPC의 경우 88개 브랜드 중 37개가 ‘신동진’ 품종명을 포함할 정도로 특정 품종에 대한 의존이 심화되면서, 기존 품종의 우수한 특성을 유지하면서도 단점을 보완한 ‘유래 품종’을 개발하는 육종 전략이 해결 방안으로 추진되고 있다. 이에 농업 연구와 종자 산업의 경쟁력 확보에 핵심적인 품종 보호 및 명명 기준 설정에 대한 과학적 기반 마련이 시급하다. 신품종 등록 과정에서 유전적 유사성을 과학적으로 분석하는 것은 품종 간 차이를 명확히 규명하고 객관적인 품종 명명 기준을 확립하는 기반이 될 것이다. 그러나 현재 품종 특성에 대한 데이터베이스 구축이 미흡하며, 두 품종의 구별성을 판단하는 품종 간 유전적 최소거리(Minimum Distance) 기준의 법적 및 과학적 근거가 부족하여 관련 분쟁을 유발할 소지가 높다(
Kim et al. 2016).
본 연구는 TCS 기반의 정밀 SNP 마커를 활용하여 국내 밥쌀용 벼 품종의 유전적 변이와 구조를 규명하고자 수행되었다. 이를 위해 품종 간 유전적 유사도 및 네트워크 분석을 통해 한국 벼 육종 프로그램 내 핵심 품종들의 유전적 기여도와 구조적 특성을 정밀하게 분석하고자 하였다. 이러한 연구 결과는 국내 벼 유전적 다양성 확장을 위한 전략 수립의 근거가 될 뿐만 아니라, 향후 품종 보호 및 관리에 필요한 과학적 판단 기준을 마련하는 데 기여할 것으로 기대된다.
재료 및 방법
시험재료
본 연구에서는 국내외 다양한 기관에서 육성된 총 96개의 밥쌀용 벼 품종을 시험 재료로 활용하였다. 이들 품종은 농촌진흥청 국립식량과학원(1981-2024년, 83품종 및 7계통), 경기도농업기술원 및 전라남도농업기술원(2014-2020년, 3품종), 그리고 일본(1956-1991년, 3품종)에서 육성되었다. 시험에 사용된 모든 품종은 자포니카(Japonica) 생태형이며, 최고품질 벼, 표준품종, 재배안정성 등 다양한 육종 목표에 따라 구성되었다.
유전자형 분석
Genomic DNA 추출은 BioSprint 96 (Qiagen Co., D?ren, Germany)을 이용하였다. 샘플을 TissueLyserⅡ (QiagenCo., Düren, Germany)를 이용하여 마쇄한 후 BioSprint 96 DNA Plant Kit (Qiagen Co., D?ren, Germany)를 이용하여 DNA를 추출하였다. 유전자형 분석은 자포니카 벼 1,226 SNP, 인디카 벼 1,339 SNP에 대한 정보 등 총 2,565개 SNP로 구성된 Target capture sequencing SNP-genotyping platform을 이용하였다(
Cheon et al. 2019,
Lee et al. 2022). Target capture sequencing SNP-genotyping은 (주)인실리코젠(Yongin, Korea) incoFIT Targeted seq panel을 통해 분석되었다.
벼 품종 간 유연관계는 총 샘플의 10% 이상에서 결측이 발생한 117개 마커를 제외한 후 총 2,449개 마커를 이용하여 MEGA 11의 Neighbor-Joining method (Bootstrap 1,000회)로 분석하였다. 유전적 다양성 분석(Genetic Diversity Analysis)은 R (Version 4.0.2, The R Foundation for Statistical Computing Platform) 패키지 adegenet와 poppr를 이용하였다. 이 과정에서 육성 연대별 유전적 다양성 변화를 파악하기 위해 품종들을 육성 연도에 따라 분류하였고, 유전자형 데이터는 분석을 위해 숫자형 데이터(0, 1, 2)로 변환 후에 분석하였다.
유전적 유사도 분석
품종 간 유전적 유사도는 품종 간 결측 된 마커는 제거한 후 다형성을 보이는 마커 수를 확인하여 동질성을 확인하고 품종 간 마커 일치율(%)을 산출하였다. 히트맵 분석은 전체 96개 품종을 행, 열로 구성하였으며, Python 3.12.11 환경에서 seaborn 라이브러리를 활용하였고, 유사도 값은 색상으로 표현하였다.
네트워크 분석
96품종의 유전적 유사도 데이터를 기반으로 네트워크를 구축하기 위해 Python 3.12.11 환경에서 Pandas, NetworkX, Matplotlib, 라이브러리를 활용하였다. 네트워크 내에서 유전적 연관성이 높은 핵심 품종을 식별하기 위해 유전적 유사도 임계값(Threshold)은 85%로 설정하였다. 일반적으로 임계값이 낮으면 네트워크가 과포화(Over-saturated)되어 변별력이 떨어지며, 반대로 너무 높으면 유의미한 연결이 제외된다. 이에 따라, 벼 유전자원의 핵심 집단(Core collection) 선발 시 85% (SMC 0.85)를 최적의 임계값으로 설정한 선행연구(
Duan et al. 2025)의 기준을 준용하였다. 본 연구에서 밥쌀용 벼 품종들은 평균 유사도가 77.7%로 유전적 배경이 매우 긴밀하므로, 85%의 임계값 적용은 유전적 노이즈를 효과적으로 제거하고 실제 육종 계보를 반영하는 핵심 허브 품종을 식별하는 데 적합하였다. 이를 바탕으로 필터링된 연결 중심성(Filtered Degree Centrality)을 산출하여 핵심 품종의 육종적 기여도를 분석하였다. 각 품종은 네트워크의 노드(node)로 설정하였으며, 품종 간의 유전적 유사도가 85% 이상인 경우에만 엣지(edge)로 연결하였다. 네트워크의 연결 강도는 유사도 값을 반영하도록 엣지 가중치(weight)로 지정하였다. 연결 중심성은 특정 노드에 직접 연결된 엣지의 수를 정규화한 값으로, 해당 품종이 네트워크 내에서 얼마나 많은 다른 품종과 직접적으로 연결되어 있는지를 나타낸다. 연결 중심성은(해당 노드에 연결된 엣지(연결선)의 수) / (네트워크의 전체 노드 수 - 1)로 계산하였다. 예를들어 범위가 0.232 - 0.337면 이 그룹의 품종들이 다른 품종들과 전체 품종 수의 약 23.2%에서 33.7%에 해당하는 수만큼 직접 연결되어 있음을 의미한다. 구축된 네트워크는 Matplotlib을 이용하여 시각화하였다. 노드의 크기는 해당 품종의 중심성 값에 비례하게 설정하였다. 네트워크 분석에서 밀접하게 연결된 벼 품종 그룹을 식별하기 위해 python-louvain 라이브러리를 활용하여 커뮤니티를 탐지하고 네트워크 커뮤니티가 얼마나 잘 나뉘었는지 평가하는 지표인 모듈성 점수(modularity score)를 분석하였다.
결과 및 고찰
계통수 분석을 통한 품종 군집화
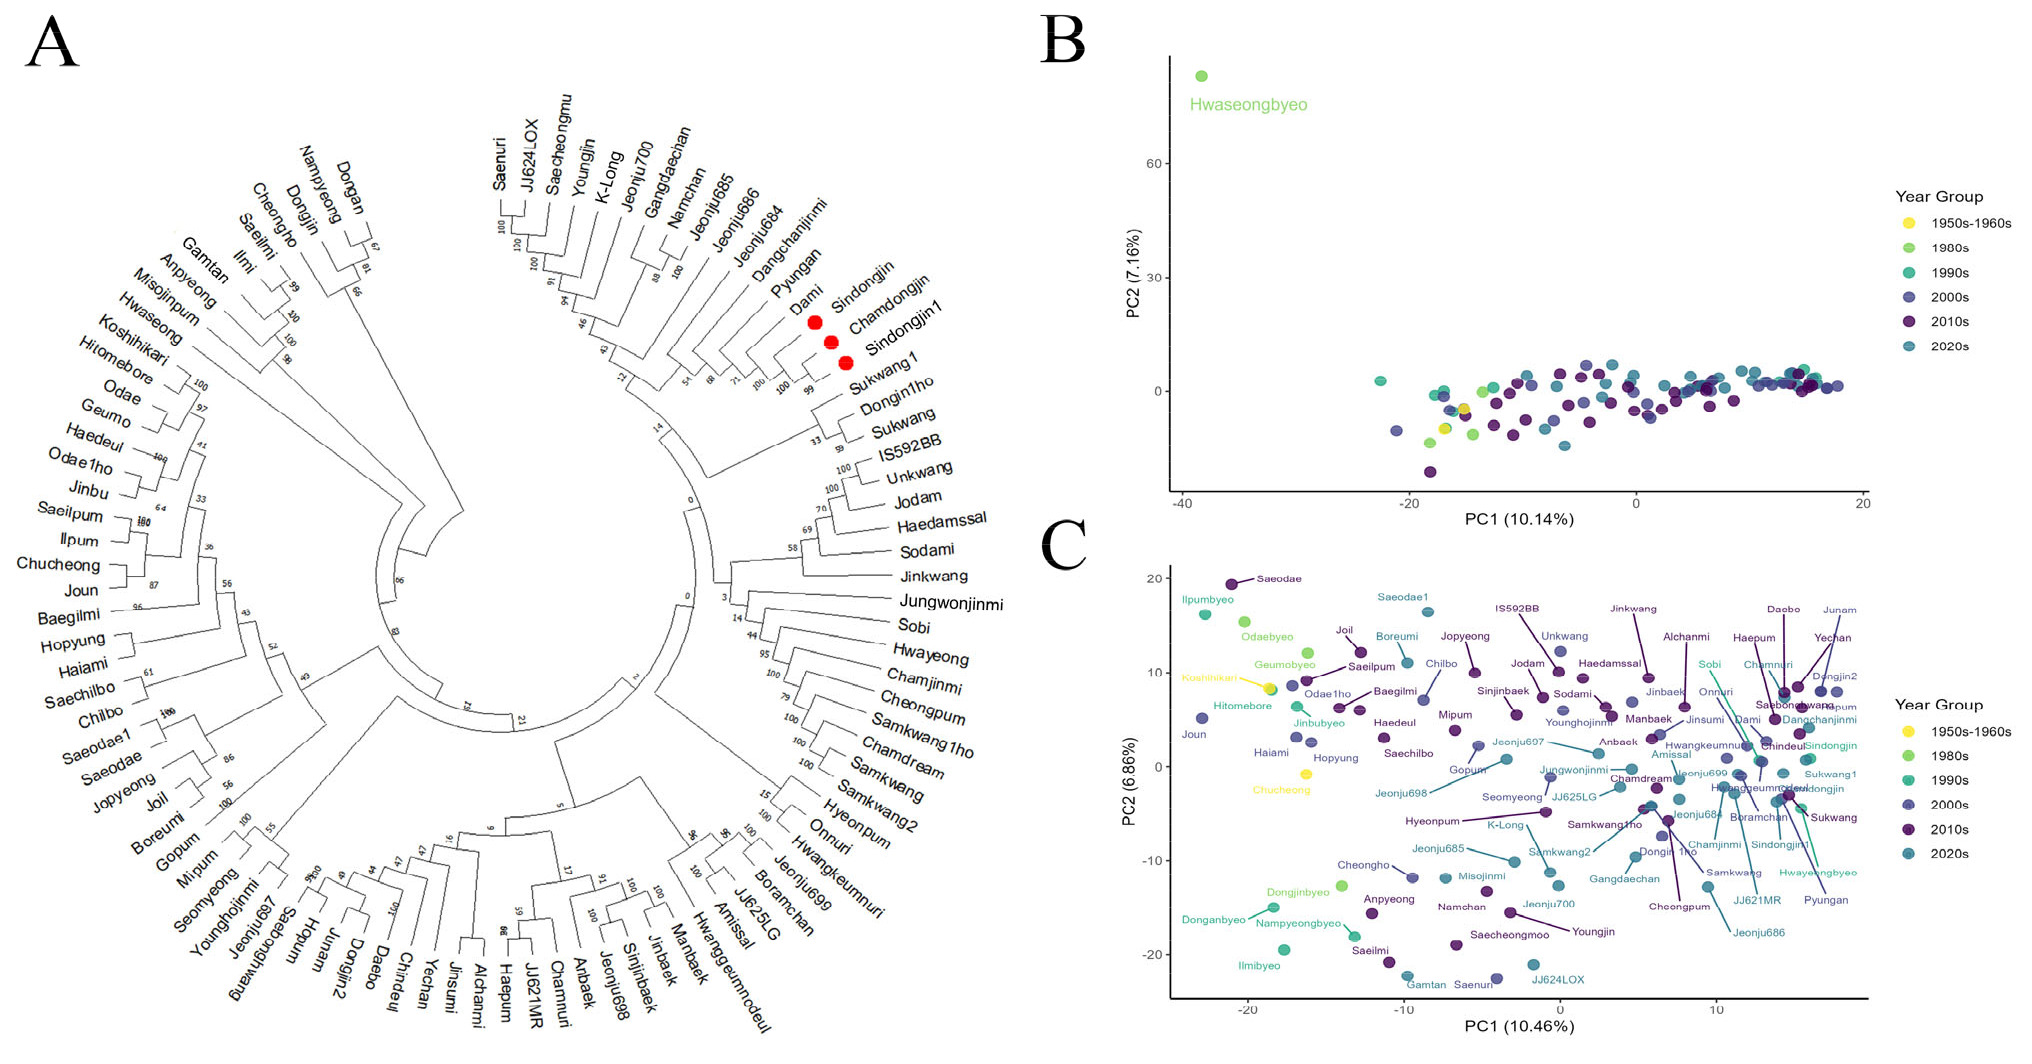
국내 밥쌀용 벼 96개 품종의 유전적 다형성을 파악하기 위해 2,449개 targeted capture sequencing 마커를 활용하여 계통수 분석을 수행하였다(
Fig. 1A). 분석 결과, 국내 육성 벼 품종들은 유전적 유사성에 따라 크게 5개의 주요 군집으로 명확히 구분되었다. 첫 번째 군집은 ‘동안벼’, ‘남평’, ‘동진’, ‘청호’ 등으로 구성되었으며, 두 번째 군집은 ‘새일미’, ‘일미’, ‘감탄’, ‘안평’, ‘미소진품’ 등이 포함되었다. 특히, 이들 군집은 높은 부트스트랩 값(bootstrap value)과 짧은 유전적 거리를 나타내어 통계적으로 유의한 유전적 근연관계를 확인하였다. 세 번째 군집은 ‘화성벼’ 단일 품종으로 명확하게 구분되었다. 네 번째 군집에는 ‘고시히카리’, ‘히토메보레’, ‘오대’, ‘금오’ 등 21개 품종이 포함되었으며, 다섯 번째 군집에는 ‘신동진’, ‘참동진’, ‘신동진1’, ‘다미’ 등 64개 품종이 포함되었으며 유전적 유사성이 높은 품종끼리 밀접하게 분포하는 양상을 보였다.
육성 연도별 유전적 다양성 변화육성 연도별 유전적 다양성 지표를 분석한 결과, 국내 벼 품종의 유전적 기반이 1980년대를 기점으로 크게 확대되었음이 확인되었다(
Table 1). 1950s-1960s 그룹은 기대되는 이형 접합도(He, 0.095)와 다형성 정보 함량(PIC, 0.072)이 모든 그룹 중 가장 낮게 나타났다. 그러나 1980년대 이후부터 유전적 다양성 지표가 급격히 증가하기 시작하여, 1990년대에 He는 0.14, PIC는 0.11로 상승했다. 특히 2000년대부터는 대립유전자 수(Na, 14.48)가 1990년대(5.70)에 비해 2.5배 이상 급증하여 유전적 다양성의 확대를 나타냈다. 모든 그룹에서 관찰된 이형접합도(Ho)는 기대되는 이형접합도(He)에 비해 매우 낮게 측정되었다. 1970년대 국내 벼 품종이 통일벼 계통 위주였기 때문에 밥쌀용 자포니카 품종의 육성 자체가 희소했으며, 본 연구의 표본에 해당 시기 품종이 적게 포함된 배경을 반영한다(
Cho et al. 2020). 또한, 이 시기에 포함된 소수의 계통을 중심으로 유전적 배경이 협소하게 형성되었던 당시 육종 역사도 시사한다. 그럼에도 불구하고 1980년대 이후 He와 PIC 값이 급격히 증가하며 유전적 다양성 기반이 확대되었다. 이는 통일벼 정책 이후 밥쌀용 품종 육성이 활성화되면서 육종기반이 확장되었음을 확인할 수 있다. 2000년대부터 대립유전자 수(Na, 14.48)는 1990년대(5.70)에 비해 급격히 증가하여, 새로운 육종 재료의 도입을 통한 유전적 다양화가 이루어졌음을 추정할 수 있다. 한편, 모든 그룹에서 관찰된 이형접합도(Ho)는 기대되는 이형접합도(He)에 비해 매우 낮게 나타났는데, 이는 벼의 자가수정 특성과 유전적 고정을 통한 순계 선발에 따른 높은 동형 접합성이 반영된 결과로 판단된다.
계통수 분석에서 나타난 유전적 유사성 경향은 주성분 분석(PCA) 결과에서도 일관되게 관찰되었다. 96개 품종 전체를 대상으로 수행한 PCA 분석(
Fig. 1B)에서, 품종들은 밀집된 군집을 형성했으며 PC1과 PC2가 각각 전체 유전적 변이의 10.14%와 7.16%를 설명하였다. 이후, 계통수 분석에서 독립 군집으로 분리되었던 ‘화성벼’를 제외한 95개 품종에 대해 PCA분석을 재수행하였다(
Fig. 1C). PC1과 PC2는 각각 전체 변이의 10.46%와 6.86%를 설명하며 품종 분포는 계통수 분석과 유사하게 유전적으로 가까운 품종들끼리 군집을 형성하는 경향을 나타냈다. 육성 연도에 따른 품종 분포를 PCA 분석한 결과, 완벽하게 분리되지는 않았으나 연도별 유전적 분화 경향을 확인할 수 있었다. 1950년부터 1990년 사이에 육성된 구품종들은 PC1 축의 왼쪽에 비교적 넓게 산재된 분포 양상을 보였으며, 2000년 이후에 육성된 신품종들은 PC1 축의 오른쪽에 비교적 밀집된 형태로 강한 군집을 형성하는 경향을 보였다. 이는 1970년대 이전부터 도입되어 1990년대까지 교배에 활용된 일본 품종 및 일본 유래 계통 중심의 비교적 협소했던 초기 자포니카 육종 배경에서, 2000년대 이후 새로운 유전 자원 도입과 교배를 통한 국내 자포니카 육종의 다변화가 이루어지면서 육종 재료의 유전적 배경이 크게 전환되었음을 보여준다. 이러한 구조적 전환은 유전적 다양성 지표에서도 뒷받침된다. 1980년대 이후 He와 PIC 값이 급격히 상승하고 2000년대부터 대립유전자 수(Na)가 폭발적으로 증가한 것은 새로운 유전 자원 및 교배 조합의 활용이 늘어났기 때문으로 사료된다(
Table 1). 1980년대 이후 다양성 확대 경향은 SSR마커를 사용한 선행 연구
Kwon et al. (1999)에서 1976-1990년에 유전적 다양성이 증가했다는 보고와 일치한다. 그러나 1990년대 이후 다양성 지표가 감소한다고 보고한 것과 다르게, 본 연구에서는 2000년대에 PIC값이 소폭 감소하는 경향을 보였음에도 NA값이 급격히 증가하는 유전적 다양화 양상이 확인되었다. 이러한 결과 차이는 선행연구에서 2000년대 이후 품종이 품종이 충분히 포함되지 않은 점과 더불어 마커 시스템의 차이 때문인 것으로 판단된다. 선행 연구에 활용된 SSR 마커는 다수 대립유전자 특성으로 인해 단일 마커의 PIC 값이 높게 나타나는 반면, SNP 마커는 이대립유전자 특성상 개별 마커의 PIC 값이 통계적으로 0.5 이하로 제한되므로 본 연구의 평균 PIC 값이 선행 연구보다 낮게 측정되는 것으로 사료된다. 본 연구는 2,565개 SNP 기반 TCS 고해상도 데이터를 활용하여 기존의 제한적인 마커 시스템으로는 확인하기 어려웠던 육성 품종의 유전적 다양화와 구조 변화를 파악하였다.
유전적 유사도 분석 결과 국내 밥쌀용 벼품종 간 평균 유전적 유사도는 77.7%, 범위는 59.7-99.9%였다(
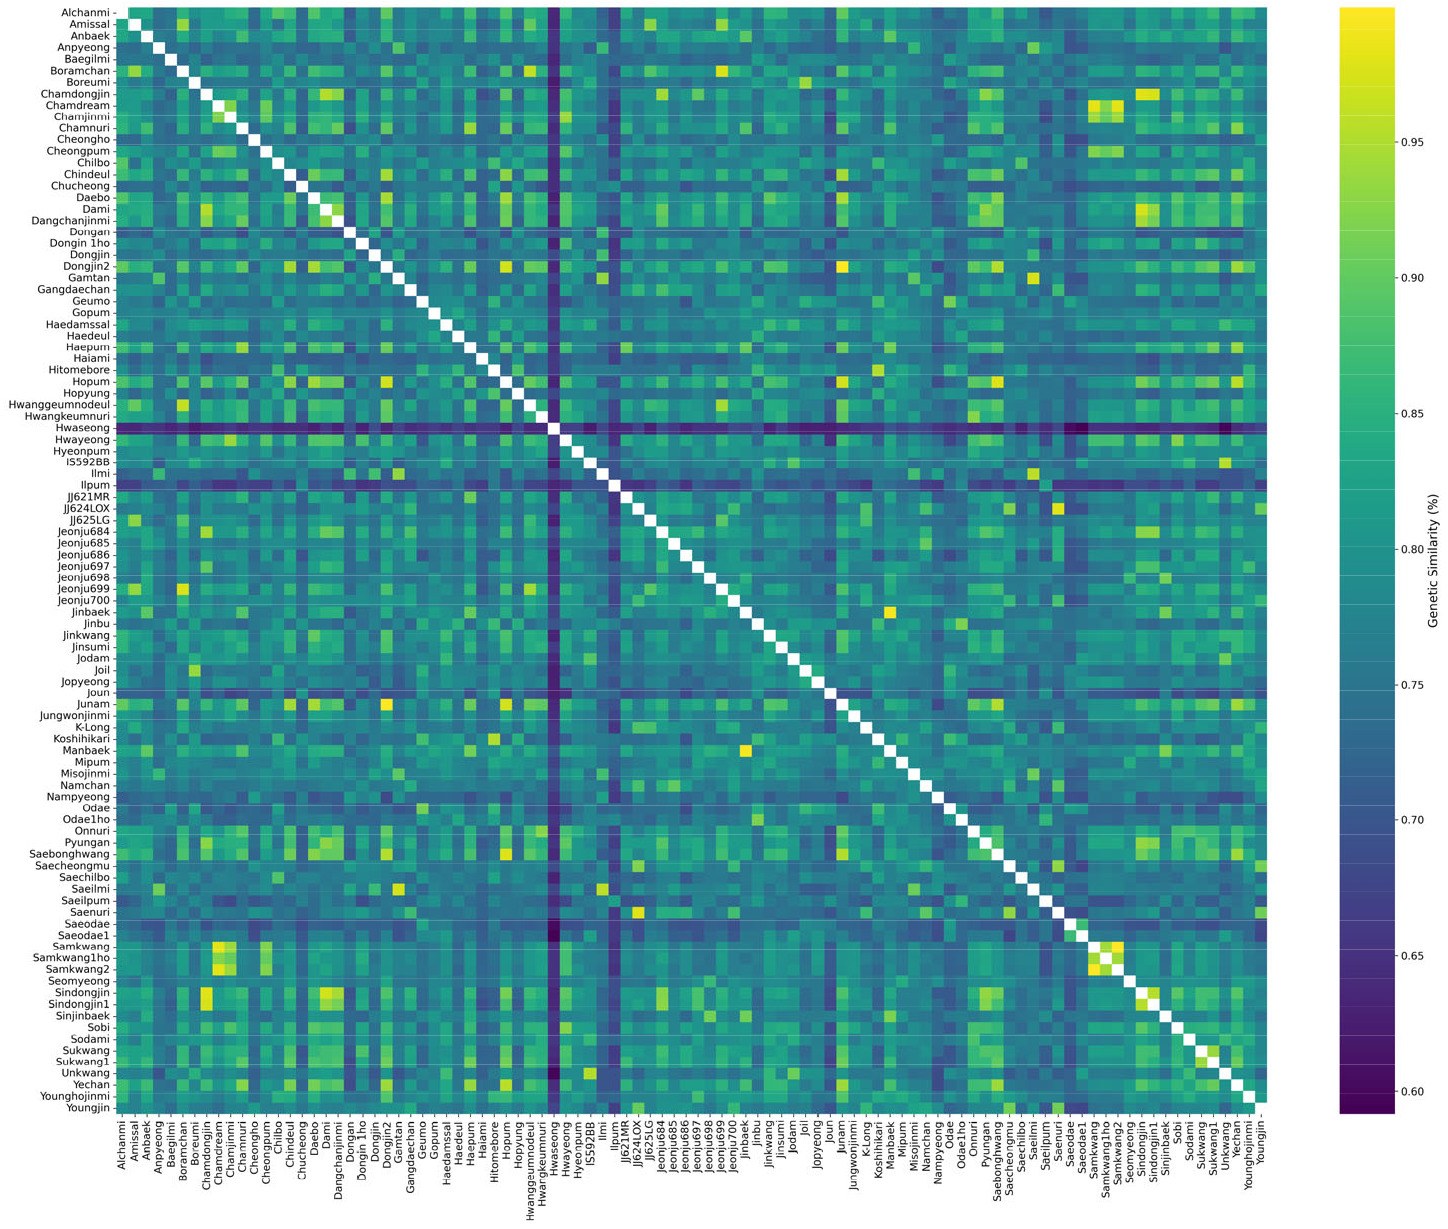
Table 2). 이는 국내 밥쌀용 품종이 유전적으로 매우 동질적이며 유전적 다양성이 제한적임을 확인할 수 있다. 국내에서 주로 재배되는 17품종의 유전적 유사도를 살펴보면 핵심 품종과 독립적인 배경을 형성한 품종들로 구분되었다. ‘주남’, ‘화영벼’, ‘신동진’, ‘보람찬’, ‘수광’ 등 5 품종은 모두 80% 이상의 높은 평균 유사도를 보였으며, 90% 이상의 높은 유사도를 가진 품종과 다수 연결되어 한국 벼 육종 프로그램에서 중점적으로 활용되어 왔음을 추정할 수 있다. 반면 독립적으로 특정 품종과 관계를 형성한 품종인 ‘일품벼’, ‘일미벼’, ‘새일미’ 등 3 품종은 각각 ‘새일품’(95.4%), ‘새일미’(95.8%), ‘감탄’(97.3) 등 특정 품종과 매우 높은 유사도를 보이며 밀접한 관계를 형성하지만, 다른 품종들과의 유사도는 상대적으로 낮은 경향을 보였다. ‘새오대’는 품종명이 유사한 ‘새오대1호’(86.8%)와 비교적 높은 유사도를 보였지만, 평균 유사도가 72.4%로 낮은 평균 유사도를 보였다. 이는 다른 주류 품종들과 유전적 거리가 가장 멀리 떨어져 있거나 독특한 유전적 배경을 가지고 있음을 추정할 수 있다. 일본 품종인 ‘고시히카리’는 평균 유사도 76.9%로, 일본품종 ‘히토메보레’(95.1%) 및 일부 국내품종(‘금오벼’, ‘오대벼’, ‘진부벼’, ‘칠보’ 등)과는 유사도가 비교적 높은 편이나 다른 밥쌀용 품종들과는 유사도가 낮아, 별개의 유전적 배경을 유지하고 있음을 확인 하였다. 96개 품종의 유전적 유사도 분포를 확인하기 위해 히트맵 분석을 수행하였다(
Fig. 2). 품종 간 유전적 유사성은 뚜렷한 차이를 보이며, 앞선 유전적 유사도 분석 결과를 시각적으로 재확인하였다. ‘주남’, ‘신동진’, ‘화영’ 등의 핵심 품종들은 96개 품종 중 다수의 특정 품종들과 높은 유전적 유사성을 나타내어 한국 육종프로그램에서 영향력이 큰 것을 확인 할 수 있었다. 이와 대조적으로, ‘일품’, ‘새오대’ 등은 다수의 품종들과 낮은 유사성을 보여 유전적 배경이 보다 분산되거나 독립적인 것으로 나타났다.
본 연구에서 유전적 유사도가 높은 품종들은 대부분 교배 모본이 같거나 원품종에서 파생된 유래품종이다. 예를 들어, 교배 조합이 같은 ‘신동진’과 ‘소비’(89.1%), ‘오대벼’와 ‘금오벼’(91.3%), ‘온누리’와 ‘황금누리’(90.6%)는 높은 유전적 유사도를 보였다. 주목할 점은 일부 품종에서 유사도가 95% 이상에 달하는 경우도 있었음에도 불구하고, 교배 조합이 같은 품종들 사이에서 8-11% 수준의 유전적 차이가 관찰된다는 점이다. 자가수정 작물에서 교배 조합이 같은 품종 간에 90% 내외의 유사도가 관찰되는 것은, 육종 초기 세대에서 유전적 재조합이 발생한 후 육종 과정 전반에 걸쳐 미질, 수량 등 특정 목표 형질에 대한 강한 선발 압력이 작용했음을 추정할 수 있다(
Kim et al. 2019,
Kwon et al. 1999,
Ma et al. 2025). 즉, 본 연구에서 90% 이상의 유사성은 육성 집단의 높은 유전적 동질성을 확인할 수 있는 지표이며, 10% 내외의 유전적 차이는 품종 분화를 초래하는 핵심 변이인 것으로 해석된다.
종합적으로, 본 연구의 유전적 유사도 분석은 밀접한 유전적 관계를 가진 품종들의 군집을 명확히 보여줄 뿐만 아니라, 벼 육종 역사에서 주요 품종의 중심성 및 유전적 영향력의 정도가 다양함을 확인하는 데 중요한 근거를 제시한다(
Woo et al. 2022,
Yi et al. 2006,
Yi 2020). 이름이 유사한 품종들의 유전적 관계를 분석한 결과, ‘동진벼’ 계열(‘동진1호’, ‘동진2’, ‘신동진’, ‘참동진’, ‘신동진1’)이나 ‘오대벼’ 계열(‘오대1호’, ‘새오대’, ‘새오대1호’)처럼 유사한 이름을 가진 품종들은 대부분 원품종을 교배 모본으로 활용하였기에 유전적 유사도가 높은 편이었다. 하지만 주목할 점은 유사한 이름에도 불구하고 유전적으로 동질성이 크게 떨어진 경우이다. ‘동진벼’는 5개 관련 품종 모두와 유사도가 낮았으며, ‘오대벼’ 역시 3개 관련 품종과 유사도가 낮았다. 반면, ‘신동진’, ‘참동진’, ‘신동진1’ 품종들 간 유전적 유사도가 높거나, ‘새오대’와 ‘새오대1호’ 간 유사도가 높은 것처럼, 유사 품종명이라도 그 관계는 복잡했다. 이러한 결과는 품종명이 유사하더라도 유전적으로는 유사성이 낮을 수 있음을 보여준다. 이는 품종명 명명 시 유전적 유래에 근거한 명확하고 객관적인 관리 기준이 미흡하여, 결과적으로 시장과 농가, 소비자의 혼란을 야기할 수 있다(
Kim & Shin 2023,
Sung et al. 2009). 따라서 유통 및 종자 관리에 있어 혼란을 줄이고 정확한 정보를 제공하기 위해, 유래 품종에 대한 유전적 유사도 및 명명 기준이 필요하며 본 연구가 기초자료로 활용될 수 있다.
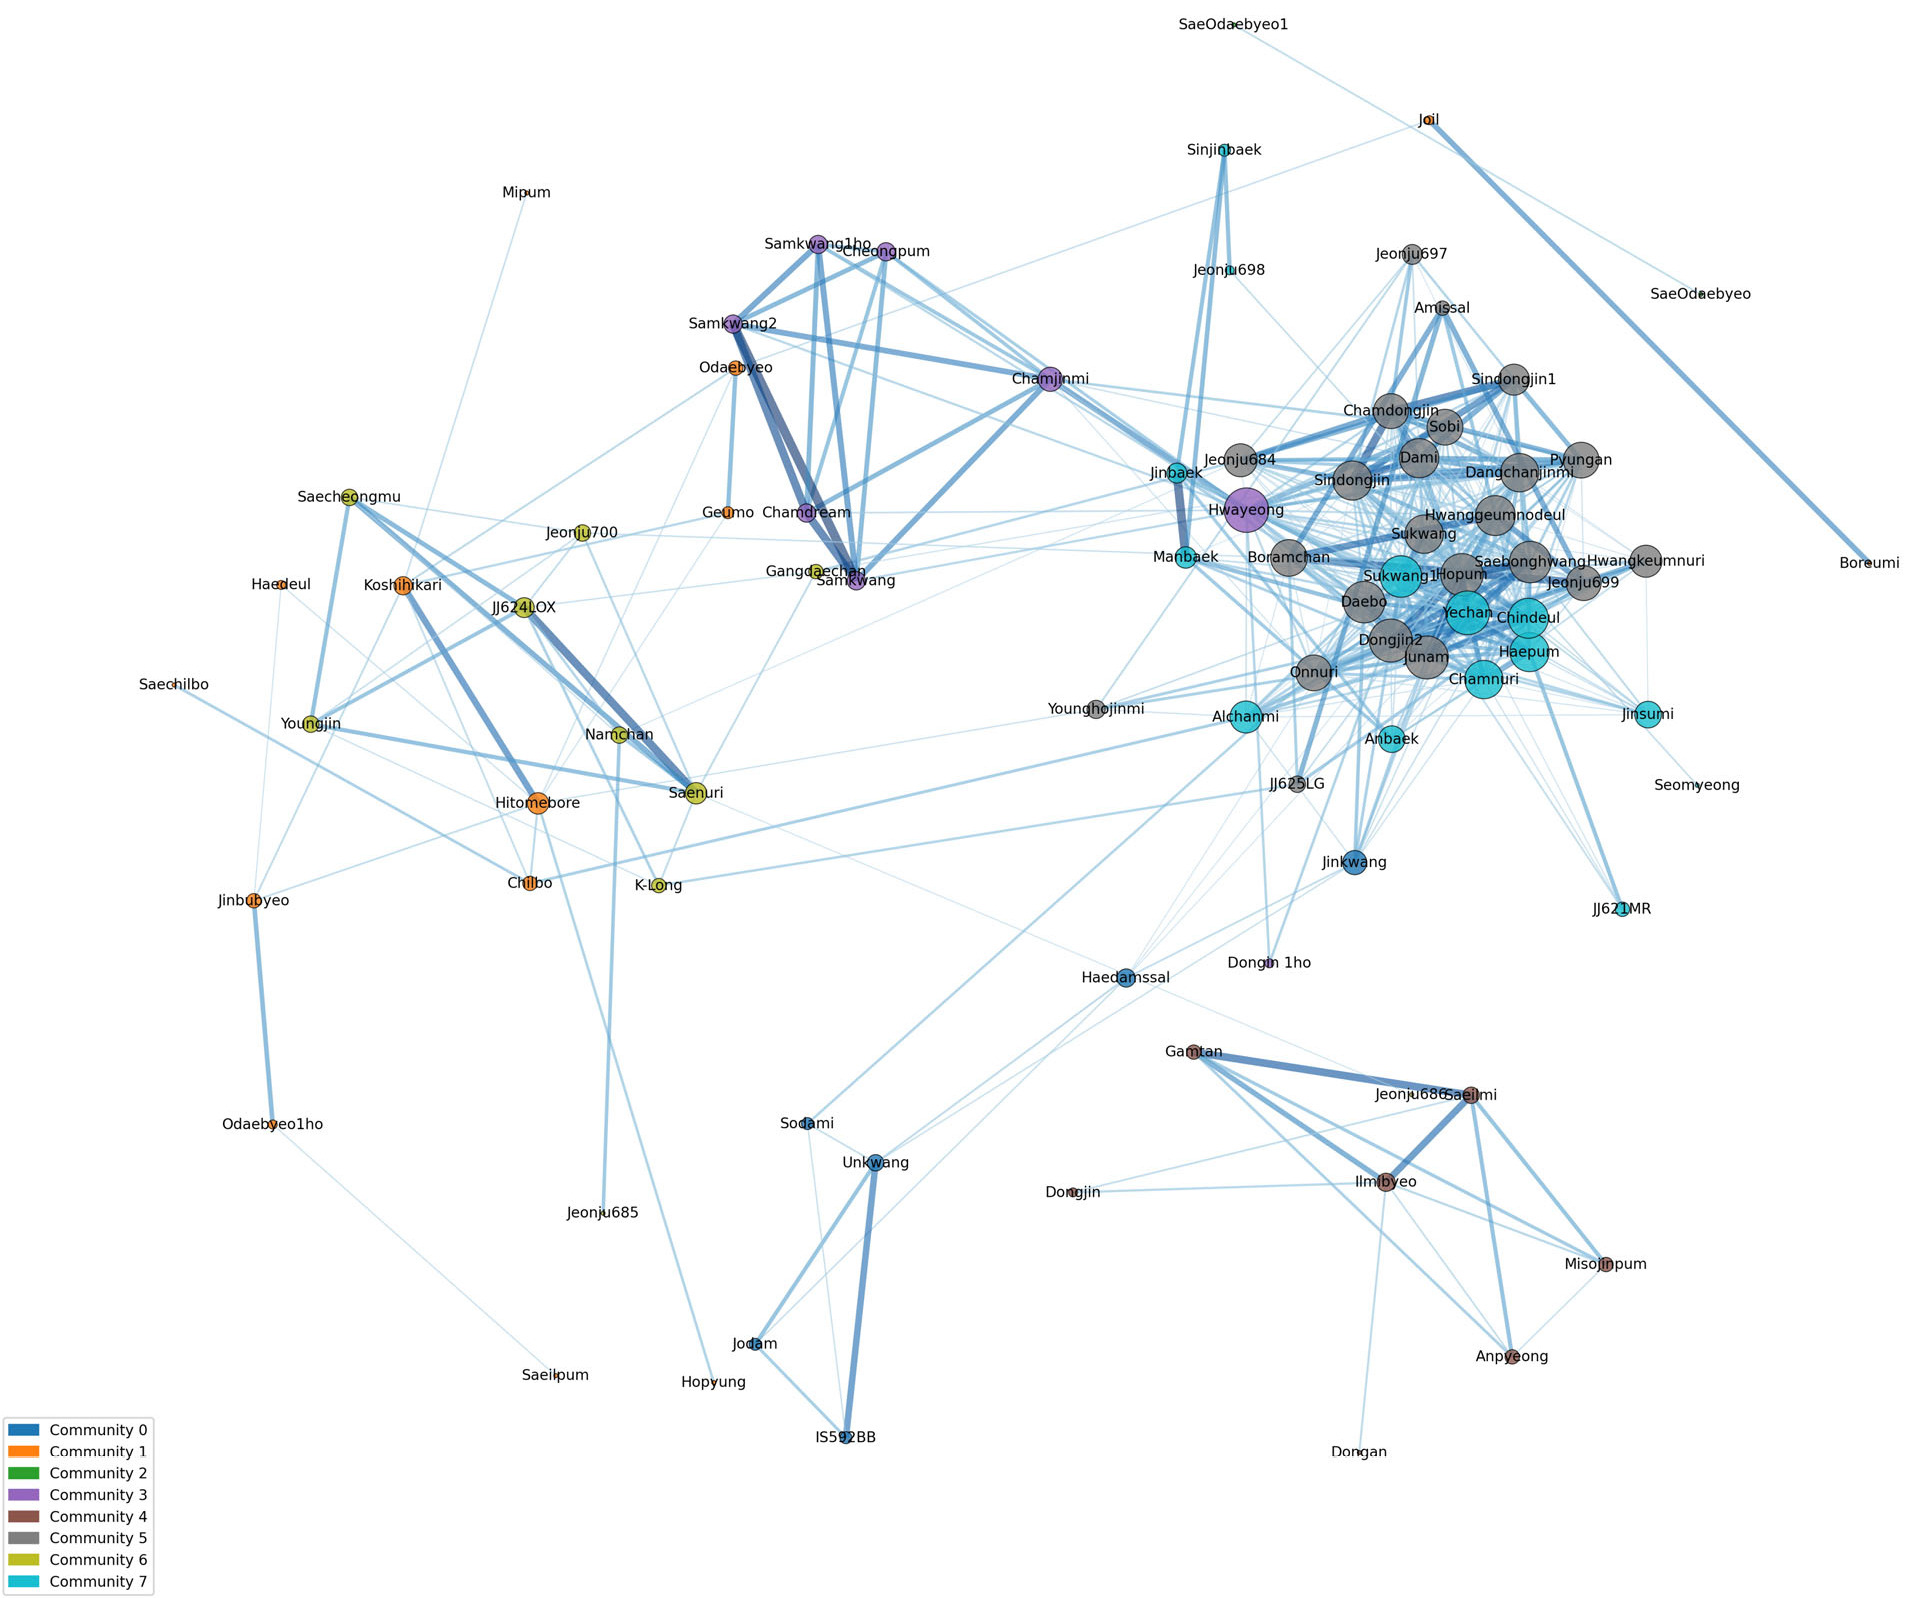
품종 간 유전적 구조 관계를 해석하기 위하여 연결 중심성 분석을 수행하였다(
Supplementary Table 1). 유전적 유사도 85%를 기준으로 필터링하여 분석한 결과, 96개 벼 품종 중 84개가 선정되었고 이들의 연결 중심성(Filtered Degree Centrality)은 평균 0.13, 범위는 0.01-0.39였다. 나머지 12개 품종은 연결 중심성이 0.00인 고립 품종군(Isolated variety)으로 분류되었다. 필터링된 연결 중심성을 기반으로 네트워크를 구축하였다(
Fig. 3). 각 노드(품종명)의 크기는 중심성(Centrality)의 정도를 반영하며, 노드가 클수록 해당 품종이 네트워크 내에서 핵심적인 역할을 수행함을 의미한다. 또한, 품종 간을 연결하는 선(Edge)의 색상과 두께는 유전적 유사도를 나타내어, 선이 짙고 굵을수록 두 품종 간의 유전적 관계가 강함을 시사한다. 네트워크 분석에서 84품종은 총 8개 커뮤니티로 구분되었다. 네트워크 중심에 위치한 핵심(core) 품종 군인 커뮤니티 5에는 ‘주남’, ‘신동진’, ‘수광’, ‘동진2’, ‘보람찬’, ‘황금노들’ 등 23 품종이 속했으며 커뮤니티 7에는 ‘해품’, ‘예찬’, ‘알찬미’, ‘신진백’, ‘수광1’ 등 14 품종이 속했다. 이들은 다수의 품종과 높은 유전적 유사도를 바탕으로 조밀한 연결망을 형성하며 네트워크의 중심 허브 역할을 수행하였다. 이는 이들 품종이 유전적으로 매우 중요한 위치를 차지하며, 과거 육종 과정에서 광범위하게 활용되었거나 현재 육종 프로그램에서 핵심적인 재료일 가능성이 높다는 것을 시사한다. 네트워크 중심에서 약간 벗어나 위치하는 Bridge 품종군인 커뮤니티 3에는 ‘화영’, ‘삼광’, ‘청품’, ‘동진1호’ 등 8품종이 속했으며, 이들 품종은 네트워크의 중심부와 주변부 사이에 위치하며 이들은 핵심품종 군보다는 적은 수의 품종과 연결되지만, 여러 클러스터 사이를 이어주는 징검다리 역할을 수행하는 것으로 해석된다. 또한 서로 다른 유전적 배경을 가진 품종들을 연결하여 유전적 다양성을 유지하는 데 기여하는 것으로 판단된다. 네트워크 주변부에 분포하는 주변부(Periphery) 품종군에는 커뮤니티 0, 1, 2, 4, 6가 있으며 각각 6, 14, 2, 7, 10 품종이 속했다. 이들은 중심성이 낮고 연결된 품종 수가 적거나 유전적으로 분리된 독립적인 클러스터를 형성하는 경향을 보였다. 커뮤니티 0은 ‘운광’에서 유래된 품종이거나 출수기가 빠른 조생종 품종들로 구성되었고, 커뮤니티 1에는 일본품종인 ‘고시히카리’와 ‘히토메보레’, 그리고 이들을 교배친으로 활용하여 육성된 품종 등이 구성되었다. 커뮤니티 2는 ‘새오대벼’와 ‘새오대1’로 구성되었다. 커뮤니티 4는 ‘동진벼’와 ‘일미벼’, 그리고 ‘일미벼’를 교배친으로 활용되어 육성된 품종 등으로 구성되었다. 커뮤니티 6은 ‘새누리’와 ‘새누리’를 교배친으로 활용되어 육성된 품종 등으로 구성되었다. 이처럼 5개 커뮤니티는 네트워크 주변부에 위치해 있으며 커뮤니티 간 독립적인 유전적 배경을 가지고 있는 것으로 확인할 수 있다. ‘고립 품종군(Isolated variety)’은 총 12개 품종이 속했다. 여기에는 1960년대에 육성된 ‘추청’, 1980년대에 육성된 ‘화성벼’, 1990년대 육성된 ‘일품벼’, ‘남평벼’를 비롯하여 2000년대 후에 육성된 ‘백일미’, ‘고품’, ‘하이아미’, ‘현품’, ‘조평’, ‘조운’, ‘중원진미’ 등이 포함된다. 유전적 계통수 및 PCA 분석에서 독립 군집으로 분리된 ‘화성벼’가 네트워크 분석에서 고립 품종군으로 분류된 것은 두 분석 간 결과의 일관성을 확인할 수 있다. 또한 현재 농가에서 재배되고 있는 품종인 ‘추청’, ‘일품벼’, ‘남평벼’ 등은 현대 육종 프로그램의 주류 계보와는 유전적으로 단절되어 있음을 시사한다.
본 분석을 통해 한국 벼 품종의 유전적 구조가 소수의 핵심 품종을 중심으로 한 중심-주변 모델(Core-Periphery Model)을 따른다는 것을 확인하였다(
Jones & Manseau 2022,
Rombach et al. 2017). 단순한 유전적 유사도를 넘어, 품종 간의 기능적 중요도와 영향력을 시각적으로 해석할 수 있다. 이는 고중심성 품종군인 커뮤니티 5와 7은 광범위한 유전적 다양성을 공유하며 육종 효율을 높이는 데 기여하고, 중간 및 주변부에 위치한 품종군 및 고립 품종군은 새로운 형질을 도입하거나 유전적 다양성을 확장하기위한 전략적 자원으로 활용될 수 있음을 의미한다. 또한 원품종에서 유래된 고유사도 품종들이 동일한 커뮤니티로 묶인 것은 품종 계보 관계를 잘 반영하고 있음을 보여준다.
따라서 본 연구에서 활용된 중심성 기반의 네트워크 분석은 육종가들이 품종 간의 관계를 파악하고, 육종 목표에 따라 적합한 재료를 선발할 때 필요한 기초자료로서 활용될 수 있을 것이다.
적요
본 연구는 TCS기반 SNP 마커를 활용하여 국내 밥쌀용 벼 품종의 유전적 다양성 및 구조 변화를 정밀하게 분석하였다. 2,565개 SNP 마커를 이용하여 96개 벼 품종의 유전형을 분석한 후 유전적 다양성 지표, PCA 분석, 유전적 유사도, 그리고 네트워크 분석 기법을 이용하여 구조적 변이를 파악하였다. 유전적 다양성 분석 결과, 1980년대 이후 대립유전자 수(Na)가 급격히 증가하며 새로운 유전 자원의 도입이 확인되었고, PCA 및 유전적 유사도 분석을 통해 2000년대 이후 품종들이 밀집된 형태로 강한 군집을 형성하며 높은 유전적 동질성을 유지하고 있음을 확인하였다. 분석된 품종들의 평균 유전적 유사도는 77.7%였으며, 범위는 59.7%에서 99.9%로 넓게 나타났다. 교배 조합이 같은 품종들 간 90% 내외의 유사도가 관찰되었는데, 이는 약 10%의 유전적 차이가 미질 등 특정 목표 형질에 대한 강력한 선발 압력을 통해 고정된 것으로 해석할 수 있다. 네트워크 분석 결과, 국내 벼 육종 집단이 ‘중심-주변 모델’(Core-Periphery Model)을 따름이 확인되었다. 84개 품종의 연결 중심성은 평균 0.13, 범위 0.01-0.39였으며, ‘주남’, ‘신동진’ 등이 최대 0.39의 높은 중심성을 보이며 핵심 품종군 역할을 수행하였다. 네트워크의 중심부와 주변부 사이에 위치한 Bridge 품종군(‘화영’, ‘삼광’ 등)은 핵심품종과 여러 클러스터 사이를 이어주는 징검다리 역할을 수행하는 것으로 해석된다. 중심성이 0.01 이상인 주변부 품종군(‘새일미’, ‘운광’ 등) 독립적인 유전적 배경을 가진 주변부 클러스터를 형성하였다. 특히, 중심성이 0.00인 12개 ‘고립 품종(Isolated variety)’은 유전적 단절을 보이며 유전적 다양성 확대를 위한 전략적 자원으로서의 가치를 시사한다. 네트워크 분석을 통해 핵심 품종군이 광범위한 유전적 다양성을 공유하며, 주변부 및 고립품종 군이 유전적 다양성 확장을 위한 전략적 자원으로 활용될 수 있음이 확인되었다. 따라서 본 연구는 육종 목표에 따라 적합한 재료를 선발할 때 필요한 기초자료로서 활용될 수 있다. 나아가 유전적 관계를 반영하지 못하는 현행 품종 명명 방식의 개선 필요성이 제기되며, 본 연구 결과를 바탕으로 객관적인 관리 기준을 마련하는 방안이 필요하다고 판단된다.
보충자료
본문의 Supplementary Table 1은 한국육종학회지 홈페이지에서 확인할 수 있습니다.
사사
본 논문은 농촌진흥청 작물시험연구사업(남부지역 적응 밥쌀용 재배안정성 벼 품종개발(3단계)(2주관), 과제번호: PJ01606702)의 지원으로 수행된 결과입니다.
Fig. 1Genetic relationship and principal component analysis (PCA) of 96 Korean rice cultivars based on 2,449 SNP markers. (A) Unrooted neighbor-joining (NJ) phylogenetic tree constructed from 96 rice cultivars using 2,449 SNP markers from a targeted sequencing panel. Bootstrap values are indicated at each node. Closely related cultivars such as Shindongjin, Chamdongjin1, and Chamdonjin are clustered together (highlighted in red). (B) Principal component analysis (PCA) of the same 96 cultivars using the same SNP panel. The first two principal components (PC1 and PC2) explained 10.14% and 7.16% of the total variance, respectively. Hwaseongbyeo is distantly separated from the main cluster. (C) PCA performed after excluding the Hwaseongbyeo identified in panel (B), resulting in a clearer distribution and separation among the remaining 95 cultivars.
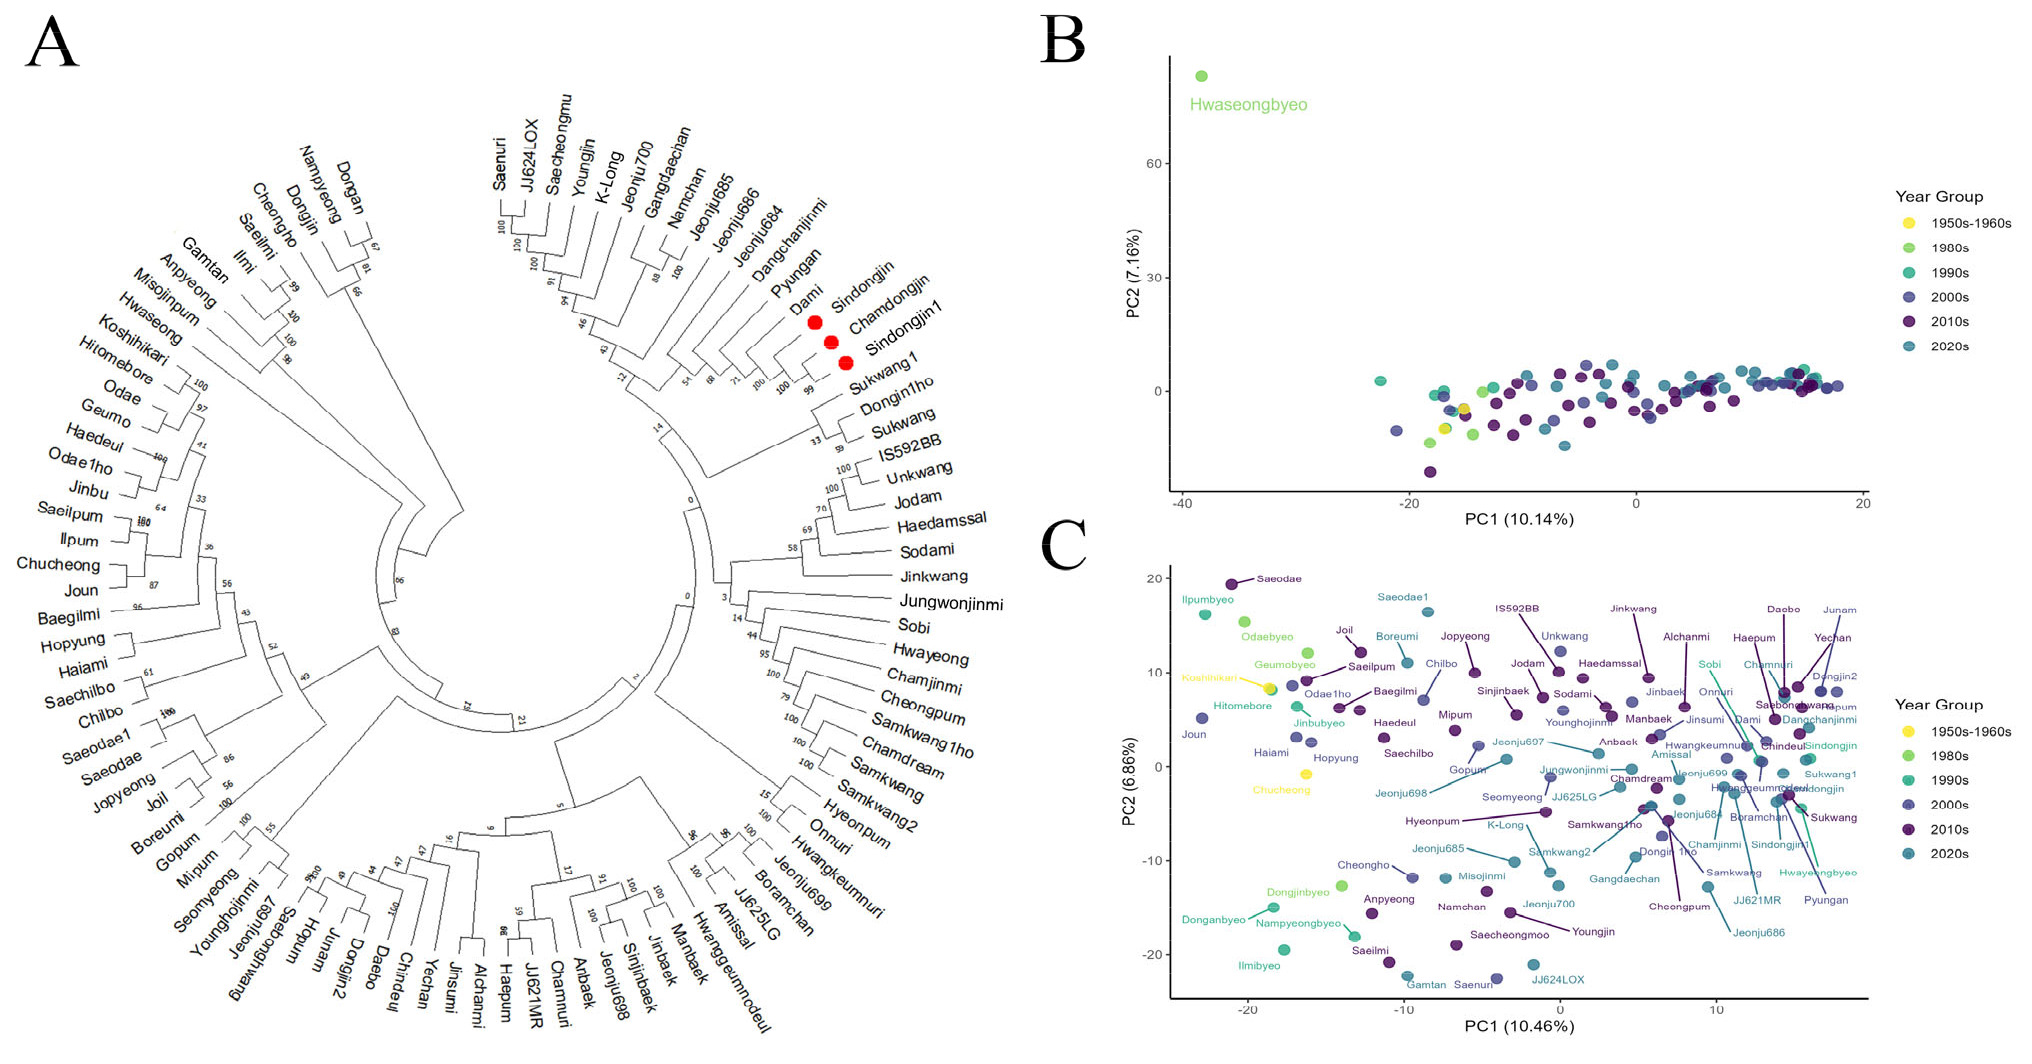
Fig. 2Pairwise genetic similarity analysis of rice varieties. A heatmap visualizing the pairwise genetic similarities (%) among 96 domestic rice varieties, calculated using 2,565 targeted capture sequencing markers. Rows and columns represent the major and all varieties, respectively. The color gradient indicates the similarity level: lighter shades (yellow) represent higher similarity, while darker shades (blue) represent lower similarity, as shown in the scale bar. The diagonal line of 100% similarity confirms the identity of the same varieties.
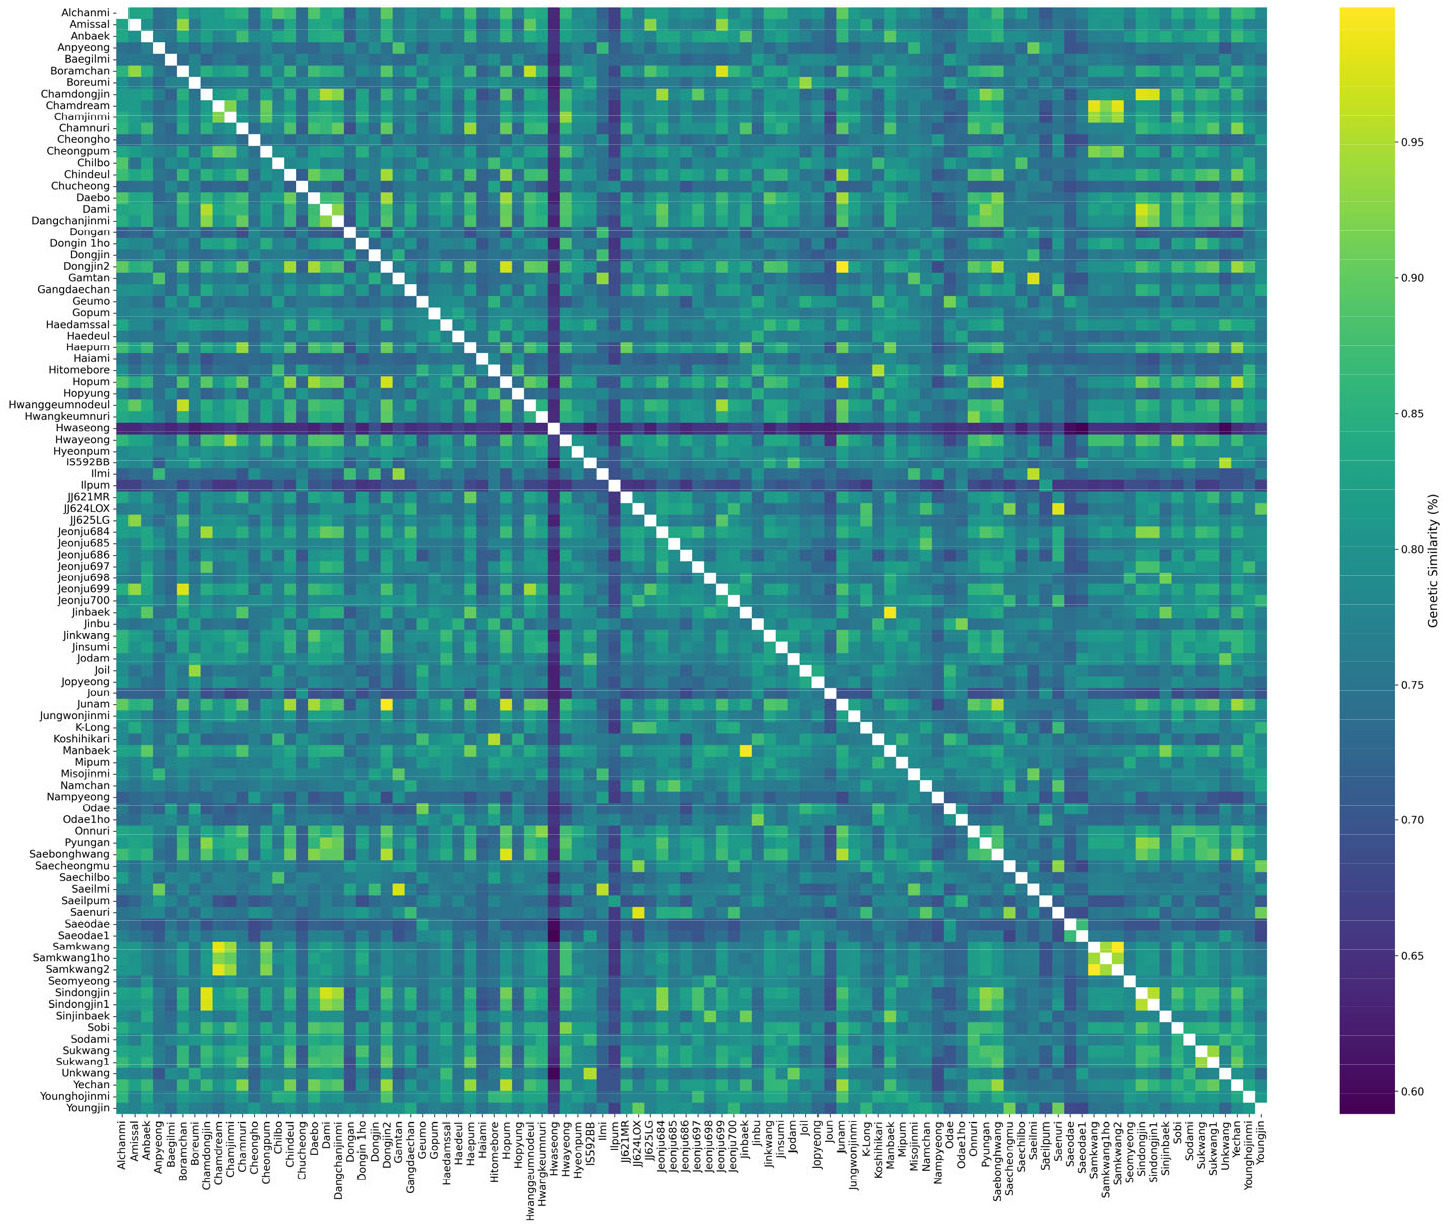
Fig. 3Genetic network analysis and classification of Korean rice varieties. The network structure of 96 Korean rice varieties was constructed based on a genetic similarity threshold of 85%. The analysis revealed eight distinct communities (0-7) and the overall structure follows a Core-Periphery Model. The size of each node revealed its filtered degree centrality, indicating its functional importance within the network.
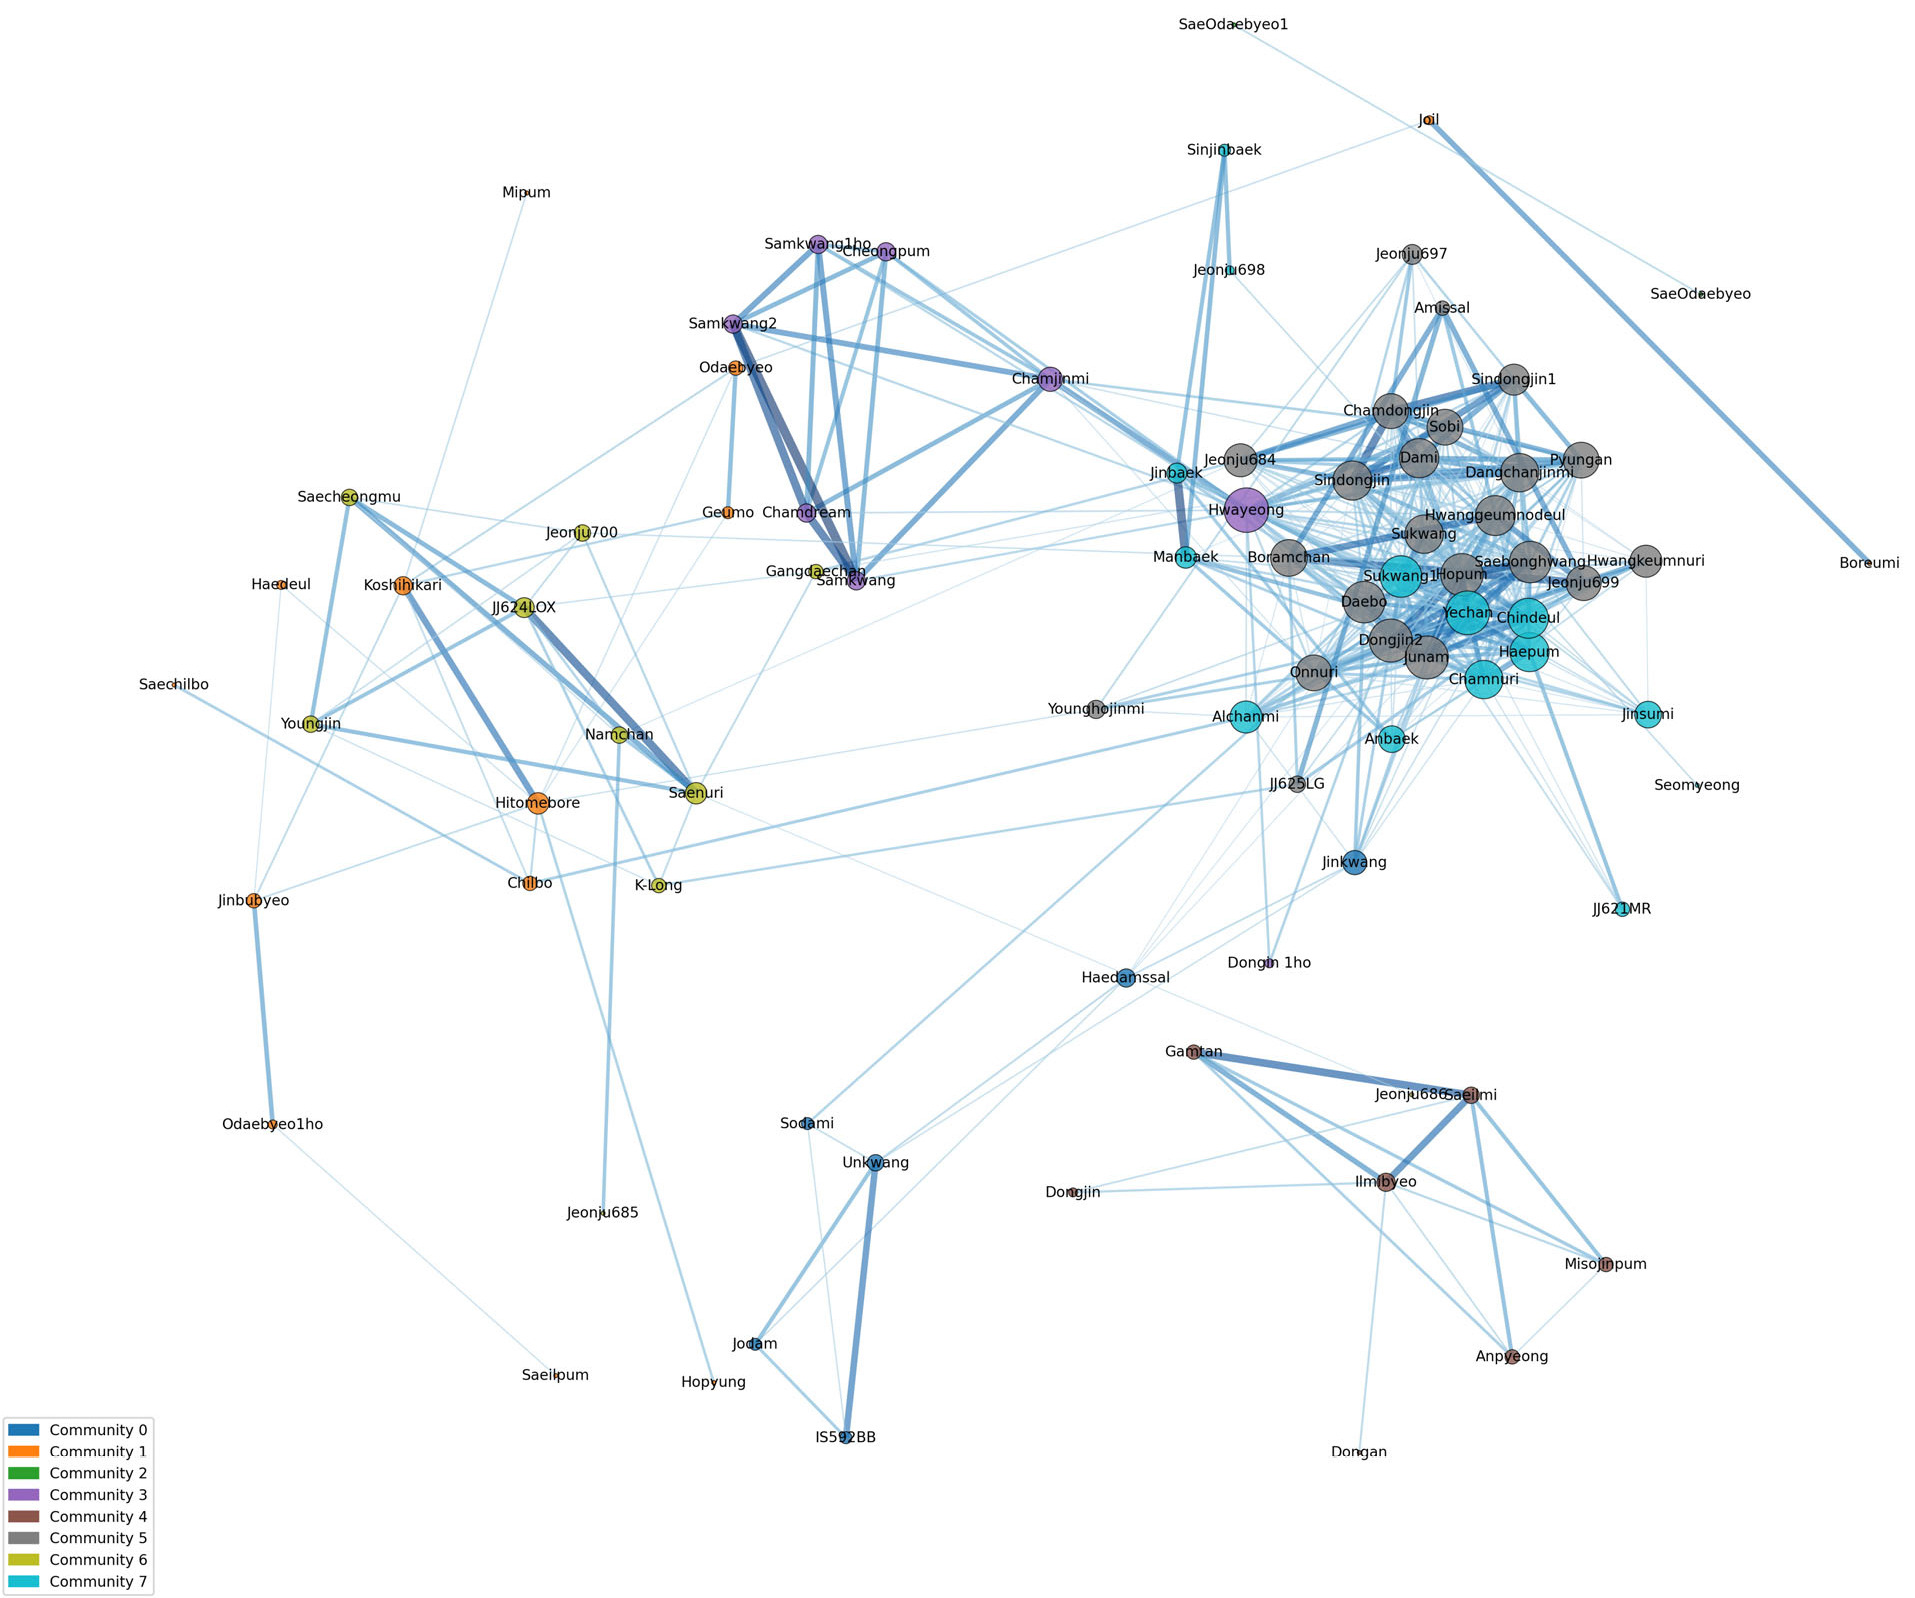
Table 1Summary of genetic diversity indices of Korean rice varieties by year group.
Table 1
|
Group |
Ho |
He |
Na |
Ne |
PIC |
|
Overall |
0.008 |
0.213 |
59.21 |
1.27 |
0.168 |
|
1950s-1960s |
0.001 |
0.095 |
1.22 |
1.11 |
0.072 |
|
1980s |
0.056 |
0.167 |
2.58 |
1.20 |
0.132 |
|
1990s |
0.019 |
0.207 |
5.70 |
1.26 |
0.163 |
|
2000s |
0.003 |
0.199 |
14.48 |
1.25 |
0.158 |
|
2010s |
0.004 |
0.207 |
20.07 |
1.26 |
0.163 |
|
2020s |
0.005 |
0.195 |
15.73 |
1.24 |
0.155 |
Table 2Genetic similarity statistics of Korean rice varieties and detailed analysis for major varieties.
Table 2
|
No. |
Major variety |
Avg. (%) (Range) |
Genetically Similar Varieties |
|
1 |
Junam |
81.5 (63.8-99.9) |
Dongjin2 (99.9), Hopum (97.0), Saebonghwang (95), Daebo (94.5), Chindeul (94.3), etc. |
|
2 |
Hwayeongbyeo |
80.6 (65-93.6) |
Chamjinmi (93.6), Sobi (92.2), Pyeongan (89.6), Sindongjin (89.4), Cheongpum (89.0), etc. |
|
3 |
Sindongjin |
80.5 (63.5-97.9) |
Chamdongjin (97.9), Dami (97.2), Sindongjin1 (95.3), Dangchanjinmi (94.5), Pyeongan (93.3), etc. |
|
4 |
Boramchan |
80.5 (65.2-97.7) |
Jeonju699 (97.7), Hwanggeumnodeul (96.1), Amissal (93.4), Junam (89.2), Dongjin2 (89.2), etc. |
|
5 |
Sukwang |
80.0 (64.7-93.6) |
Sukwang1 (93.6), Hopum (89.2), Junam (88.9), Dongjin2 (88.9), Pyeongan (88.6), etc. |
|
6 |
Younghojinmi |
79.5 (70.0-88.7) |
Junam (88.7), Dongjin2 (88.7), Jeonju697 (87), Hopum (86.4), Hitomebore (85.9), etc. |
|
7 |
Samkwang |
78.3 (65.0-99.9) |
Samkwang2 (99.9), Chamdream (98.1), Samkwang1 (94.2), Chamjinmi (93.9), Cheongpum (92.0), etc. |
|
8 |
Chilbo |
77.9 (64.1-88.8) |
Alchanmi (88.8), Saechilbo (88.5), Hitomebore (87.3), Koshihikari (86.7), Younghojinmi (84.7), etc. |
|
9 |
Saenuri |
77.0 (67.9-98.0) |
JJ624LOX (98.0), Saecheongmu (93.1), Youngjin (91.0), Namchan (89.6), Jeonju700 (87.5), etc. |
|
10 |
Unkwang |
76.9 (59.7-95.2) |
IS592BB (95.2), Jodam (90.7), Haedamssal (87.0), Sodami (86.6), Jinkwang (86.0), etc. |
|
11 |
Koshihikari |
76.9 (65.8-95.1) |
Hitomebore (95.1), Geumobyeo (87.7), Odaebyeo (87.2), Jinbubyeo (86.9), Chilbo (86.7), etc. |
|
12 |
Saeilmi |
76.8 (67.6-97.3) |
Gamtan (97.3), Ilmibyeo (95.8), Anpyeong (90.8), Misojinpum (90.7), Dongjinbyeo (86.7), etc. |
|
13 |
Ilpumbyeo |
76.7 (65.2-95.4) |
Saeilpum (95.4), Odae1ho (89.6), Jinbubyeo (83.4), Odaebyeo (83.3), Koshihikari (82.9), etc. |
|
14 |
Dongjin |
75.5 (68.7-87.5) |
Ilmibyeo (87.5), Saeilmi (86.7), Gamtan (84.7), Donganbyeo (82.9), Misojinpum (82.4), etc. |
|
15 |
Ilmibyeo |
75.1 (67.6-95.8) |
Saeilmi (95.8), Gamtan (93.1), Dongjinbyeo (87.5), Misojinpum (87.5), Donganbyeo (87.1), etc. |
|
16 |
Odaebyeo |
75.0 (64.5-91.3) |
Geumobyeo (91.3), Koshihikari (87.2), Joil (86.2), Hitomebore (85.8), Jinbubyeo (84.3), etc. |
|
17 |
Saeodae |
72.4 (60.4-86.8) |
Saeodae1ho (86.8), Geumobyeo (82.8), Odaebyeo (81.4), Joil (78.5), Jopyeong (77.6), etc. |
|
All 96 varieties |
77.7 (59.7-99.9) |
- |
References
- 1. Cheon KS, Jeong YM, Lee YY, Oh J, Kang DY, Oh H, Kim SL, Kim N, Lee E, Baek J. 2019. Kompetitive allele-specific PCR marker development and quantitative trait locus mapping for bakanae disease resistance in Korean japonica rice varieties. Plant Breed Biotechnol 7: 208-219.
- 2. Cho YC, Baek MK, Park HS, Cho JH, Ahn EK, Suh JP, Jeung JU, Lee JH, Won YJ, Song YC. 2020. History and Results of Rice Breeding in Korea. Korean Society of Breeding Science 52: 58-72.
- 3. Duan Y, Gan P, Lin Q, Zhou Y, Lin Y, Xie Z, Wang X, Hu W. 2025. Genetic diversity analysis and core marker identification of shanlan upland rice landraces using highly informative InDel markers. Agriculture 16: 2
- 4. Guo Z, Wang H, Tao J, Ren Y, Xu C, Wu K, Zou C, Zhang J, Xu Y. 2019. Development of multiple SNP marker panels affordable to breeders through genotyping by target sequencing (GBTS) in maize. Mol Breed 39: 37
- 5. Hori K, Yamamoto T, Yano M. 2017. Genetic dissection of agronomically important traits in closely related temperate japonica rice cultivars. Breed Sci 67: 427-434.
- 6. Jones TB, Manseau M. 2022. Genetic networks in ecology: A guide to population, relatedness, and pedigree networks and their applications in conservation biology. Biol Conserv 267: 109466.
- 7. Kim MS, Lee HJ, Yu DA, Song JY, Nino M, Nogoy F, Kim J, So YS, Cho YG. 2016. Classification of Korean rice varieties based on agro-morphological traits. Korean Society of Breeding Science 48: 254-270.
- 8. Kim MS, Song JY, Kang KK, Cho YG. 2017. Discrimination of Korean rice varieties as revealed by DNA profiling and its relationship with genetic diversity. J Plant Biotechnol 44: 243-263.
- 9. Kim S, Shin J. 2023. A review on the improvement strategies for the plant variety protection system. Journal of Industrial Property 76: 359-393.
- 10. Kim WJ, Shin WC, Kim JJ, Park HS, Nam JK, Baek MK, Cho YC, Kim BK. 2019. 'Seongsan', an early maturing multi-resistant rice with good grain quality and high yield. Korean Society of Breeding Science 51: 462-474.
- 11. Kwon SJ, Ahn SN, Hong HC, Kim YK, Hwang HG, Choi HC, Moon HP. 1999. Genetic diversity of Korean japonica rice cultivars. Korean J Breed 31: 268-275.
- 12. Lee C, Cheon KS, Shin Y, Oh H, Jeong YM, Jang H, Park YC, Kim KY, Cho HC, Won YJ. 2022. Development and application of a target capture sequencing SNP-genotyping platform in rice. Genes 13: 794
- 13. Ma X, Wang H, Yan S, Zhou C, Zhou K, Zhang Q, Li M, Yang Y, Li D, Song P, Tang C, Geng L, Sun J, Ji Z, Sun X, Zhou Y, Zhou P, Cui D, Han B, Jing X, He Q, Fang W, Han L. 2025. Large-scale genomic and phenomic analyses of modern cultivars empower future rice breeding design. Molecular Plant 18: 651-668.
- 14. Mo Y, Jeong JM, Kim BK, Kwon SW, Jeung JU. 2020. Utilization of elite Korean japonica rice varieties for association mapping of heading time, culm length, and amylose and protein content. Korean J Crop Sci 65: 1-21.
- 15. Ni J, Colowit PM, Mackill DJ. 2002. Evaluation of genetic diversity in rice subspecies using microsatellite markers. Crop Science 42: 601-607.
- 16. Rombach P, Porter MA, Fowler JH, Mucha PJ. 2017. Core-periphery structure in networks (revisited). SIAM Review 59: 619-646.
- 17. Sun MM, Choi KJ, Kim HS, Song BH, Woo SH, Lee CW, Jong SK, Cho YG. 2009. Genetic diversity and discrimination of recently distributed Korean cultivars by SSR markers. Korean J Breed Sci 41: 115-125.
- 18. Sung M, Park H, Han H. 2009. Evaluation and strategies for protecting the plant variety. KREI (Korea Rural Economic Institute)..
- 19. Woo DU, Lee Y, Jeon HH, Park H, Park JH, Choi SH, Lee CM, Mo Y, Kang YJ. 2022. RicePedigree: Rice pedigree database for documentation and assistance in rice breeding. Agronomy 13: 69
- 20. Xiao L, Balkunde S, Yang P, Lee H-S, Ahn S-N. 2012. Diversity analysis of japonica rice using microsatellite markers. Korean J Agric Sci 39: 9-15.
- 21. Yi G. 2020. Analysis of chronological variation in pedigree and agronomic traits of 325 Korean rice varieties. Plant Breed Biotechnol 8: 426-433.
- 22. Yi GH, Park DS, Chung ES, Song SY, Jeon NS, Nam MH, Kim DH, Han CD, Eun MY, Ku YC. 2006. Pedigree analysis of 17 high quality Korean rice cultivars using web database systems. Korean J Crop Sci 51: 554-564.
- 23. Zhao K, Wright M, Kimball J, Eizenga G, McClung A, Kovach M, Tyagi W, Ali ML, Tung CW, Reynolds A. 2010. Genomic diversity and introgression in O. sativa reveal the impact of domestication and breeding on the rice genome. PLOS ONE 5: e10780.