

1 농촌진흥청 국립식량과학원
1 National Institute of Crop Science, RDA, Miryang 50424, Republic of Korea
2 팜한농㈜
2 Farm Hannong Inc., Seoul, 07320, Republic of Korea
3 농촌진흥청 국립농업과학원
3 National Academy of Agricultural Science, RDA, Wanju 55365, Republic of Korea
4 씨더스㈜
4 SEEDERS Inc., Daejeon, 34015, Republic of Korea
© Korean Society of Breeding Science. All rights reserved.
This is an Open-Access article distributed under the terms of the Creative Commons Attribution Non-Commercial License (http://creativecommons.org/licenses/by-nc/3.0) which permits unrestricted non-commercial use, distribution, and reproduction in any medium, provided the original work is properly cited.

| Trait | SL | NN | BN | FCN | FCL | FN | SW | RA | LU |
|---|---|---|---|---|---|---|---|---|---|
|
|
|||||||||
| NN | 0.505** | ||||||||
| BN | 0.622** | 0.622** | |||||||
| FCN | 0.432** | 0.343** | 0.57** | ||||||
| FCL | 0.3** | 0.014 | 0.119 | 0.304** | |||||
| FN | 0.323** | 0.114 | 0.224* | 0.428** | 0.747** | ||||
| SW | 0.298** | 0.076 | 0.293** | 0.558** | 0.204 | 0.135 | |||
| RA | -0.082 | -0.092 | -0.234* | -0.057 | 0.262* | 0.125 | 0.029 | ||
| LU | 0.066 | -0.022 | 0.070 | -0.071 | -0.257* | -0.311** | 0.107 | -0.084 | |
| AP | -0.087 | 0.026 | -0.024 | -0.243* | -0.27* | -0.35** | -0.025 | 0.052 | 0.762** |
*Correlation is significant at 0.05 and 0.01 probability levels, respectively.
**Correlation is significant at 0.05 and 0.01 probability levels, respectively.
zAbbreviations of traits are same with Table 1.
| Traitu | Chr. | Left Marker | Right Marker | Position (cM) | LODz | PVE(%)y | Addx | Domw | |d/a|v |
|---|---|---|---|---|---|---|---|---|---|
|
|
|||||||||
| LC | 3 | scaffold8_17030380 | scaffold8_16101189 | 95.8 | 14.3 | 50.4 | 0.66 | 0.15 | PD |
| PB | 2 | scaffold25_4598423 | scaffold25_3912693 | 57.9 | 10.0 | 25.4 | 0.54 | 0.06 | A |
| PB | 2 | scaffold25_1773512 | scaffold25_744098 | 76.2 | 7.8 | 19.1 | 0.05 | -0.64 | OD |
| PB | 5 | scaffold3_9875772 | scaffold3_11292324 | 38.0 | 5.4 | 12.2 | 0.39 | 0.12 | PD |
| PB | 5 | scaffold64_1191653 | scaffold22_5567527 | 100.4 | 3.3 | 7.1 | -0.28 | -0.03 | A |
| SL | 9 | scaffold35_5711921 | scaffold134_133385 | 13.9 | 3.8 | 20.1 | 9.79 | -14.67 | OD |
| FCN | 3 | scaffold31_6872402 | scaffold31_6250465 | 40.9 | 3.8 | 19.0 | -54.43 | -3.61 | A |
| FCL | 1 | scaffold32_5830494 | scaffold29_6732047 | 13.0 | 3.2 | 15.2 | -1.64 | 1.04 | PD |
| FCL | 3 | scaffold49_35668 | scaffold6_4743200 | 63.4 | 4.0 | 17.8 | -1.92 | 0.21 | A |
| FN | 3 | scaffold6_9130731 | scaffold21_10557309 | 58.2 | 5.1 | 23.8 | -5.00 | 2.14 | PD |
| SW | 10 | scaffold28_5887083 | scaffold28_6525916 | 24.2 | 3.7 | 19.6 | 3.13 | -1.60 | PD |
| RA | 1 | scaffold16_7569624 | scaffold16_7019064 | 150.9 | 4.2 | 8.3 | -115.90 | 0.47 | A |
| RA | 5 | scaffold10_10061999 | scaffold10_9181391 | 4.0 | 7.1 | 14.8 | 171.59 | 47.89 | PD |
| RA | 6 | scaffold43_1927956 | scaffold43_2688122 | 34.6 | 3.7 | 7.2 | 103.81 | 27.49 | PD |
| RA | 7 | scaffold59_753444 | scaffold59_2135864 | 83.7 | 4.0 | 7.8 | -27.91 | -134.19 | OD |
| RA | 7 | scaffold34_6133629 | scaffold34_6235270 | 156.9 | 3.4 | 6.3 | 108.83 | -31.67 | PD |
| RA | 10 | scaffold12_7503648 | scaffold12_9560702 | 2.1 | 12.8 | 32.1 | -229.27 | 11.30 | A |
| LU | 1 | scaffold46_600664 | scaffold46_534033 | 191.8 | 5.2 | 22.4 | 59.15 | -10.69 | A |
| LU | 10 | scaffold32_1386668 | scaffold32_1454570 | 21.8 | 3.3 | 13.6 | 44.55 | -6.67 | A |
| AP | 1 | scaffold2_12959065 | scaffold2_13146855 | 89.8 | 3.8 | 12.6 | 46.97 | 26.22 | PD |
| AP | 4 | scaffold24_857542 | scaffold24_1017077 | 77.3 | 5.8 | 21.0 | -6.65 | 90.29 | OD |
zLOD score for the detected QTLs (LOD threshold=3.0).
yproportion of variance explained by a QTL at the test site under H0:H3.
xAdditive effect under H1.
wDominant effect under H2.
vestimation of gene action, A (additive effect) 0-0.20, PD (partial dominance) 0.21-0.80, D (dominance) 0.81-1.20, OD (over dominance)>1.20.
uAbbreviations ; LC (Leaf Color), PB (Pubescence), others are same with Table 1.
| Transcript No. | Speciesz | Sequence Identity | TAIRy | TAIR description |
|---|---|---|---|---|
|
|
||||
| 1SL023156t001 | Mimulus guttatus v1.1 | 72.25 | AT1G72210.1 | basic helix-loop-helix (bHLH) DNA-binding superfamily protein |
| 1SL003771t001 | Vitis vinifera | 73.06 | AT5G16600.1 | myb domain protein 43 |
| 1SL006007t004 | Mimulus guttatus v2.0 | 93.39 | AT5G66240.2 | Transducin/WD40 repeat-like superfamily protein |
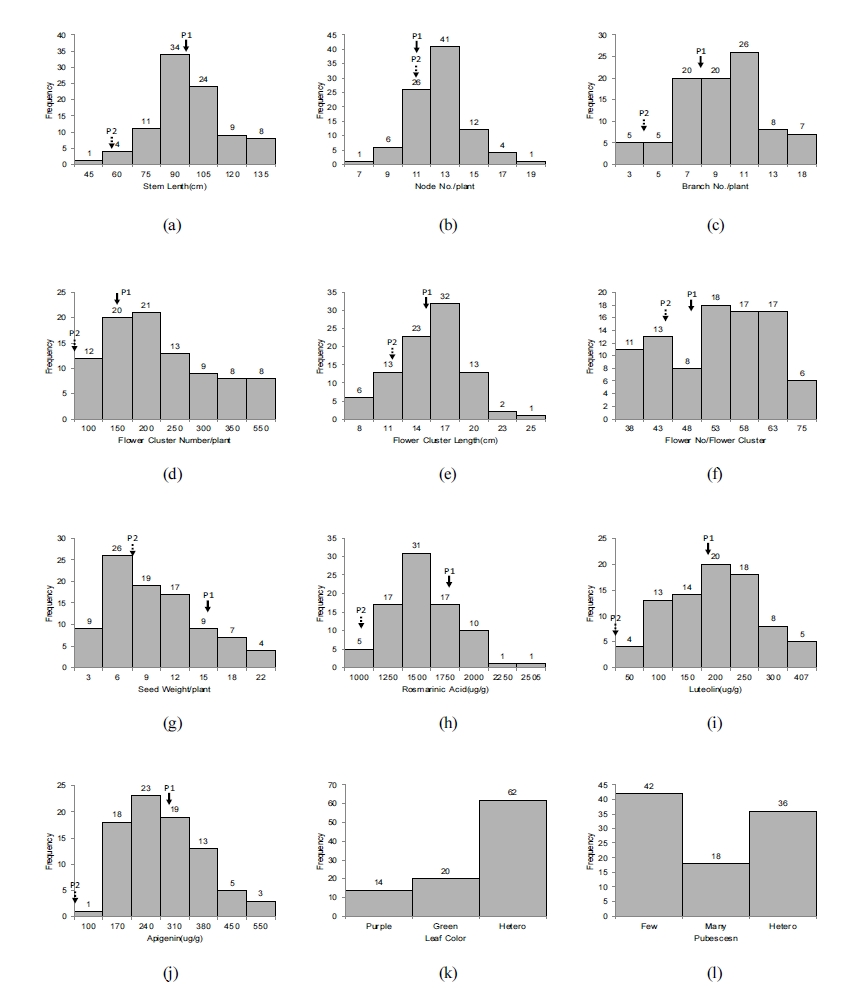
Phenotypic variation in F2 population of a cross P. citriodora × P. hirtella.
| Trait | Mean | SE | Min | Max | Skewness | Kurtosis |
|---|---|---|---|---|---|---|
|
|
||||||
| SL(Stem Length, cm) | 91 | 19.3 | 35 | 135 | 0.09 | 0.09 |
| NN(Node Number) | 12.1 | 1.9 | 7 | 18 | 0.31 | 1.03 |
| BN(Branch Number) | 8.5 | 3.3 | 1 | 18 | 0.41 | 0.64 |
| FCN(Flower Cluster Number) | 234 | 225.7 | 33 | 512 | 4.81 | 26.88 |
| FCL(Flower Cluster Length, cm) | 13.95 | 3.47 | 5.6 | 24.1 | -0.01 | 0.15 |
| FN(Flower No./Flower Cluster) | 51 | 9.8 | 28 | 73 | -0.32 | -0.58 |
| SW(Seed Weight) | 8.3 | 5.02 | 0.1 | 22.0 | 0.52 | -0.41 |
| RA(Rosemarinic Acid, ug/g) | 1431 | 294 | 886 | 2503 | 0.70 | 0.94 |
| LU(Luteolin, ug/g) | 176 | 81 | 13 | 406 | 0.43 | -0.18 |
| AP(Apigenin, ug/g) | 250 | 96 | 61 | 534 | 0.55 | -0.05 |
Phenotypic Pearson correlations among traits in F2 population
| Trait | SL | NN | BN | FCN | FCL | FN | SW | RA | LU |
|---|---|---|---|---|---|---|---|---|---|
|
|
|||||||||
| NN | 0.505 |
||||||||
| BN | 0.622 |
0.622 |
|||||||
| FCN | 0.432 |
0.343 |
0.57 |
||||||
| FCL | 0.3 |
0.014 | 0.119 | 0.304 |
|||||
| FN | 0.323 |
0.114 | 0.224 |
0.428 |
0.747 |
||||
| SW | 0.298 |
0.076 | 0.293 |
0.558 |
0.204 | 0.135 | |||
| RA | -0.082 | -0.092 | -0.234 |
-0.057 | 0.262 |
0.125 | 0.029 | ||
| LU | 0.066 | -0.022 | 0.070 | -0.071 | -0.257 |
-0.311 |
0.107 | -0.084 | |
| AP | -0.087 | 0.026 | -0.024 | -0.243 |
-0.27 |
-0.35 |
-0.025 | 0.052 | 0.762 |
*Correlation is significant at 0.05 and 0.01 probability levels, respectively.
**Correlation is significant at 0.05 and 0.01 probability levels, respectively.
zAbbreviations of traits are same with Table
Results of composite interval mapping for agronomic traits in F2.
| Trait |
Chr. | Left Marker | Right Marker | Position (cM) | LOD |
PVE(%) |
Add |
Dom |
|d/a| |
|---|---|---|---|---|---|---|---|---|---|
|
|
|||||||||
| LC | 3 | scaffold8_17030380 | scaffold8_16101189 | 95.8 | 14.3 | 50.4 | 0.66 | 0.15 | PD |
| PB | 2 | scaffold25_4598423 | scaffold25_3912693 | 57.9 | 10.0 | 25.4 | 0.54 | 0.06 | A |
| PB | 2 | scaffold25_1773512 | scaffold25_744098 | 76.2 | 7.8 | 19.1 | 0.05 | -0.64 | OD |
| PB | 5 | scaffold3_9875772 | scaffold3_11292324 | 38.0 | 5.4 | 12.2 | 0.39 | 0.12 | PD |
| PB | 5 | scaffold64_1191653 | scaffold22_5567527 | 100.4 | 3.3 | 7.1 | -0.28 | -0.03 | A |
| SL | 9 | scaffold35_5711921 | scaffold134_133385 | 13.9 | 3.8 | 20.1 | 9.79 | -14.67 | OD |
| FCN | 3 | scaffold31_6872402 | scaffold31_6250465 | 40.9 | 3.8 | 19.0 | -54.43 | -3.61 | A |
| FCL | 1 | scaffold32_5830494 | scaffold29_6732047 | 13.0 | 3.2 | 15.2 | -1.64 | 1.04 | PD |
| FCL | 3 | scaffold49_35668 | scaffold6_4743200 | 63.4 | 4.0 | 17.8 | -1.92 | 0.21 | A |
| FN | 3 | scaffold6_9130731 | scaffold21_10557309 | 58.2 | 5.1 | 23.8 | -5.00 | 2.14 | PD |
| SW | 10 | scaffold28_5887083 | scaffold28_6525916 | 24.2 | 3.7 | 19.6 | 3.13 | -1.60 | PD |
| RA | 1 | scaffold16_7569624 | scaffold16_7019064 | 150.9 | 4.2 | 8.3 | -115.90 | 0.47 | A |
| RA | 5 | scaffold10_10061999 | scaffold10_9181391 | 4.0 | 7.1 | 14.8 | 171.59 | 47.89 | PD |
| RA | 6 | scaffold43_1927956 | scaffold43_2688122 | 34.6 | 3.7 | 7.2 | 103.81 | 27.49 | PD |
| RA | 7 | scaffold59_753444 | scaffold59_2135864 | 83.7 | 4.0 | 7.8 | -27.91 | -134.19 | OD |
| RA | 7 | scaffold34_6133629 | scaffold34_6235270 | 156.9 | 3.4 | 6.3 | 108.83 | -31.67 | PD |
| RA | 10 | scaffold12_7503648 | scaffold12_9560702 | 2.1 | 12.8 | 32.1 | -229.27 | 11.30 | A |
| LU | 1 | scaffold46_600664 | scaffold46_534033 | 191.8 | 5.2 | 22.4 | 59.15 | -10.69 | A |
| LU | 10 | scaffold32_1386668 | scaffold32_1454570 | 21.8 | 3.3 | 13.6 | 44.55 | -6.67 | A |
| AP | 1 | scaffold2_12959065 | scaffold2_13146855 | 89.8 | 3.8 | 12.6 | 46.97 | 26.22 | PD |
| AP | 4 | scaffold24_857542 | scaffold24_1017077 | 77.3 | 5.8 | 21.0 | -6.65 | 90.29 | OD |
zLOD score for the detected QTLs (LOD threshold=3.0).
yproportion of variance explained by a QTL at the test site under H0:H3.
xAdditive effect under H1.
wDominant effect under H2.
vestimation of gene action, A (additive effect) 0-0.20, PD (partial dominance) 0.21-0.80, D (dominance) 0.81-1.20, OD (over dominance)>1.20.
uAbbreviations ; LC (Leaf Color), PB (Pubescence), others are same with Table
Anthocyanin biosynthesis transcription factor like sequences located near from Leaf Color (LC) QTL of Chromosome 3.
| Transcript No. | Species |
Sequence Identity | TAIR |
TAIR description |
|---|---|---|---|---|
|
|
||||
| 1SL023156t001 | Mimulus guttatus v1.1 | 72.25 | AT1G72210.1 | basic helix-loop-helix (bHLH) DNA-binding superfamily protein |
| 1SL003771t001 | Vitis vinifera | 73.06 | AT5G16600.1 | myb domain protein 43 |
| 1SL006007t004 | Mimulus guttatus v2.0 | 93.39 | AT5G66240.2 | Transducin/WD40 repeat-like superfamily protein |
zMost similar sequence DB with P. citriodora transcript sequence.
yLocus number in TAIR(The Arabidopsis Information Resource, http://www.arabidopsis.org).
Correlation is significant at 0.05 and 0.01 probability levels, respectively.
Correlation is significant at 0.05 and 0.01 probability levels, respectively.
Abbreviations of traits are same with Table
LOD score for the detected QTLs (LOD threshold=3.0).
proportion of variance explained by a QTL at the test site under H0:H3.
Additive effect under H1.
Dominant effect under H2.
estimation of gene action, A (additive effect) 0-0.20, PD (partial dominance) 0.21-0.80, D (dominance) 0.81-1.20, OD (over dominance)>1.20.
Abbreviations ; LC (Leaf Color), PB (Pubescence), others are same with Table
Most similar sequence DB with P. citriodora transcript sequence.
Locus number in TAIR(The Arabidopsis Information Resource, http://www.arabidopsis.org).
