적요
Barley (Hordeum vulgare L.) is an important cereal crop valued for its nutritional benefits and adaptability to diverse climates. β-glucan, a soluble dietary fiber found in barley, is recognized for its health benefits, including lowering cholesterol, managing postprandial blood glucose levels, and providing antioxidative properties. However, high β-glucan content can complicate food processing due to increased viscosity and water absorption rates. This study used genotyping-by-sequencing (GBS) to examine genetic variation within barley populations and to identify genetic markers associated with β-glucan content. A Genome-Wide Association Study (GWAS) was conducted to identify candidate genes linked to β-glucan levels. Functional annotation revealed several genes potentially involved in cellulose synthase activity and cell wall biosynthesis, including the MYB-related protein Zm38, C2 domain-containing protein, ATP synthase subunit beta (chloroplastic), ATP-dependent Clp protease proteolytic subunit, soluble inorganic pyrophosphatase, and glyceraldehyde-3-phosphate dehydrogenase 1 (cytosolic). These findings provide insights into the genetic architecture of β-glucan content in barley. By leveraging GBS and GWAS, breeders can identify and select genetic markers associated with high β-glucan content, thereby facilitating the development of superior barley varieties with enhanced nutritional and processing qualities.
Introduction
Barley (
Hordeum vulgare L.) is a widely cultivated cereal crop valued for its nutritional benefits and versatility (
Newton et al. 2011). Its ability to adapt to various climates allows it to thrive as a staple crop in many regions, making it an essential component of agriculture worldwide (
Dawson et al. 2015). One of the key nutritional components of barley is β-glucan, a soluble dietary fiber renowned for its health benefits (
Tosh & Bordenave 2020). Barley contains significantly higher β-glucan levels compared to maize, rice, and wheat, exceeding these grains by more than tenfold (
Havrlentová & Kraic 2006). This high β-glucan content is associated with numerous health benefits, including lowering cholesterol, managing postprandial blood glucose levels, and exhibiting antioxidative properties that enhance the immune system (
Behall et al. 2005,
Othman et al. 2011,
Soong et al. 2015). These benefits drive the breeding efforts focused on developing barley varieties with even higher β-glucan content, making it an increasingly important crop for health-conscious consumers.
Despite the health benefits of high β-glucan content in barley, it can create difficulties in food processing. The increased viscosity associated with high β-glucan levels can lead to difficulties in processing, as it increases water absorption rates (
Xu et al. 2016). This makes the selection of barley varieties that balance β-glucan content with manageable processing characteristics a crucial aspect of breeding programs. Therefore, understanding the genetic factors that influence β-glucan content in barley is essential for developing varieties that meet both nutritional and practical requirements.
Addressing these issues involves considering the role of cellulose synthase in cell wall biosynthesis and structure (
Pear et al. 1996). The interaction between β-glucan and cellulose in the cell wall can influence the overall properties of barley, including its processing characteristics (
Hematian Sourki & Hesarinejad 2023). By understanding the genes involved in cellulose synthase activity, insights can be gained into how to balance β-glucan content and cell wall composition, thereby improving both the nutritional value and the practical usability of barley.
To achieve this understanding, we utilized Genotyping-by-Sequencing (GBS) to study genetic variation within barley populations. GBS provides high-resolution data on genetic markers, facilitating the identification of genetic differences that correlate with specific traits such as β-glucan content (
Geng et al. 2021). This method's efficiency and cost- effectiveness make it a preferred choice for large-scale genetic studies (
Ban & Choi 2018,
Jadamba et al. 2024).
Functional annotation of the candidate genes identified through GWAS revealed several genes potentially involved in cellulose synthase activity and cell wall biosynthesis. Based on previous research, these candidate genes were found to be in proximity to cellulose synthase-like (Csl) F genes (
Lex et al. 2014,
Stracke et al. 2007). Subsequent blastx analysis confirmed that the SNPs identified through GWAS are related to genes influencing cellulose synthase activity. Notably, these genes include MYB-related protein Zm38 (
Ambawat et al. 2013,
Yanhui et al. 2006), C2 domain-containing protein (
Rizo & Sudhof 1998), ATP synthase subunit beta (chloroplastic) (
Hahn et al. 2018,
Zancani et al. 2020), ATP-dependent Clp protease proteolytic subunit (
Clarke 2012), soluble inorganic pyrophosphatase (
Sonnewald 1992), and glyceraldehyde-3-phosphate dehydrogenase 1 (cytosolic) (
Rius et al. 2008) were found to be related to cellulose synthase. These genes play various roles, from transcriptional regulation and energy production to protein quality control, all contributing to cell wall synthesis and structure.
In conclusion, utilizing GBS and GWAS to investigate the genetic basis of β-glucan content in barley provides valuable insights that can enhance cereal crop research. By applying these technologies, breeders can identify and select genetic markers associated with high β-glucan content, ultimately facilitating the development of superior barley varieties.
Material and Method
Plant materials
For this study, we utilized a collection of 96 barley genetic resources from a breeding population developed for β-glucan content. These resources were obtained from the Crop Breeding Division of the Rural Development Administration (RDA) in Korea.
Once the plants reached the appropriate growth stage, leaf samples were collected for DNA extraction. Genomic DNA was extracted using a commercial DNA extraction kit following the manufacturer's protocols. The quality and quantity of the extracted DNA were assessed using spectrophotometric measurements and gel electrophoresis to confirm they were adequate for downstream genotyping and sequencing processes.
Measurement of β-glucan content
The total β-glucan content in barley samples was quantified following the method outlined by McCleary (
McCleary & Glennie-Holmes 1985), using a commercial kit from Megazyme Ltd. (Bray, Ireland). The barley samples were milled using a cyclone mill (ZM-300, Retch, Germany) equipped with a 0.5 mm screen.
For the GBS library preparation (
Kim et al. 2016), we utilized the 96 barley genetic resources from a breeding population developed for β-glucan content. Each sample underwent double digestion with the restriction enzymes NsiI and MseI. Following digestion, barcoded adapters were ligated to the DNA fragments to facilitate sample identification during sequencing. The DNA fragments were then size-selected to isolate those between 300 and 500 bp, which were used to construct the GBS libraries.
Library quality control was performed using LightCycle qPCR and TapeStation HS D5000 Screen Tape to ensure the integrity and size distribution of the PCR-enriched fragments. The library size was verified by running on an Agilent Technologies 2100 Bioanalyzer using a DNA 1000 chip. Prepared libraries were quantified using qPCR according to the Illumina qPCR Quantification Protocol Guide.
The sequencing was carried out on the HiSeq×Ten platform, using 150 bp paired-end reads. Post-sequencing, inline barcode sorting was performed to demultiplex the reads based on their barcoded adapters.
Sequence data analysis and SNP identification
The GBS raw data generated from the sequencing was initially processed using the GBS_SNP_CROP v4.1 software (
Melo et al. 2016). The raw sequences were then trimmed using Trimmomatic version 0.39 (
Bolger et al. 2014), with the following parameters. A reference genome was assembled from the GBS data using the same software, and the trimmed sequences were aligned to this reference using BWA-mem (
Li 2013).
Subsequent variant calling was conducted with GATK version 4.3.0.0 (
McKenna et al. 2010). For each sample, variants were called using the HaplotypeCaller (
Van der Auwera et al. 2013) in GVCF mode. The final VCF file was filtered to exclude variants with more than 10% missing data and a minor allele frequency (MAF) below 0.5, using bcftools (
Danecek et al. 2021). Sequencing of the GBS library for the 96 barley genotypes generated a total of approximately 771.9 million reads, yielding 116.56 Gb of data. From these reads, 204,490 SNPs were initially identified using GBS-SNP-CROP and GATK pipelines. After applying stringent filtering criteria, a total of 55,248 high-quality SNPs were retained for further analysis.
Determining the population structure of our barley samples involved data analysis for each K value ranging from 2 to 9 using STRUCTURE v.2.3.4 (
Pritchard et al. 2000). STRUCTURE software was used to assign individuals to clusters based on their genotypes, utilizing genotype codes as input data to estimate the probability of each cluster.
Subsequently, the output files from STRUCTURE were processed using Structureselector (
Li & Liu 2018), a tool designed to collate results and provide graphical representations. Structureselector facilitated the calculation of ΔK values using the method described by Evanno (
Evanno et al. 2005). This method evaluates the rate of change in the log probability of data between successive K values to identify the optimal number of clusters. The highest ΔK value was identified at K=4, which was determined to be the optimal number of genetic clusters within the barley population.
The Genome-Wide Association Study (GWAS) (
Bush & Moore 2012) was conducted by combining the phenotypic data for β-glucan content with the genotypic data from 96 barley samples. Single nucleotide polymorphism (SNP) markers with a minor allele frequency (MAF) of less than 5% and those missing in more than 10% of the barley genotypes were excluded from the analysis to ensure data quality.
We employed multiple models within the GAPIT3 (
Wang & Zhang 2021) software to validate significant SNP markers and loci. The GWAS in GAPIT3 was performed using several models, including the General Linear Model (GLM), the Mixed Linear Model (MLM), the Multiple Locus Mixed Model (MLMM), the Fixed and Random Model Circulating Probability Unification (FarmCPU), and the Bayesian Information and Linkage Disequilibrium Iteratively Nested Keyway (BLINK). After evaluating the results, the FarmCPU model was chosen as the final model for its superior ability to control for population structure and relatedness, providing a robust identification of significant genetic associations with β-glucan content.
The final 48 SNP positions identified through GWAS were each surrounded by a 2 Mb window (1 Mb upstream and downstream). These genomic regions were used to search for barley proteins in the UniProt database (
Consortium 2019). Barley is a predominantly self-pollinating species with high linkage disequilibrium (LD). Previous studies have reported LD decay distances ranging from 1.6 to 3.5 Mb in similar barley populations (
Farooqi et al. 2023,
Skovbjerg et al. 2025), supporting the use of a 2 Mb window to capture linked candidate genes.
Functional annotation of the extracted sequences was conducted using DIAMOND (
Buchfink et al. 2015) against the barley protein dataset from UniProt, with an E-value threshold of 1×10⁻⁵ and the number of target sequences limited to one per query. This high-speed blastx tool enabled efficient alignment of the candidate regions to known barley proteins and provided functional insights. As a result, candidate genes potentially involved in the regulation of β-glucan content were identified and annotated, with particular attention given to genes associated with cellulose synthase activity and cell wall biosynthesis. Among the 48 significant SNPs, 10 were successfully annotated with functional information, highlighting their potential roles in biological processes related to β-glucan accumulation.
Result
The β-glucan content of the breeding population
We utilized a collection of 96 barley genetic resources from a breeding population that includes those with enhanced β-glucan content. The β-glucan content in the barley samples ranged from 3.6% to 12.0%, with an average content of 5.1%.
The distribution of β-glucan content among the breeding population is illustrated in the histogram (
Fig. 1). The majority of the barley samples exhibited β-glucan content between 4% and 6%, with a notable peak around 5%. A smaller subset of samples displayed significantly higher β-glucan content, indicating a potential for selective breeding to enhance this trait. These findings demonstrate the genetic diversity within the breeding population and suggest opportunities for targeted breeding strategies to further improve β-glucan content in barley.
Determining the optimal number of genetic clusters in our barley population involved conducting a STRUCTURE analysis using genotype codes as input data. The resulting output files were processed with StructureSelector to calculate ΔK values based on the method by Evanno. The ΔK plot revealed a distinct peak at K=4, indicating four major genetic clusters within the population (
Fig. 2a).
A bar plot, generated through STRUCTURE software, depicts the genetic assignment of individuals into these four clusters (
Fig. 2b). Each color in the plot represents a different genetic cluster, and the proportion of each color in an individual bar reflects the individual's genetic composition across the clusters. The clear separation among the clusters confirm the presence of distinct genetic groups within the barley population.
Before performing the final genome-wide association study (GWAS) analysis, a comparison of five GWAS models was conducted using the GAPIT package. These included GLM, MLM, MLMM, FarmCPU, and BLINK, and the goal was to identify the most suitable model for detecting associations with β-glucan content.
Quantile-quantile (QQ) plots were generated to assess the agreement between expected and observed –log₁₀ (p) values, and the number of significant SNPs with
p-values less than 1×10⁻⁵ was recorded (
Fig. 3,
Table 1). The QQ plot for the GLM model (
Fig. 3a) showed a strong upward deviation from the expected line, suggesting substantial genomic inflation and a high rate of potentially false-positive signals, as evidenced by the detection of 427 significant SNPs. The MLM (
Fig. 3b) and MLMM (
Fig. 3c) models showed moderate inflation and detected 10 and 3 significant SNPs respectively, indicating that some population structure was corrected but not fully controlled.
The QQ plot from the FarmCPU model (
Fig. 3d) closely followed the expected diagonal, except for a few points at the upper tail that deviated strongly, representing true associations. This model identified 8 significant SNPs and maintained a good balance between statistical power and control of false positives. In contrast, the QQ plot for the BLINK model (
Fig. 3e) showed nearly perfect alignment with the expected distribution across the entire range, but no significant SNPs were detected, suggesting that the model may have been overly conservative and failed to capture true signals.
Considering both the distribution of p-values and the number of significant SNPs, FarmCPU was selected as the optimal model for downstream analysis of β-glucan content.
GWAS of β-glucan content
The GWAS analysis was performed using the GAPIT tool with the FarmCPU model to identify significant associations between SNPs and β-glucan content in the barley genotypes. Sequencing of the GBS library for the 96 barley genotypes generated a total of approximately 771.9 million reads, yielding 116.56 Gb of data. From these reads, 204,490 SNPs were initially identified using GBS-SNP-CROP and GATK pipelines. After applying stringent filtering criteria, a total of 55,248 high-quality SNPs were retained for further analysis.
From the GWAS results, 53,817 SNPs were analyzed, and SNPs with a –log10 (P)>3 were considered significant (
Fig. 4a). The QQ plot (
Fig. 4b) shows the observed versus expected –log10 (P) values for all SNPs. The observed values deviate from the expected values at the higher end, supporting significant associations between certain SNPs and β-glucan content.
A total of 48 SNPs surpassed this threshold, indicating an association with β-glucan content. These SNPs are characterized by their specific chromosome locations, the –log10 (P) values indicating their significance, the types of SNP variations observed, and the minor allele frequencies (MAF) which provide insights into their distribution within the barley population (
Table 2). 20 of these significant SNPs were located on chromosome 7, suggesting that this region may play a crucial role in determining β-glucan content in barley. Due to barley's self-pollinating nature, it is expected to have high LD values. Based on this, we identified SNPs at positions 148,498,886 bp, 327,625,675 bp, and 140,085,458 bp on chromosome 7. These SNPs are located near the previously identified positions of the cellulose synthase-like (Csl) F gene family.
A genome-wide association study (GWAS) was conducted to identify single nucleotide polymorphisms (SNPs) associated with β-glucan content in plants. UniProt was used to search for barley protein genes, and the identified genes were functionally annotated using DIAMOND blastx, with an E-value threshold of 1×10⁻⁵ and max-target-seqs set to 1. Given the importance of cellulose synthase in cell wall biosynthesis, the focus was on genes linked to this enzyme. Several significant associations were revealed, and the corresponding genes were annotated for their functional roles.
Out of the 48 SNPs analyzed, 10 were functionally annotated (
Table 3). Among these, MYB-related protein Zm38, C2 domain-containing protein, ATP synthase subunit beta, chloroplastic, ATP-dependent Clp protease proteolytic subunit, Soluble inorganic pyrophosphatase, and Glyceraldehyde-3-phosphate dehydrogenase 1, cytosolic were considered to be related to cellulose synthase and were further investigated for their roles in cell wall biosynthesis. Understanding these genes provides insights into how to balance β-glucan content and cell wall composition, ultimately aiding in the development of barley varieties that meet both nutritional and practical requirements.
Result
Despite the health benefits of high β-glucan content in barley, it can create difficulties in food processing. The increased viscosity associated with high β-glucan levels can lead to difficulties in processing, as it increases water absorption rates. This makes the selection of barley varieties that balance β-glucan content with manageable processing characteristics a crucial aspect of breeding programs. Therefore, understanding the genetic factors that influence β-glucan content in barley is essential for developing varieties that meet both nutritional and practical requirements. Addressing these issues involves considering the role of cellulose synthase in cell wall biosynthesis and structure. The interaction between β-glucan and cellulose in the cell wall can influence the overall properties of barley, including its processing characteristics. By understanding the genes involved in cellulose synthase activity, insights can be gained into how to balance β-glucan content and cell wall composition, thereby improving both the nutritional value and the practical usability of barley.
This necessity for balance is underscored by the significant variation in β-glucan content observed within the breeding population, highlighting the genetic diversity present. This diversity provides a foundation for selective breeding to enhance this trait. The wide range of β-glucan content, from 3.6% to 12.0%, reflects substantial genetic variation that can be leveraged to create barley cultivars with increased β-glucan content.
The STRUCTURE analysis revealed four major genetic clusters within the barley population, indicating the presence of distinct genetic groups. These clusters provide insight into the genetic architecture of the population and suggest specific groups that could be targeted in breeding strategies. Understanding these genetic clusters is crucial for designing effective breeding programs that can capitalize on the genetic diversity to improve β-glucan content in barley.
Given that barley is a self-pollinating plant, it is expected to have high LD values (
Lex et al. 2014,
Stracke et al. 2007). This assumption is supported by previous research which identified the locations of cellulose synthase-like (Csl) F genes (
Burton et al. 2006,
Schreiber et al. 2014). GWAS analysis identified several significant SNPs related to cellulose synthase that may influence β-glucan content, with a substantial number located on chromosome 7. Among these significant SNPs on chromosome 7, the SNPs at positions 148,498,886 bp, 327,625,675 bp, and 140,085,458 bp are particularly noteworthy. These SNPs are situated near members of the cellulose synthase-like (Csl) F gene family, suggesting a close relationship with β-glucan synthesis in barley. This proximity indicates that these genomic regions may contain key regulatory elements or genes directly involved in the biosynthesis of β-glucan.
Furthermore, the functional annotation of the identified genes using DIAMOND BLASTX provided further insights into their potential roles in cellulose synthase activity and cell wall biosynthesis. Among the 48 significant SNPs identified, functional annotation revealed that 10 SNPs were associated with genes potentially involved in cellulose synthase activity. This analysis aimed to explore SNPs that, while not directly related to cellulose synthase, could still influence β-glucan synthesis and cell wall biosynthesis processes.
MYB-related protein Zm38 is a transcription factor that regulates the expression of various genes involved in plant development and stress responses (
Cao et al. 2020,
Wang et al. 2021). This protein can regulate the expression of cellulose synthase genes by controlling the transcription of genes encoding cellulose synthase components. Consequently, MYB-related protein Zm38 plays a crucial role in modulating the synthesis of cellulose, thus impacting cell wall structure and function (
Cominelli et al. 2008).
C2 domain-containing proteins are involved in calcium-dependent membrane binding and signaling processes, as well as protein-protein interactions (
de Silva et al. 2011,
Maguire et al. 2024). These proteins can influence cellulose synthase activity through their roles in membrane dynamics and signaling pathways. The localization and activity of cellulose synthase complexes can be regulated by calcium signaling and membrane interactions, processes in which C2 domain-containing proteins play a critical role (
Cui et al. 2023). Therefore, these proteins may indirectly affect the synthesis and organization of cellulose in the cell wall.
ATP synthase subunit beta, chloroplastic, is a part of the ATP synthase complex in chloroplasts, crucial for ATP production through photophosphorylation (
Farias & Giorello 2020). The ATP produced by the ATP synthase complex is essential for the energy-intensive process of cellulose biosynthesis. ATP is utilized by cellulose synthase complexes (CSCs) to synthesize cellulose, a key component of the plant cell wall (
Carpita 2011,
Speicher et al. 2018). Thus, ATP synthase indirectly supports cellulose synthase activity by ensuring a sufficient supply of ATP.
ATP-dependent Clp protease proteolytic subunit is involved in protein degradation and quality control, removing damaged or misfolded proteins to maintain cellular homeostasis (
Sjögren & Clarke 2011,
Sjogren et al. 2006). Clp proteases help maintain the quality and functionality of cellulose synthase enzymes. Clp proteases help ensure that cellulose synthesis runs smoothly by breaking down defective cellulose synthase proteins. This process removes faulty enzymes, allowing only the properly functioning ones to participate in building the plant cell wall.
Soluble inorganic pyrophosphatase hydrolyzes inorganic pyrophosphate (PPi) to release two molecules of orthophosphate (Pi), thus maintaining energy balance within the cell (
Cooperman et al. 1992,
Sivula et al. 1999). By hydrolyzing PPi, soluble inorganic pyrophosphatase prevents the accumulation of PPi, which can inhibit biosynthetic reactions including cellulose synthesis. The hydrolysis of PPi helps drive the reaction forward, promoting efficient cellulose production and supporting cell wall biosynthesis (
Segami et al. 2018).
Glyceraldehyde-3-phosphate dehydrogenase 1 (GAPDH1) is an important enzyme in the glycolytic pathway. It converts glyceraldehyde-3-phosphate (G3P) into 1,3-bisphosphoglycerate in the presence of NAD+ and inorganic phosphate, producing ATP and NADH in the process (
Sirover 2011). The ATP produced by GAPDH1 is essential for the energy-intensive process of making cellulose. Cellulose synthase complexes (CSCs) use this ATP to create cellulose, which is a key part of the plant cell wall (
Carpita 2011). Therefore, GAPDH1 indirectly helps cellulose synthase activity by ensuring there is enough ATP available.
Discussion
These findings provide valuable insights into the genetic architecture of β-glucan content in barley and identify candidate genes for further research. By understanding their roles in cellulose synthase activity and cell wall biosynthesis, we can develop strategies to improve the nutritional quality of barley. Additionally, the identified genetic clusters and significant SNPs offer practical targets for marker-assisted selection, enabling more efficient breeding programs aimed at enhancing β-glucan content.
Notably, significant SNPs located near the cellulose synthase-like (Csl) F gene family on chromosome 7 highlight key regions for genetic improvement. Furthermore, the functional annotation of identified genes revealed several SNPs associated with genes potentially involved in cellulose synthase activity. This suggests that these genomic regions may play a crucial role in modulating β-glucan levels and cell wall composition. By leveraging this genetic diversity, we can develop barley cultivars that meet both nutritional and processing requirements, supporting the advancement of barley breeding programs.
Acknowledgments
This research was supported by the “Project No.: PJ01500406” RDA, Republic of Korea.
Fig. 1Distribution of β-glucan content in the barley breeding population. The histogram represents the frequency of barley samples within specific β-glucan content ranges.
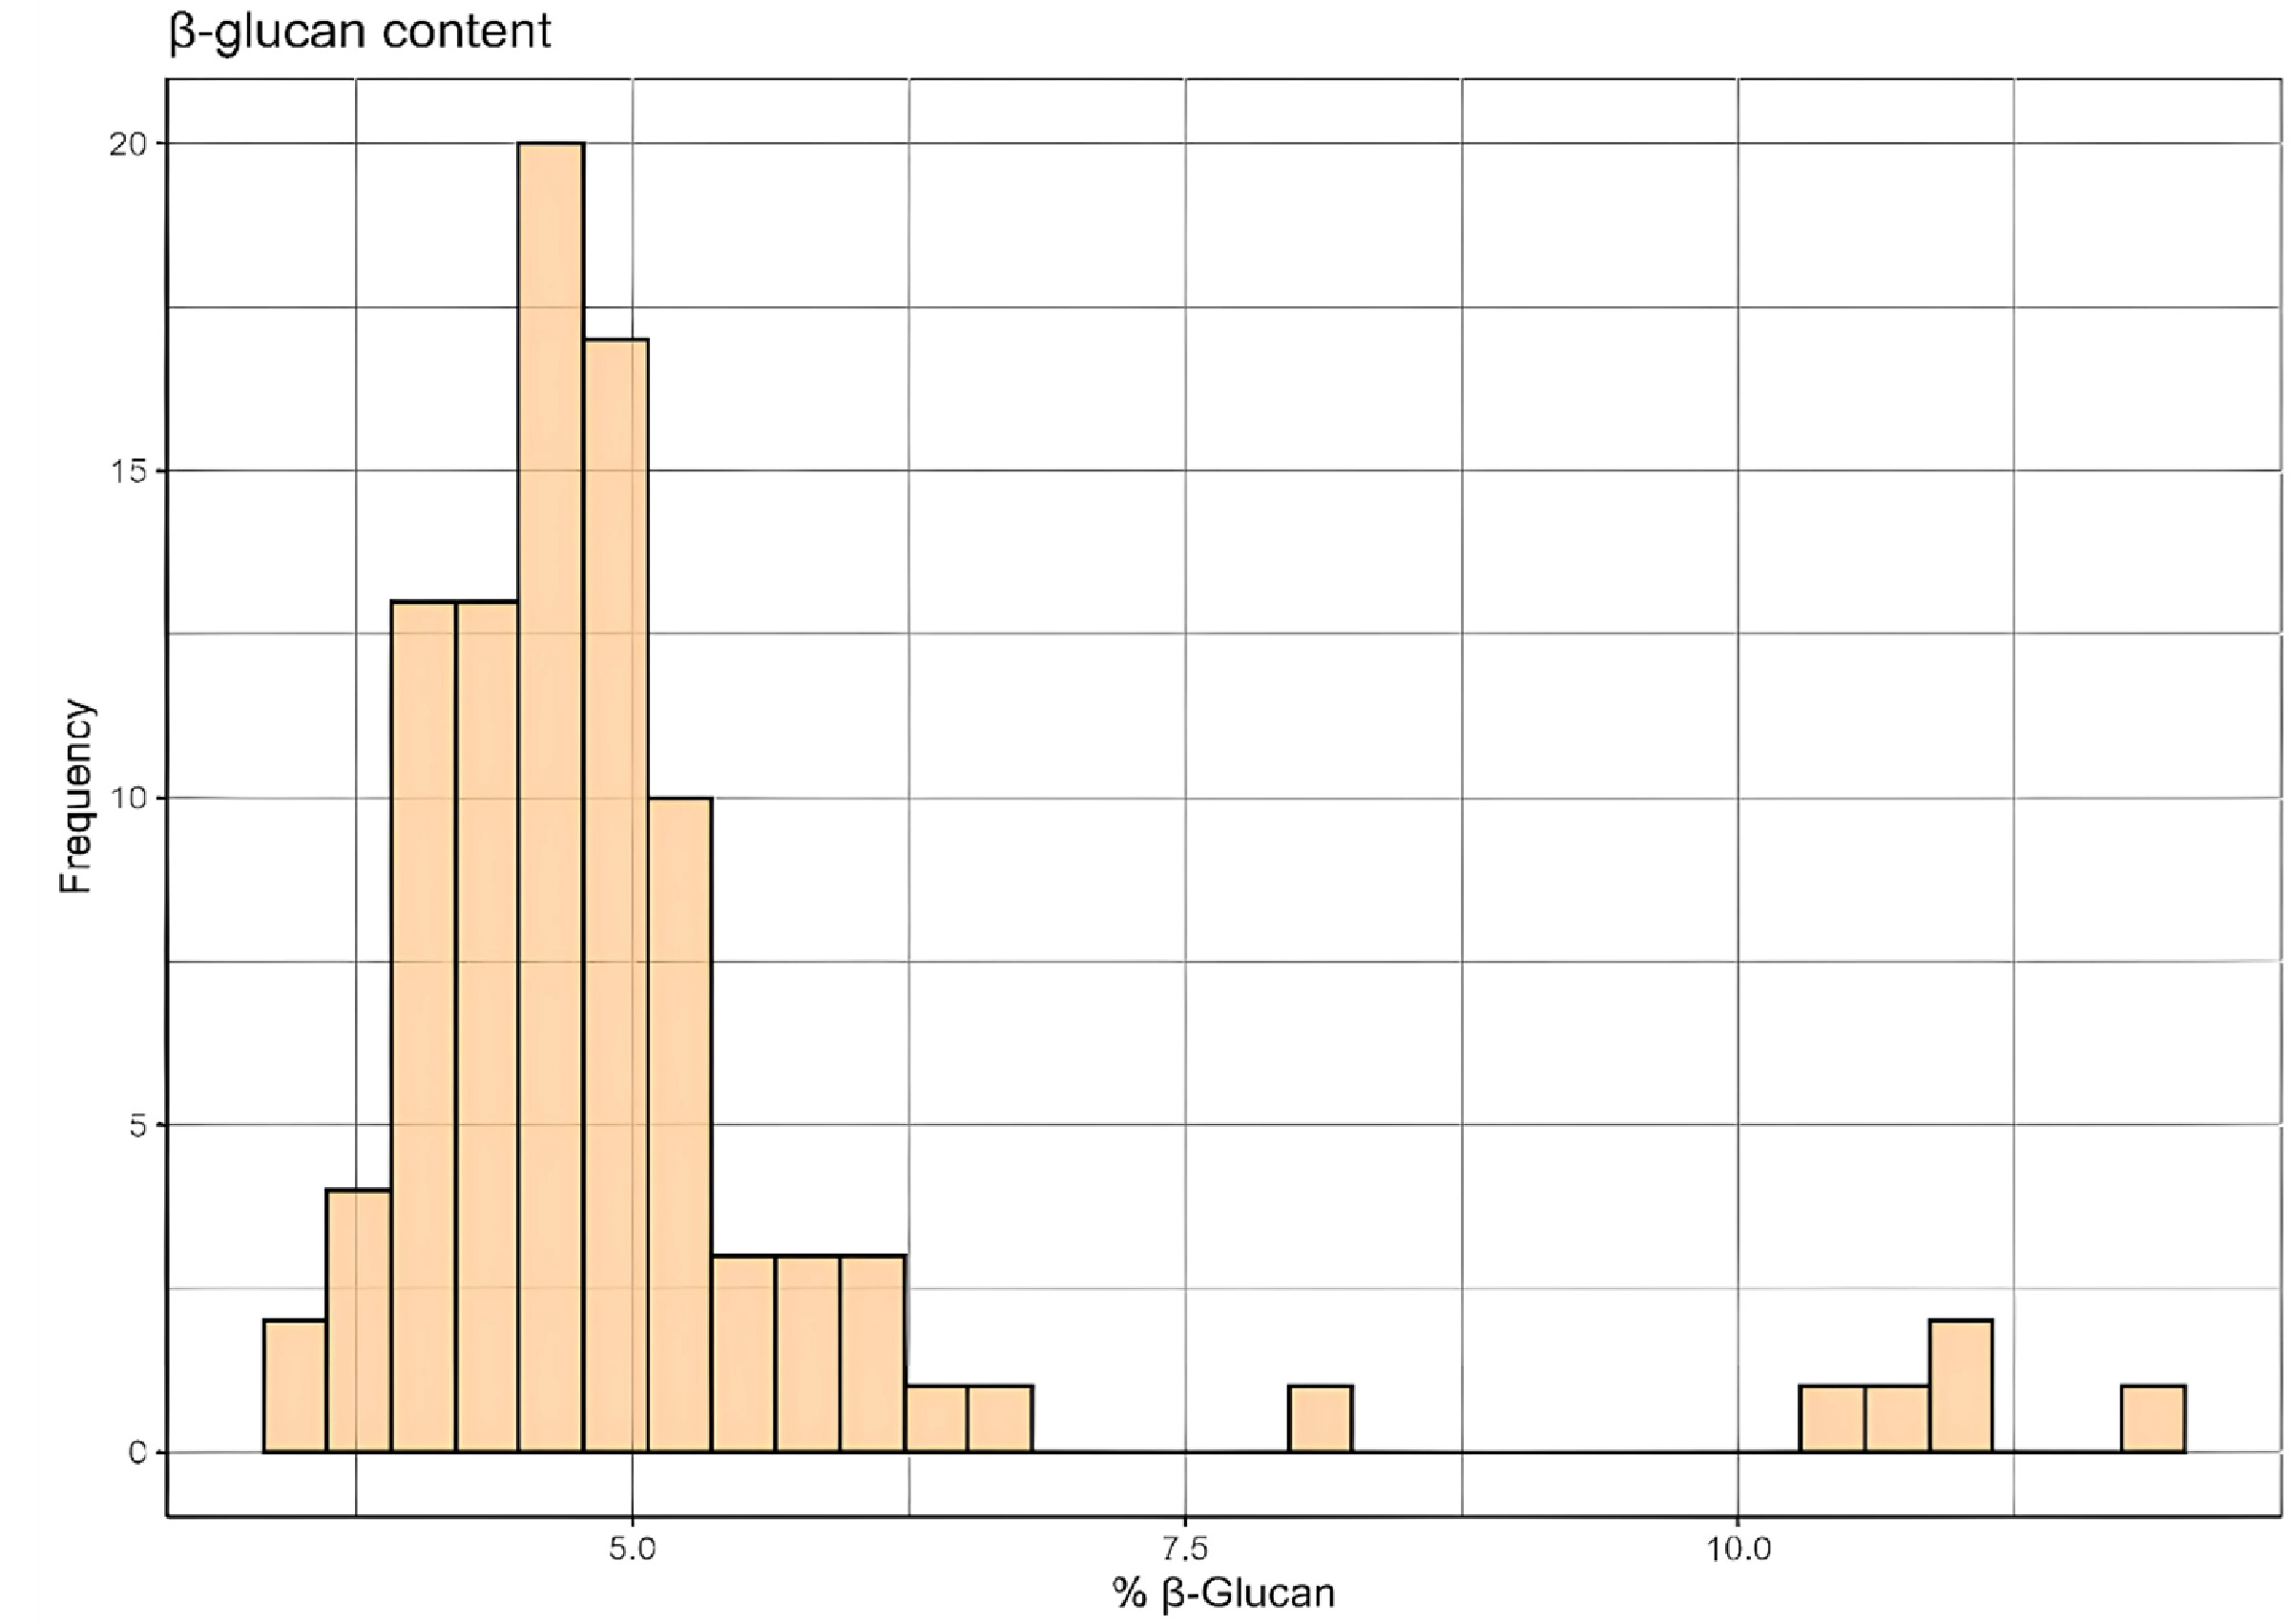
Fig. 2Determination of Genetic Clusters in Barley Population. a) ΔK plot showing the optimal number of genetic clusters using StructureSelector (K=4). b) STRUCTURE result of 96 barley genetic resources using SNPs from genotype-by-sequencing. Each color represents a different genetic cluster, indicating the genetic composition of individuals across the identified clusters.
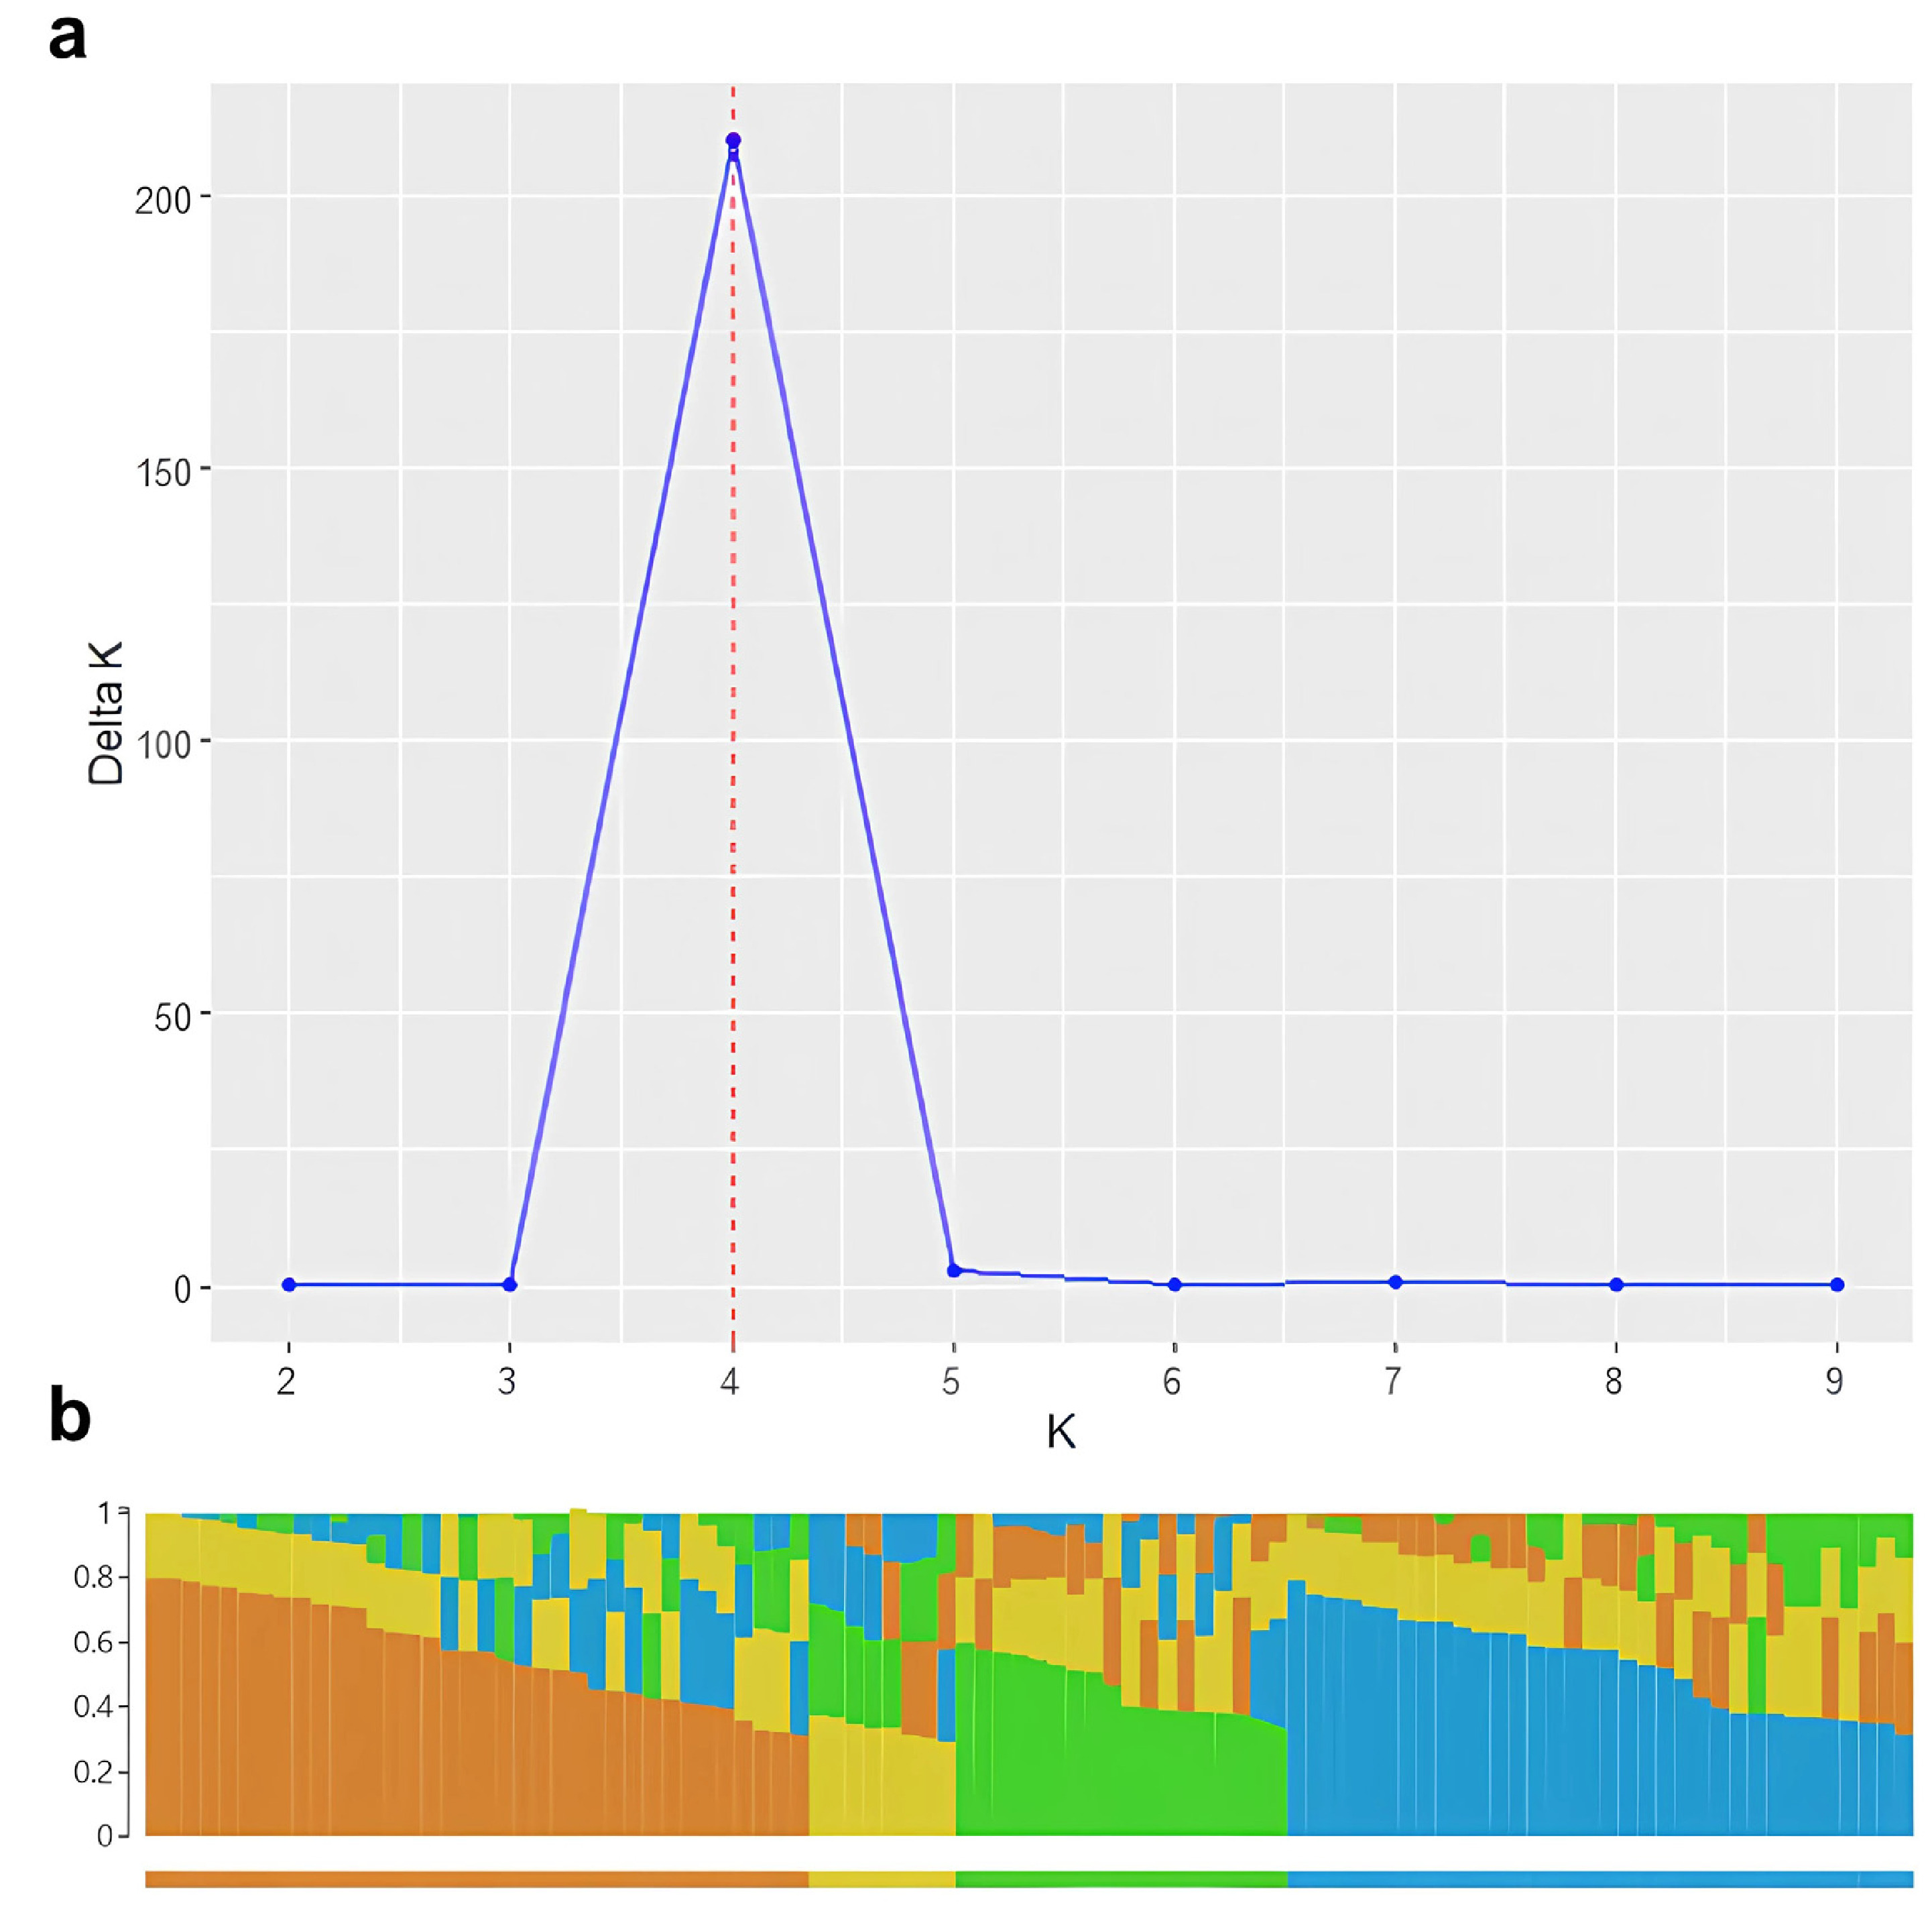
Fig. 3Quantile-quantile (QQ) plots comparing five GWAS models for β-glucan content in barley. Plots show the expected versus observed –log₁₀ (p) values for each model: (a) GLM, (b) MLM, (c) MLMM, (d) FarmCPU, and (e) BLINK. The red line indicates the null hypothesis of no association. Deviation from the diagonal line suggests the presence of true associations or genomic inflation.
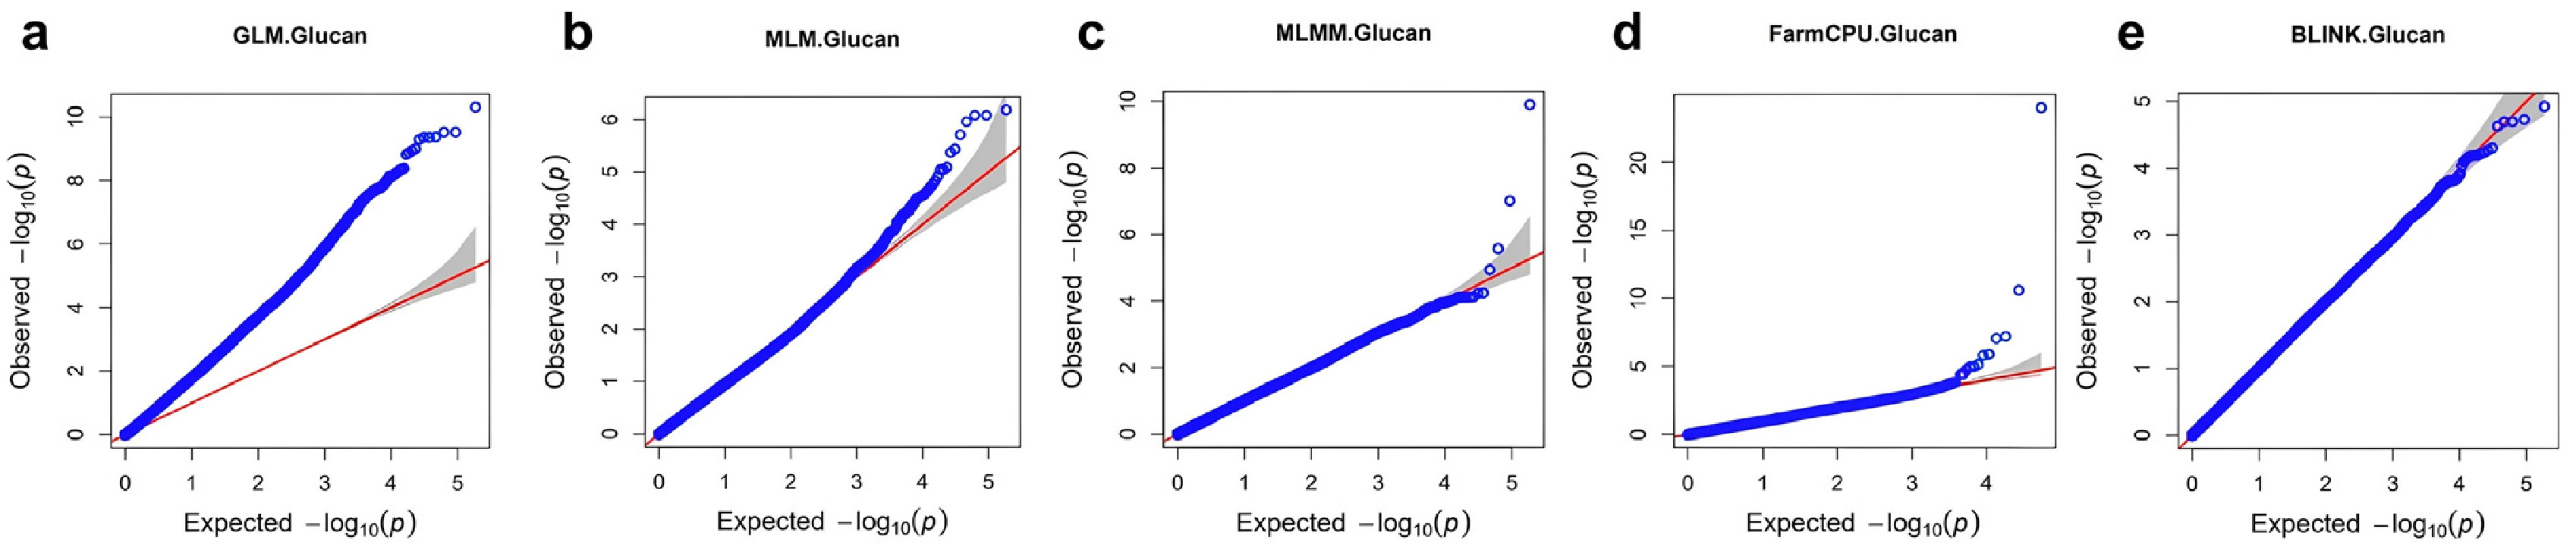
Fig. 4Manhattan plots and QQ plots of GWAS analysis of β-glucan content a) Manhattan plot of using FarmCPU b) QQ plot using FarmCPU.
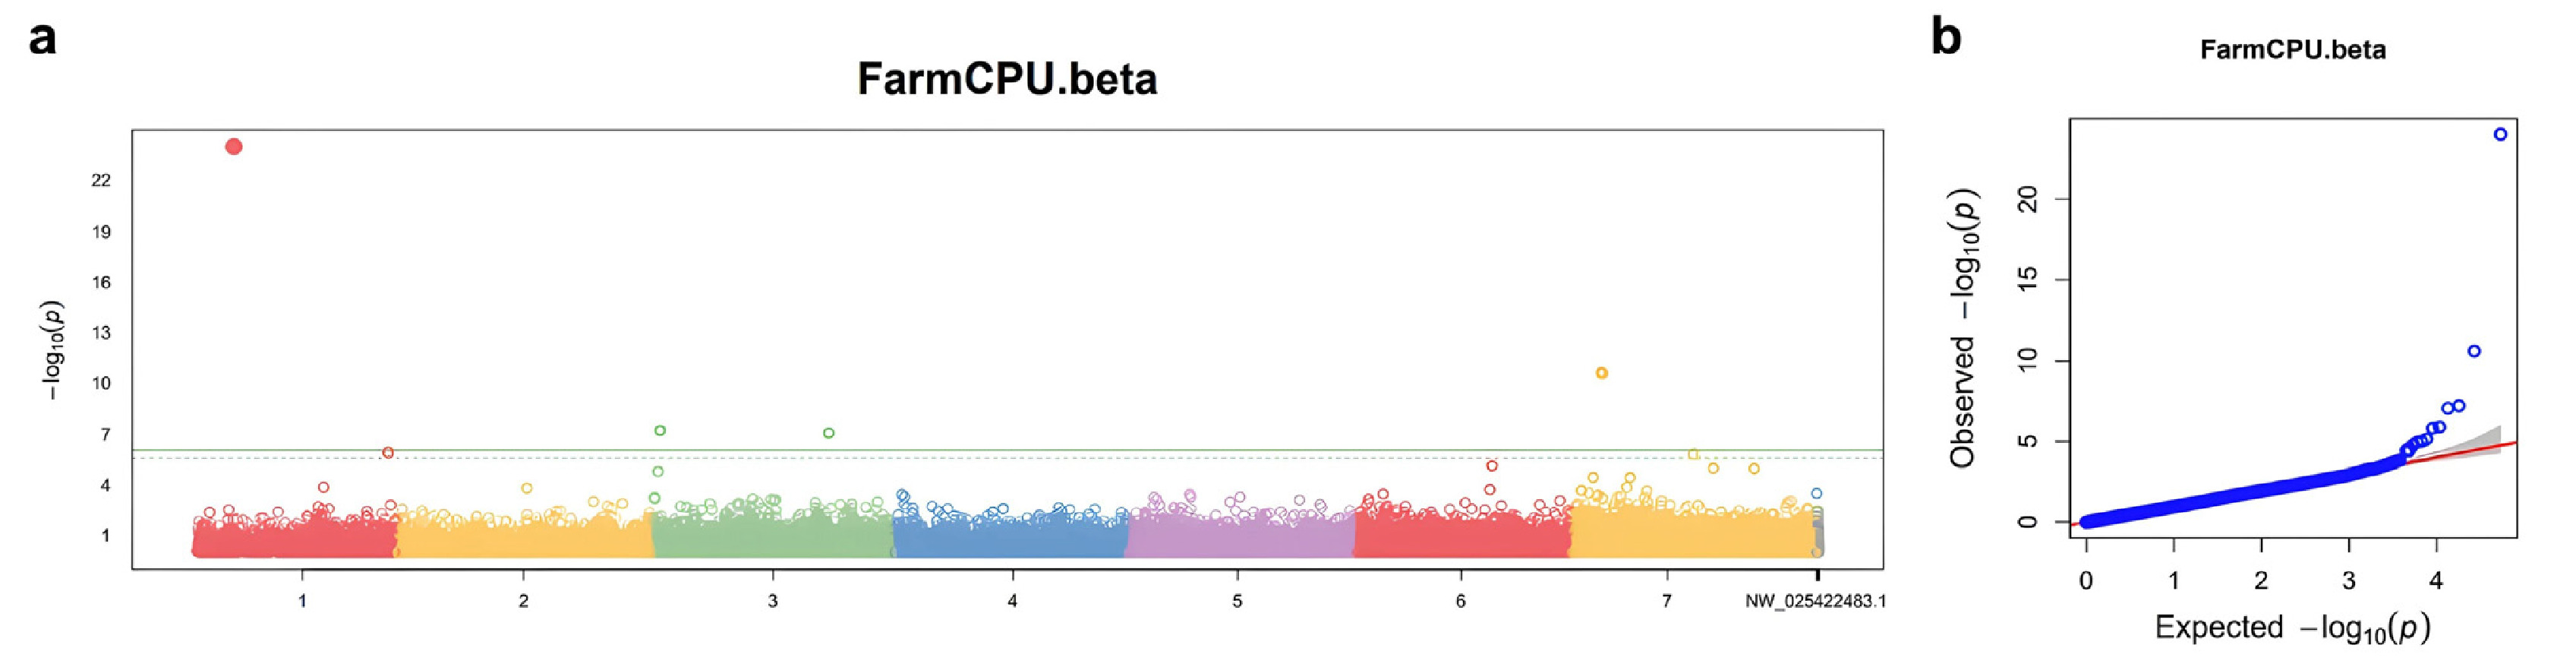
Table 1Significant SNPs associated with β-glucan content in barley.
Table 1
|
Model |
Significant SNPs |
|
GLM |
427 (excessively high, potential overfitting) |
|
MLM |
10 |
|
MLMM |
3 |
|
FarmCPU |
8 |
|
BLINK |
0 (conservatively estimated) |
Table 2Significant SNPs associated with β-glucan content in barley.
Table 2
|
Chr |
Position |
Log10 (P) |
SNP |
MAF |
Chr |
Pos |
Log10 (P) |
SNP |
MAF |
|
1 |
95383200 |
24.02 |
C/T |
0.114583 |
7 |
66951109 |
3.39 |
A/T |
0.328125 |
|
7 |
76051513 |
10.61 |
A/G |
0.46875 |
7 |
125149609 |
3.33 |
G/T |
0.348958 |
|
3 |
17752635 |
7.21 |
T/G |
0.135417 |
7 |
61966639 |
3.31 |
T/C |
0.0625 |
|
3 |
454486313 |
7.05 |
C/G |
0.166667 |
5 |
160551021 |
3.27 |
A/G |
0.161458 |
|
1 |
494764671 |
5.89 |
T/C |
0.270833 |
5 |
288196769 |
3.27 |
A/G |
0.161458 |
|
7 |
313233623 |
5.8 |
C/A |
0.09375 |
7 |
187058618 |
3.27 |
C/G |
0.161458 |
|
6 |
364921231 |
5.14 |
C/A |
0.15625 |
4 |
29504525 |
3.27 |
T/G |
0.09375 |
|
7 |
470181018 |
4.98 |
T/C |
0.057292 |
3 |
2865860 |
3.26 |
C/T |
0.182292 |
|
7 |
12381171 |
4.95 |
C/A |
0.291667 |
7 |
116407141 |
3.25 |
A/G |
0.104167 |
|
3 |
53757117 |
4.78 |
G/GCTT |
0.119792 |
5 |
65330358 |
3.25 |
G/A |
0.166667 |
|
7 |
148498886 |
4.43 |
A/C |
0.15625 |
7 |
78073797 |
3.19 |
C/G |
0.072917 |
|
7 |
327625675 |
4.42 |
C/T |
0.078125 |
3 |
257358822 |
3.16 |
T/C |
0.302083 |
|
1 |
327625675 |
3.86 |
G/A |
0.395833 |
3 |
3579993 |
3.16 |
C/A |
0.119792 |
|
7 |
140085458 |
3.84 |
C/A |
0.0625 |
6 |
33536833 |
3.15 |
A/T |
0.104167 |
|
2 |
337588736 |
3.8 |
G/A |
0.166667 |
3 |
305044545 |
3.13 |
C/T |
0.46875 |
|
6 |
347795232 |
3.72 |
T/C |
0.1875 |
5 |
72471733 |
3.12 |
G/T |
0.067708 |
|
7 |
23517391 |
3.66 |
A/T |
0.432292 |
3 |
315725789 |
3.11 |
G/C |
0.458333 |
|
7 |
23517403 |
3.66 |
C/T |
0.432292 |
5 |
442271545 |
3.1 |
G/C |
0.09375 |
|
7 |
192270496 |
3.64 |
G/A |
0.151042 |
3 |
312881964 |
3.07 |
C/G |
0.479167 |
|
7 |
42416371 |
3.52 |
G/T |
0.130208 |
6 |
529137957 |
3.05 |
T/A |
0.166667 |
|
6 |
71612676 |
3.46 |
G/A |
0.213542 |
7 |
565285409 |
3.03 |
C/G |
0.104167 |
|
5 |
158091320 |
3.43 |
C/A |
0.067708 |
7 |
194670585 |
3 |
G/T |
0.192708 |
|
4 |
22741625 |
3.42 |
G/T |
0.182292 |
2 |
510514882 |
3 |
C/T |
0.166667 |
Table 3Blastx results of barley genes against uniprot database.
Table 3
|
Chromosome |
Position |
Protein |
Functional annotation |
E-value |
|
NC_058518.1 |
494664671-494864671 |
P20025 |
MYB-related protein Zm38 |
2.90E-27 |
|
NC_058520.1 |
53657117-53857117 |
A0A8I6XXU2 |
C2 domain-containing protein |
7.99E-05 |
|
NC_058524.1 |
148398886-148598886 |
A1E9T1 |
ATP synthase subunit beta, chloroplastic |
1.67E-19 |
|
NC_058524.1 |
23417391-23617391 |
A1E9U9 |
ATP-dependent Clp protease proteolytic subunit |
1.53E-04 |
|
NC_058524.1 |
23417403-23617403 |
A1E9U9 |
ATP-dependent Clp protease proteolytic subunit |
1.53E-04 |
|
NC_058521.1 |
22641625-22841625 |
M0Y4P1 |
UDP-glucosyltransferase UGT13248 |
1.10E-24 |
|
NC_058524.1 |
66851109-67051109 |
Q40062 |
2'-deoxymugineic-acid 2'-dioxygenase |
3.11E-46 |
|
NC_058524.1 |
61866639-62066639 |
P14726 |
Anthocyanidin 3-O-glucosyltransferase |
1.36E-46 |
|
NC_058520.1 |
257258822-257458822 |
O23979 |
Soluble inorganic pyrophosphatase |
5.94E-15 |
|
NC_058519.1 |
510414882-510614882 |
P26517 |
Glyceraldehyde-3-phosphate dehydrogenase 1, cytosolic |
3.66E-84 |
References
- 1. Ambawat S, Sharma P, Yadav NR, Yadav RC. 2013. MYB transcription factor genes as regulators for plant responses: an overview. Physiol Mol Biol Plants 19: 307-321.
- 2. Ban SH, Choi C. 2018. Development of an apple F1 segregating population genetic linkage map using genotyping-by-sequencing. Plant Breed Biotech 6: 434-443.
- 3. Behall KM, Scholfield DJ, Hallfrisch J. 2005. Comparison of hormone and glucose responses of overweight women to barley and oats. J Am Coll Nutr 24: 182-188.
- 4. Bolger AM, Lohse M, Usadel B. 2014. Trimmomatic: a flexible trimmer for Illumina sequence data. Bioinformatics 30: 2114-2120.
- 5. Buchfink B, Xie C, Huson DH. 2015. Fast and sensitive protein alignment using DIAMOND. Nat Methods 12: 59-60.
- 6. Burton RA, Wilson SM, Hrmova M, Harvey AJ, Shirley NJ, Medhurst A, Stone BA, Newbigin EJ, Bacic A, Fincher GB. 2006. Cellulose synthase-like CslF genes mediate the synthesis of cell wall (1, 3; 1, 4)-ß-D-glucans. Science 311: 1940-1942.
- 7. Bush WS, Moore JH. 2012.
- 8. Cao Y, Li K, Li Y, Zhao X, Wang L. 2020. MYB transcription factors as regulators of secondary metabolism in plants. Biology 9: 61
- 9. Carpita NC. 2011. Update on mechanisms of plant cell wall biosynthesis: how plants make cellulose and other (1→ 4)-β-D-glycans. Plant Physiol 155: 171-184.
- 10. Clarke AK. 2012. The chloroplast ATP-dependent Clp protease in vascular plants-new dimensions and future challenges. Physiol Plant 145: 235-244.
- 11. Cominelli E, Sala T, Calvi D, Gusmaroli G, Tonelli C. 2008. Over-expression of the Arabidopsis AtMYB41 gene alters cell expansion and leaf surface permeability. Plant J 53: 53-64.
- 12. Consortium U. 2019. UniProt: a worldwide hub of protein knowledge. Nucleic Acids Res 47: D506-D515.
- 13. Cooperman BS, Baykov AA, Lahti R. 1992. Evolutionary conservation of the active site of soluble inorganic pyrophosphatase. Trends Biochem Sci 17: 262-266.
- 14. Cui M, Gupta SK, Bauer P. 2023. Role of the plant-specific calcium-binding C2-DOMAIN ABSCISIC ACID-RELATED (CAR) protein family in environmental signaling. Eur J Cell Biol 102: 151322.
- 15. Danecek P, Bonfield JK, Liddle J, Marshall J, Ohan V, Pollard MO, Whitwham A, Keane T, McCarthy SA, Davies RM. 2021. Twelve years of SAMtools and BCFtools. Gigascience 10: giab008.
- 16. Dawson IK, Russell J, Powell W, Steffenson B, Thomas WT, Waugh R. 2015. Barley: a translational model for adaptation to climate change. New Phytol 206: 913-931.
- 17. de Silva K, Laska B, Brown C, Sederoff HW, Khodakovskaya M. 2011. Arabidopsis thaliana calcium-dependent lipid-binding protein (AtCLB): a novel repressor of abiotic stress response. J Exp Bot 62: 2679-2689.
- 18. Evanno G, Regnaut S, Goudet J. 2005. Detecting the number of clusters of individuals using the software STRUCTURE: a simulation study. Mol Ecol 14: 2611-2620.
- 19. Farias J, Giorello FM. 2020. Positive selection in the chloroplastic ATP-synthase β-subunit and its relation to virulence factors. J Mol Evol 88: 703-713.
- 20. Farooqi M, Moody D, Bai G, Bernardo A, St. Amand P, Diggle AJ, Rengel Z. 2023. Genetic characterization of root architectural traits in barley (Hordeum vulgare L.) using SNP markers. Front Plant Sci 14: 1265925.
- 21. Geng L, Li M, Xie S, Wu D, Ye L, Zhang G. 2021. Identification of genetic loci and candidate genes related to β-glucan content in barley grain by genome-wide association study in International Barley Core Selected Collection. Mol Breed 41: 6
- 22. Hahn A, Vonck J, Mills DJ, Meier T, Kühlbrandt W. 2018. Structure, mechanism, and regulation of the chloroplast ATP synthase. Science 360: eaat4318.
- 23. Havrlentová M, Kraic J. 2006. Content of β-D-glucan in cereal grains. J Food Nutr Res 45: 97-103.
- 24. Hematian Sourki A, Hesarinejad MA. 2023. Molecular conformation and dilute solution properties of barley β-glucan: unveiling β-glucan as a highly flexible biopolymer under different processing conditions. Chem Biol Technol Agric 10: 69
- 25. Jadamba C, Kim JM, Lee H, Kim EG, Yoo S. 2024. GWAS analysis to identify candidate genes related to phosphorus deficiency tolerance by GWAS in Rice. Plant Breed Biotech 12: 82-97.
- 26. Kim C, Guo H, Kong W, Chandnani R, Shuang L-S, Paterson AH. 2016. Application of genotyping by sequencing technology to a variety of crop breeding programs. Plant Sci 242: 14-22.
- 27. Lex J, Ahlemeyer J, Friedt W, Ordon F. 2014. Genome-wide association studies of agronomic and quality traits in a set of German winter barley (Hordeum vulgare L.) cultivars using Diversity Arrays Technology (DArT). J Appl Genet 55: 295-305.
- 28. Li H. 2013. Aligning sequence reads, clone sequences and assembly contigs with BWA-MEM. arXiv preprint arXiv: 1303.3997..
- 29. Li YL, Liu JX. 2018. StructureSelector: A web-based software to select and visualize the optimal number of clusters using multiple methods. Mol Ecol Resour 18: 176-177.
- 30. Maguire S, Scheibe C, Eisgruber T, Mosesso N, Isono E, Hauser K. 2024. Membrane-specific and calcium-dependent binding of the Arabidopsis C2 domain protein CaLB revealed by ATR-FTIR spectroscopy. Spectrochim. Acta A Mol Biomol Spectrosc 307: 123629.
- 31. McCleary B, Glennie-Holmes M. 1985. Measurement of (1→ 3),(1→ 4)-β-D-glucan in barley and malt. J Inst Brew 91: 285-295.
- 32. McKenna A, Hanna M, Banks E, Sivachenko A, Cibulskis K, Kernytsky A, Garimella K, Altshuler D, Gabriel S, Daly M. 2010. The Genome Analysis Toolkit: a MapReduce framework for analyzing next-generation DNA sequencing data. Genome Res 20: 1297-1303.
- 33. Melo ATO, Bartaula R, Hale I. 2016. GBS-SNP-CROP: a reference-optional pipeline for SNP discovery and plant germplasm characterization using variable length, paired-end genotyping-by-sequencing data. BMC Bioinformatics 17: 29
- 34. Newton AC, Flavell AJ, George TS, Leat P, Mullholland B, Ramsay L, Revoredo-Giha C, Russell J, Steffenson BJ, Swanston JS. 2011. Crops that feed the world 4. Barley: a resilient crop? Strengths and weaknesses in the context of food security. Food Secur 3: 141-178.
- 35. Othman RA, Moghadasian MH, Jones PJ. 2011. Cholesterol-lowering effects of oat β-glucan. Nutr Rev 69: 299-309.
- 36. Pear JR, Kawagoe Y, Schreckengost WE, Delmer DPa, Stalker DM. 1996. Higher plants contain homologs of the bacterial celA genes encoding the catalytic subunit of cellulose synthase. Proc Natl Acad Sci U.S.A. 93: 12637-12642.
- 37. Pritchard JK, Stephens M, Donnelly P. 2000. Inference of population structure using multilocus genotype data. Genetics 155: 945-959.
- 38. Rius SP, Casati P, Iglesias AA, Gomez-Casati DF. 2008. Characterization of Arabidopsis lines deficient in GAPC-1, a cytosolic NAD-dependent glyceraldehyde-3-phosphate dehydrogenase. Plant Physiol 148: 1655-1667.
- 39. Rizo J, Sudhof TC. 1998. C2-domains, structure and function of a universal Ca2+-binding domain. J Biol Chem 273: 15879-15882.
- 40. Schreiber M, Wright F, MacKenzie K, Hedley PE, Schwerdt JG, Little A, Burton RA, Fincher GB, Marshall D, Waugh R. 2014. The barley genome sequence assembly reveals three additional members of the CslF (1, 3; 1, 4)-β-glucan synthase gene family. PloS One 9: e90888.
- 41. Segami S, Tomoyama T, Sakamoto S, Gunji S, Fukuda M, Kinoshita S, Mitsuda N, Ferjani A, Maeshima M. 2018. Vacuolar H+-pyrophosphatase and cytosolic soluble pyrophosphatases cooperatively regulate pyrophosphate levels in Arabidopsis thaliana. Plant Cell 30: 1040-1061.
- 42. Sirover MA. 2011. On the functional diversity of glyceraldehyde-3-phosphate dehydrogenase: biochemical mechanisms and regulatory control. Biochim Biophys Acta Gen Subj 1810: 741-751.
- 43. Sivula T, Salminen A, Parfenyev AN, Pohjanjoki P, Goldman A, Cooperman BS, Baykov AA, Lahti R. 1999. Evolutionary aspects of inorganic pyrophosphatase. FEBS Lett 454: 75-80.
- 44. Sjögren LL, Clarke AK. 2011. Assembly of the chloroplast ATP-dependent Clp protease in Arabidopsis is regulated by the ClpT accessory proteins. Plant Cell 23: 322-332.
- 45. Sjogren LL, Stanne TM, Zheng B, Sutinen S, Clarke AK. 2006. Structural and functional insights into the chloroplast ATP-dependent Clp protease in Arabidopsis. Plant Cell 18: 2635-2649.
- 46. Skovbjerg CK, Sarup P, Wahlström E, Jensen JD, Orabi J, Olesen L, Jensen J, Jahoor A, Ramstein G. 2025. Multi-population GWAS detects robust marker associations in a newly established six-rowed winter barley breeding program. Heredity 134: 33-48.
- 47. Sonnewald U. 1992. Expression of E. coli inorganic pyrophosphatase in transgenic plants alters photoassimilate partitioning. Plant J 2: 571-581.
- 48. Soong YY, Quek RYC, Henry CJ. 2015. Glycemic potency of muffins made with wheat, rice, corn, oat and barley flours: A comparative study between in vivo and in vitro. Eur J Nutr 54: 1281-1285.
- 49. Speicher TL, Li PZ, Wallace IS. 2018. Phosphoregulation of the plant cellulose synthase complex and cellulose synthase-like proteins. Plants 7: 52
- 50. Stracke S, Presterl T, Stein N, Perovic D, Ordon F, Graner A. 2007. Effects of Introgression and Recombination on Haplotype Structure and Linkage Disequilibrium Surrounding a Locus Encoding Bymovirus Resistance in Barley. Genetics 175: 805-817.
- 51. Tosh SM, Bordenave N. 2020. Emerging science on benefits of whole grain oat and barley and their soluble dietary fibers for heart health, glycemic response, and gut microbiota. Nutr Rev 78: 13-20.
- 52. Van der Auwera GA, Carneiro MO, Hartl C, Poplin R, Del Angel G, Levy-Moonshine A, Jordan T, Shakir K, Roazen D, Thibault J. 2013. From FastQ data to high-confidence variant calls: the genome analysis toolkit best practices pipeline. Curr Protoc Bioinformatics 43: 11
- 53. Wang J, Zhang Z. 2021. GAPIT version 3: boosting power and accuracy for genomic association and prediction. Genom Proteom Bioinform 19: 629-640.
- 54. Wang X, Niu Y, Zheng Y. 2021. Multiple functions of MYB transcription factors in abiotic stress responses. Int J Mol Sci 22: 6125
- 55. Xu J, Inglett GE, Liu SX, Boddu VM. 2016. Micro-Heterogeneity and Micro-Rheological Properties of High-Viscosity Barley β-Glucan Solutions Studied by Diffusing Wave Spectroscopy (DWS). Food Biophys 11: 339-344.
- 56. Yanhui C, Xiaoyuan Y, Kun H, Meihua L, Jigang L, Zhaofeng G, Zhiqiang L, Yunfei Z, Xiaoxiao W, Xiaoming Q. 2006. The MYB transcription factor superfamily of Arabidopsis: expression analysis and phylogenetic comparison with the rice MYB family. Plant Mol Biol 60: 107-124.
- 57. Zancani M, Braidot E, Filippi A, Lippe G. 2020. Structural and functional properties of plant mitochondrial F-ATP synthase. Mitochondrion 53: 178-193.