적요
Flower color is one of the key trait that determines the marketability of chrysanthemums. However, genetic research on chrysanthemum remains limited because of numerous environmental factors and the complexity of the chrysanthemum genome. To gain a deeper understanding of the genetic mechanisms underlying flower color in chrysanthemum, this study conducted genotyping analysis on 94 F1 progenies derived from a cross between two wild chrysanthemum parents, ‘CWT2’ and ‘CWT8,’ which exhibit distinct flower colors. Genotyping-by-sequencing (GBS) was used for SNP identification, resulting in 79,002 single nucleotide polymorphisms (SNPs). After stringent filtering, 2,548 SNP markers were selected to construct a GBS-SNP linkage map, which was subsequently used to detect quantitative trait loci (QTLs) associated with flower color. Four QTL were identified, encompassing genes involved in carotenoid biosynthesis, carotenoid degradation, and the methylerythritol phosphate pathway. Among the 16 candidate genes analyzed for their potential role in flower color determination, three genes (VDE, CYP707A4, and CYP707A2) were ultimately selected for molecular marker development. The findings of this study provide a valuable foundation for understanding the genetic basis of carotenoid degradation in chrysanthemums. Future in-depth research is expected to facilitate the development of new chrysanthemum varieties for breeding programs through marker-assisted selection in breeding programs.
서언
국화(
Chrysanthemum morifolium Ramat.)는 전 세계적으로 가장 중요한 관상용 작물 중 하나이며, 우리나라의 화훼 산업에서도 장미에 이어 절화 생산량의 많은 부분을 차지하고 있다(Korea Agricultural Statistics Service, KASS 2023). 국화는 가장 큰 속씨식물인 국화과(Asteraceae)에 속하며, 오랜 재배 역사를 가지고 있다(
Zhang et al. 2011). 일반적으로 절화, 분화 또는 정원용 식물로 재배되며, 약효로도 잘 알려져 있다. 또한, 국화는 이배체에서 십배체까지 다양한 배수성을 가지고 있다(
Wang et al. 2014). 상업적으로 재배되는 주요 국화 종인
C. morifolium은
C. indicum (2n=18, 2n=36),
C. lavandulifolium (2n=18),
C. makinoi (2n=18),
C. zawadski (2n=18, 2n=36, 2n=54, 2n=72)와 같은 야생종의 교잡에서 유래한 이질육배체(allohexaploid, 2n=6x=54)인 것으로 추정되고 있다(
Anderson 2006,
Dai & Chen 1996,
Dowrick 1953). 재배 국화의 야생 조상은 유용한 저항성 유전자를 보유하고 있는 귀중한 유전자원으로, 이들은 유전자간 또는 종간 교배를 통해 국화 품종에 도입할 수 있다(
Teixeira da Sliva 2013).
국화에 대한 시장 수요가 다양화되면서 꽃의 색깔(化色), 크기, 식물 구조와 같은 새로운 외관 및 스트레스 저항성 품질에 초점을 맞춘 품종 연구가 계속 증가하고 있다(
Anderson 2006). 국화의 표현형 형질에는 풍부한 유전적 변이가 존재한다. 특히 화색은 소비자의 선택을 결정하는 주요 요인 중 하나로, 농업의 상업적 및 소비자 요구를 충족시킬 수 있는 중요한 형질이다. 현재까지 국화 육종은 전통적인 교배 방법을 통해 이루어져 왔다. 그러나 전통적 육종 방법으로 원하는 우수 형질을 선택하는 것은 많은 시간이 소요되기 때문에 매우 비효율적이다. 최근 DNA 기반의 분자육종 기술이 급속히 발전하면서 분자표지이용선발(Marker assisted selection, MAS)을 통해 목표 형질을 더 빠르고 쉬운 방법으로 선택할 수 있게 되었다(
Hasan et al. 2021,
Kim et al. 2014,
Lee et al. 2020).
화색의 차이는 꽃 조직의 염색체나 세포 내 액포에 있는 색소의 존재 여부에 의해 결정될 수 있다(
Grotewold 2006). 색소는 주로 카로티노이드, 안토시아닌, 베타라인과 같이 세 가지 유형으로 나뉘며, 이 중 카로티노이드는 일반적으로 노란색, 주황색, 밝은 빨간색을 나타내는 생리활성 색소로 잘 알려져 있다(
Vílchez et al. 2011). 고등 식물의 녹색 조직에서 카로티노이드는 광산화 손상으로부터 조직을 보호하는 중요한 역할을 한다(
Britton 1993). 현재까지 국화의 화색 연구는 주로 노란색과 흰색 간의 관계에 중점을 두어 왔다. 국화 꽃잎의 노란색은 카로티노이드에 의한 것이며, 흰색 꽃잎에 대해 열성 형질로 나타내기도 한다(
Langton 1980). 또한, 카로티노이드 생합성을 억제하는 단일 우성 유전자가 존재한다고 보고된 바 있다(
Hattori 1991). 그러나 화색에 영향을 미치는 요인은 여러 유전자에 의해 제어되며 다양한 대사 경로가 관여하기도 한다(
Zhao & Tao 2015). 따라서 카로티노이드 축적 또는 분해에 따른 분자적 조절 메커니즘은 매우 복잡하게 이루어져 있으므로 화색의 유전적 기초를 이해하기 위해서는 다양한 조절 인자를 탐색하는 것이 중요하다.
본 연구에서는 화색이 서로 다른 이배체 야생 국화의 교배에서 파생된 94개의 F1 집단을 대상으로 주요 및 부수적인 유전 영역을 탐색하고 그 유전적 패턴을 분석하였다. 먼저 교배집단의 화색 표현형을 조사한 뒤 genotyping-by-sequencing (GBS)의 단일 염기 다형성(single nucleotide polymorphisms, SNPs)을 이용한 양적 형질 유전자좌(quantitative trait loci, QTL)를 통해 카로티노이드와 관련된 후보 유전자를 확인하였다. 이러한 결과는 화색을 결정하는 유전적 요인에 대한 기초 정보를 제공하고, 국화 분자표지의 실질적 적용에 대한 기반을 확립하고자 수행되었다. 또한, 본 결과는 국화 육종의 효율성 향상을 위한 필수적인 기초 자료로 활용될 수 있을 것이다.
재료 및 방법
식물 재료 및 화색 지수 평가
본 연구에서는 농촌진흥청 국립원예특작과학원에서 제공한 야생 국화의 이배체 품종인 ‘CWT2’ (
C. boreale, P
1)와 ‘CWT8’ (
C. makinoi, P
2)의 교배에서 얻어진 94개의 F
1 집단을 사용하였다. ‘CWT2’ 품종은 노란색이며 늦게 개화하는 반면 ‘CWT8’ 품종은 흰색으로 일찍 개화하는 특성을 가진다. 부모 품종과 F
1 집단은 128개의 plug-tray에서 3주 동안 재배되었으며, 2021년 7월에 삽목 및 증식되었다. 한 달 후, 발근된 삽목묘를 폴리에틸렌 하우스에 개체당 3반복으로 이식하였다. 실제로는 152개의 F
1 자손을 확보하였지만, 이 중 58개의 식물은 생육 문제로 인해 표현형을 분석하지 못했다. 화색 지수는 색소 척도를 사용하여 유전자형별 임의로 선택된 3개의 식물에 대해 표현형을 평가하였다. 화색 지수는 흰색, 밝은 노란색, 진한 노란색으로 나타내었다(
Fig. 1). 양친의 유전자형에 대한 통계 분석은 ‘CWT2’ 또는 ‘CWT8’가 각각 모본일 경우 F
1 집단에 대한 화색의 표현형 분포를 확인하였고, 이후 chisquare test 수식을 이용하여 분리비 검정을 수행하였다.
국화의 어린 잎에서 추출된 152개의 F
1 개체와 두 부모의 genomic DNA (gDNA)는 DNeasy® Plant Mini Kit (Qiagen, Hilden, Germany)을 사용하여 제조사의 프로토콜에 따라 분리하였다. GBS 라이브러리 제작을 위해 각 샘플의 정제된 gDNA는
ApeKI 제한효소(New England Biolabs, MA, USA)로 처리하였고 이후 barcode sequence를 이용하여 GBS로 태그되었다(
Elshire et al. 2011). 제작된 라이브러리는 Illumina사의 NextSeq500 플랫폼을 통해 single-end sequencing으로 수행하여 평균 150 bp의 read가 생성되었다. Barcode sequence 정보를 기반으로 demultiplexing 후, Cutadapter (v.1.16) 프로그램을 이용하여 adapter sequence 제거하였다. 전처리 과정을 거친 read는 Bowtie2 (v.2.3.3.1)을 이용하여 야생 국화의 참조유전체인
C. boreale의 염기서열에 정렬하였고, GATK HaplotypeCaller와 VCFtools을 통해 SNP matrix를 작성하였다. SNP matrix는 minor allele≥2, maximal alleles=2, minor allele frequency≥0.05, mean depth≥5, missing genotype≤0.05의 SNP 필터 기준에 맞춰 적용하였고, outcross 타입에 따라 부모 중 하나 또는 양쪽 모두에서 누락 데이터가 있거나 동형접합인 경우에도 해당 SNP을 제외하였다.
GBS 분석을 통해 발굴된 모든 SNP은
C. boreale의 참조유전체 서열(미공개 데이터)에 의해 정렬된 후 R/onemap package (
Margarido et al. 2007,
R Core Team 2020)를 이용하여 scaffold로 구성된 연결지도(linkage map, LG)를 작성하였다. 화색 관련 QTL 분석은 IciMapping v4.1 프로그램을 사용하였고, inclusive composite interval mapping (ICIM) 방법으로 유전 영역을 탐색하였다(
Meng et al. 2015). SNP 마커 간의 유전적 거리는 Kosambi mapping 함수를 사용하여 계산하였다(
Kosambi 1943). 모든 QTL은 ‘
q’ (QTL의 약어), 형질 이름, LG 번호, QTL 번호 순서로 명명하였다(
Amanullah et al. 2020).
QTL 영역에서 상위(up-stream)와 하위(down-stream)에서 최대 200 kb 범위 내 위치한 유전자를 탐색하였다. 선발된 후보 유전자는, exon 예측 서열에서 intron 영역, 1~3개를 증폭하는 프라이머를 설계하였고(NCBI_primer blast), PCR 반응과 전기영동을 통해 그 유전자형 패턴을 확인하였다. 유전자 증폭을 위해 25 ng의 gDNA와 10 pmol/µl의 프라이머와 0.2 U의 Taq DNA polymerase, 0.4 mM의 dNTP, 3 mM의 MgCI2 (Enzynomics, Daejeon, Korea)이 포함된 20 µl의 최종 산물을 이용하여 PCR을 수행하였다. PCR 반응은 94℃에서 5분간 초기 변성하였고, 이후 94℃에서 30초, 60℃에서 30초, 72℃에서 1분간 총 35회 반복하였다. 증폭된 PCR 산물은 1×TAE buffer가 포함된 2.5% agarose gel에서 80 V로 3시간 동안 로딩하여 전기영동을 통해 부모와 F1 분리집단의 화색을 확인하였다.
결과 및 고찰
부모와 F1 집단에서의 화색 분포 조사
국화 94개의 F
1 집단과 부모에서 화색의 분포를 조사하였다(
Fig. 1A). ‘CWT2’와 ‘CWT8’의 교배 및 ‘CWT8’과 ‘CWT2’의 교배를 통해 나타난 화색의 유전적 분포는 노란색이 흰색에 대해 3:1의 우성 비율을 나타내었다(
Table 1). 화색 분류는 모든 개체의 특성을 확인한 다음 색상을 3단계로 나누어 조사하였다. ‘CWT2’와 ‘CWT8’ 조합에서는 노란색 41개(밝은 노란색 4개, 진한 노란색 37개)와 흰색 15개가 분포하였고, ‘CWT8’과 ‘CWT2’ 조합에서는 노란색 26개(밝은 노란색 3개, 진한 노란색 23개)와 흰색 12개의 화색이 관찰되었다(
Fig. 1B). 결과적으로 ‘CWT2’가 포함된 모계 또는 부계의 상호 교배 조합은 노란색 색소의 특성이 우성인자의 영향을 받고 있음을 확인하였다. 국화는 종의 특성상 유전체의 복잡성과 이형접합성으로 인해 형질 유전 연구가 매우 어렵기 때문에 타 작물에 비해 연구가 느리게 진행되고 있다. 이전의 꽃 형질 관련 연구에서는 유전적 우성과 모계 유전에 대해 보고된 바 있었다(
Chen et al. 2003). 또한, 국화의 아네모네와 비아네모네 꽃 유형을 가진 다양한 F
1 교배집단의 유전 분석에서 3:1 또는 1:1의 분리 비율이 나타나 모계 또는 부계의 효과를 확인할 수 있었다(
Yang et al. 2023). 카네이션의 경우, 열성 대립유전자가 카네이션의 단일 꽃잎 모양을 제어한다고 보고되었으나, 국화의 경우는 일부 F
1 집단을 제외하고 우성 또는 열성 대립유전자에 의해 완전하게 제어되지 않았음을 보고하였다(
Yagi et al. 2014). 따라서 3:1의 유전 분리는 매우 복잡한 유전의 효과일 수 있으며, 하나 이상의 유전자 또는 유사한 기능을 가진 다른 유전자의 영향으로도 그 특성이 제어될 수 있음을 시사한다. 본 연구의 결과는
C. boreale에서 노란색 꽃잎의 특성이 우성을 나타내는 중요한 요인이 될 수 있음을 판단하였다.
카로티노이드 관련 유전자 탐색을 위해 단백질 서열의 상동성 검색과 기존 보고된 문헌을 기반으로 클러스터링을 수행하였다. 국화의 참조유전체인
C. boreale의 카로티노이드 대사 경로에 관여하는 효소를 인코딩하는 54개의 후보 유전자를 확인하였다(
Supplementary Table 1). 확인된 유전자들은 크게 methylerythritol phosphate (MEP), 카로티노이드 생합성, 카로티노이드 분해의 세 가지 대사 경로로 분류되었다. 먼저, MEP 경로와 관련된 유전자들은 총 15개로 확인되었다. 이 중
4-HYDROXY-3-METHYBUT-2-ENYL DIPHOSPHATE REDUCTASE (
HDR)가 가장 많이 탐색되었고, 다음으로
4-HYDROXY-3-METHYBUT-2-ENYL DIPHOSPHATE SYNTHASE (
HDS)와
1-DEOXY-E-XYLULOSE 5- PHOSPHATE SYNTHASE (
DXS)가 확인되었다. 카로티노이드 생합성 효소와 관련된 유전자들은 총 20개로,
LYCOPENE BETA-CYCLASE (
LCYB),
ZETA-CAROTENE DESATURASE (
ZDS),
VIOLAXANTHIN DE-EPOXIDASE (
VDE),
CAROTENOID ISOMERASE (
CRTISO),
PHYTOENE DESATURASE (
PDS) 등의 유전자를 포함하고 있었다. 카로티노이드 분해에 관련된 유전자들은 19개가 확인되었으며,
CYTOCHROME P450,
FAMILY 707,
SUBFAMILY A,
POLYPEPTIDE 2,
3,
4 (
CYP707A2,
CYP707A3,
CYP707A4와
CAROTENOID CLEAVAGE DIOXYGENASE 1,
4,
8 (
CCD1,
CCD4,
CCD8)가 다수 확인되었다. 카로티노이드는 다양한 색소 그룹을 나타내기도 하지만, 광합성, 광형성 및 식물 발달에서 필수적인 생물학적 과정을 조절하기도 한다(
Lu & Li 2008). 원예 작물의 카로티노이드 대사 과정은 MEP 경로를 통한 카로티노이드 합성의 기질 생성(
DXS,
HDR,
HDS)을 통해 카로틴과 크산토필(
PDS,
Z-ISO,
CRTISO,
LCYB,
VDE), 케로카로티노이드, 아포카로티노이드 생성(
NCED,
CCD)으로 이루어져 있으며, 카로티노이드 조성 및 함량에 따라 유전자 및 관련 효소들의 발현 수준이 조절되기도 한다(
Ha et al. 2012,
Yuan et al. 2015). 특히 노란색 꽃을 가진 국화에서는 꽃잎이 발달하는 동안 카로티노이드 축적 증가와 급격한 구성 요소 변화가 나타났지만, 흰색 꽃을 가진 국화에서는 꽃잎의 카로티노이드 함량이 급격하게 감소하였으며 발달 후반에는 검출 한계 이하로 떨어졌다는 결과가 보고된 바 있다(
Kishimoto & Ohmiya 2006).
GBS는 Illumina 기반의 염기서열 분석을 통해 수행되었다(
Table 2). 국화 F
1 집단에서 총 605,292,420개의 raw read가 생성되었고, 이 중 약 605,208,239개의 clean read (Phred quality score≥Q30)가 분석에 사용되었다. 이후 adapter를 제거한 clean read 들은
C. boreale의 참조유전체 서열에 약 489,741,931개(82.34%)의 read가 mapping 되었고, 개체당 평균 3,180,142개의 read가 확인되었다. 국화 F
1 집단은 참조유전체 대비 총 6,806개의 raw SNP이 탐지되었으나 필터링을 통해 최종적으로 2,548개의 고품질 SNP을 확보하였다. GBS 기술은 일반적으로 크고 복잡한 게놈을 가진 비모델 식물에서 주로 사용되고 있다(
Heo et al. 2017,
Zhao et al. 2021). 특히 국화과 작물에서도 적용 가능성이 높은데, 해바라기(
Helianthus annuus L.)에서 SNP 식별을 위한 연구가 보도된 바 있다(
Cvejić et al. 2016). 본 연구에서 확보한 SNP data는 향후 specific locus amplified fragment sequencing (SLAF-seq) 기반의 분석과 연계하여(
Song et al. 2020), 국화 육종 연구에 활용될 수 있을 것으로 기대된다.
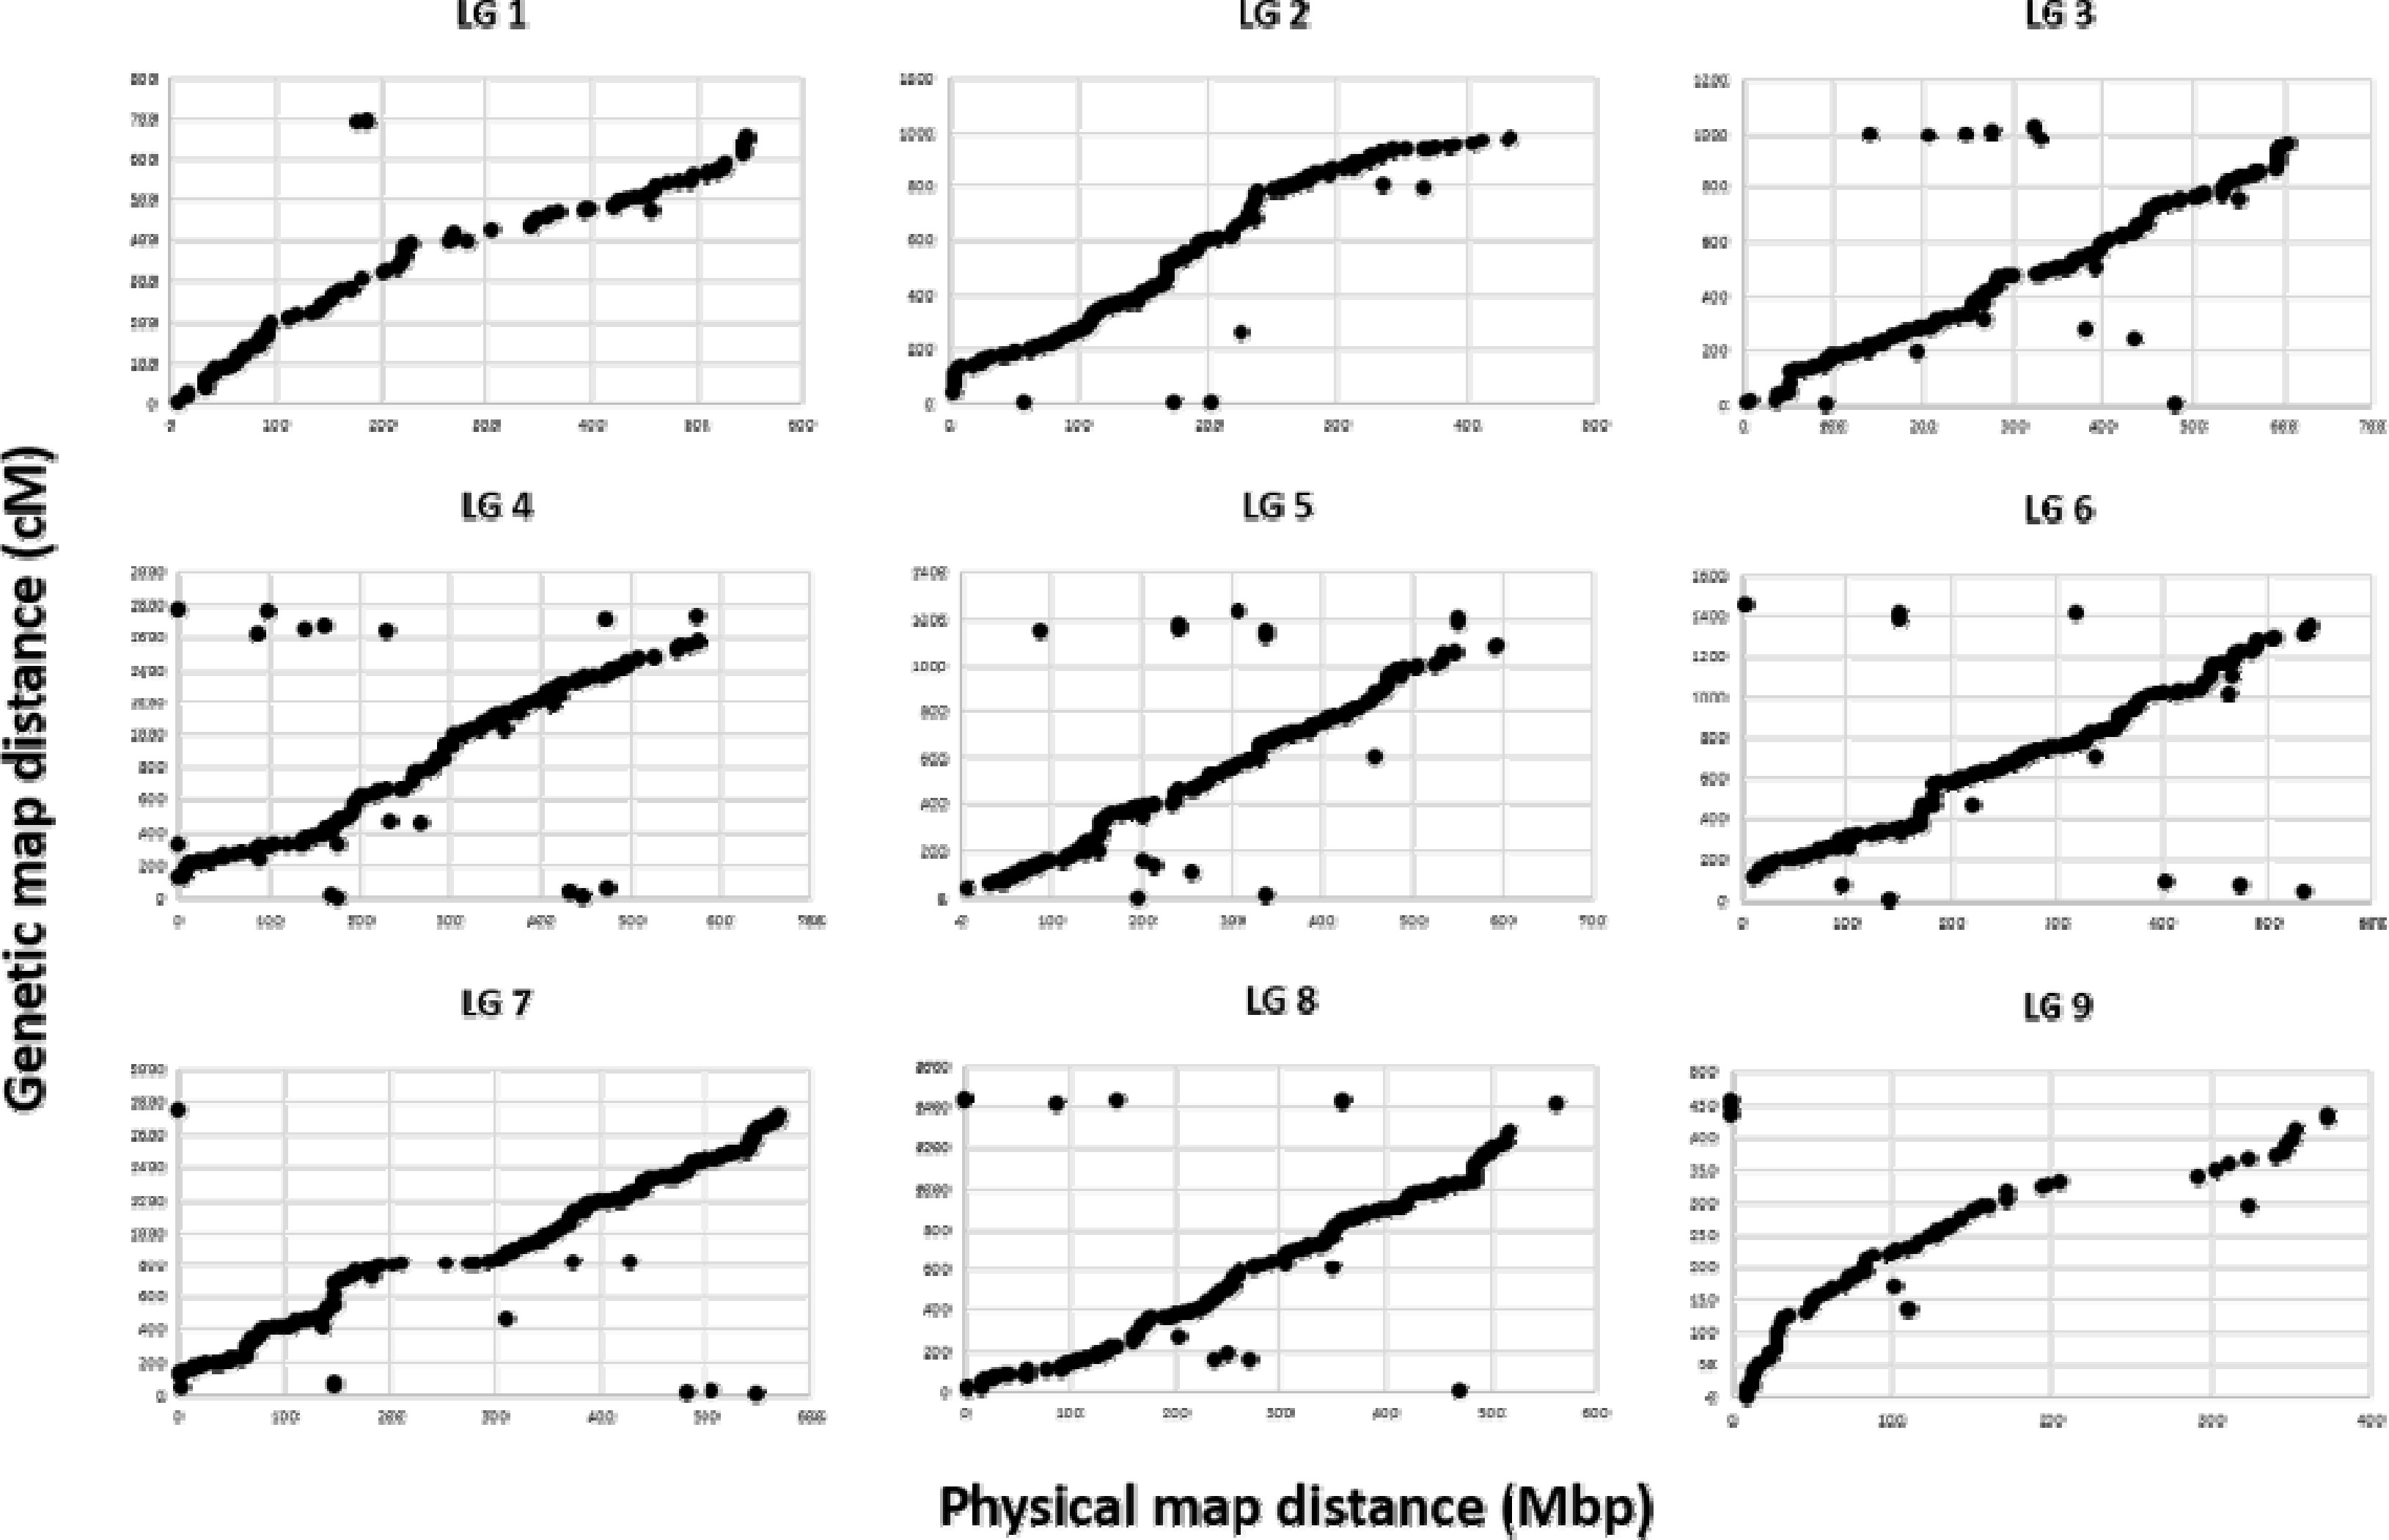
국화 F
1 집단에 대한 최종 SNP은 9개의 LG에 mapping 되었다. LG의 순서는 참조유전체인
C. boreale 데이터베이스를 기반으로 정렬되어 물리지도(physical map)가 작성되었고, 이후 GBSSNP 기반의 유전지도(genetic map)와 비교하였다. 물리적 거리를 포함하는 국화 유전체 서열과 유전지도의 거리는 대부분 각 LG에서 일치하였다(
Fig. 2).
QTL 탐색을 위해 유전형과 표현형의 통합 데이터를 이용하여 분석을 수행하였다. 국화 F
1 집단에 대해서 총 4개의 화색 관련 QTL을 확인하였다(
Table 3). LG 2에서 확인된
qFC2는 Scaffold_4226_4520486과 Scaffold_4226_4738191 사이에 위치하였고, LOD 임계값은 3.05이었다. LG 7에서는 3개의 QTL이 확인되었다. 그 중
qFC7.1은 Scaffold_296_ 481651543과 Scaffold_296_506440874 사이에 위치하였고, 가장 높은 LOD 임계값(16.60)과 표현형 변이 설명력(phenotypic variance explained, PVE) (24.84%)을 나타내었다. 이외에도
qFC7.2와
qFC7.3은 동일한 Scaffold_486에 위치하였고, LOD 임계값은 각각 10.15와 3.53이 확인되었다. 두 QTL의 PVE는 18.27%과 15.41%로 상가적효과(additive effect)를 나타내었다. LG 7 내 위치한 QTL (
qFC7.1,
qFC7.2,
qFC7.3)들은 모두 15% 이상의 PVE가 나타났으며, 3개의 QTL 모두
C. boreale 대립유전자형에 의해 화색이 감소함을 확인하였다. 따라서 QTL 영역을 토대로 화색을 조절하는 주요 유전자를 효과적으로 탐색할 수 있었다.
국화의 화색 QTL과 연관된 후보 유전자를 스크리닝하기 위해 물리적 거리를 기반으로 유전자의 위치를 확인하였다. 탐색된 4개의 화색 QTL은
A. thaliana와
C. boreale의 유전자들과 BLASTX를 통해 정렬되었고, 총 16종의 후보 유전자들이 3개의 카로티노이드 관련 경로에 의해 분류되었다(
Table 4). 먼저, LG 2의
qFC2에서는 8개의 카로티노이드 관련 유전자가 확인되었다. 이 중 QTL의 95% 신뢰 구간 내에 위치하는 근접 유전자는
CRTISO2와 관련이 있었으며, 이는 국화 꽃잎에서도 카로티노이드 함량을 감소시키는 역할을 하는 것으로 확인되었다(
Kishimoto et al. 2004,
Li et al. 2022). 이외에도 QTL과 근접한 유전자들은 카로티노이드 생합성과 관련된
ZDS,
ZETA-CAROTENE ISOMERASE (
Z-ISO),
CYP97A3와 MEP 경로에 존재하는
HDS, 4-(CYTIDINE 5’ -DIPHOSPHO)-2-C-METHYL-D-ERYTHRITOL KINASE (
CMK),
ISOPENTENYL-PYROPHOSPHATE ISOMERSE (
IPPI)가 포함되어 있었다. 카로티노이드 분해 관련 경로에서는
ABA DEFICIENT 2 (
ABA2)의 단일 유전자가 185,222,821 bp-185,225,804 bp에 위치하였다. LG 7에서는 3개의 카로티노이드 경로에 대해
qFC7.1에서 5개,
qFC7.2에서 2개와
qFC7.3에서 1개의 유전자가 확인되었다.
qFC7.1은 카로티노이드 생합성(
VDE,
LCYB,
LCYE) 및 분해(
CYP707A4,
NINE-CIS-EPOXYCAROTENOID DIOXYGENASE 6 (
NCED6))와 관련된 유전자가 포함되어 있었으나,
FC7.2에서는 MEP 경로 유전자인
HDR와
HDS가 확인되었다.
qFC7.2의 두 유전자는 모두 MEP 경로의 마지막 단계에 존재하는 효소로서, 엽록체와 잡색체에서 합성된 식물 카로티노이드는 대부분 MEP 경로에서 파생된다고 알려져 있다(
Botella-Pavía et al. 2004,
Lichtenthaler 1999). 또한,
qFC7.3은 카로티노이드 분해와 관련된 유전자(
CYP707A2)만 포함되어 있었다. 특히
qFC7.1 및
qFC7.3과 가장 근접한 유전자는
NCED6와
CYP707A2로 확인되었는데 이들은 모두 카로티노이드 축적을 억제하는 요소와 관련이 있을 수 있다는 이전의 가설과 유사하였다(
Kishimoto & Ohmiya 2006). 즉 새로운 T-DNA 삽입 돌연변이체로 알려진
A. thaliana의
cbd (
carotenoid biosynthesis deficient)는 야생형에 비해 엽록소와 총 카로티노이드가 낮게 나타난 반면
NCED와
CYP707A2의 유전자 발현은 증가했다는 결과와 유사하다(
Yu et al. 2012). 국화 외에도 백색과 황색 복숭아(
Prunus persica (L) Batsch)로부터 교배된 F
1세대에서 과육 색상에 따른 카로티노이드 함량의 차이를 확인하였고, 전사체 분석에서 나타난
NCED와
CYP707A2의 하향 조절은 카로티노이드의 축적을 더욱 촉진하여 과육을 노랗게 변화시켰다고 보고되었다(
Song et al. 2022). 이러한 연구를 통하여, 카로티노이드 축적은 카로티노이드의 대사 산물의 함량과 분해 유전자 및 효소(
NCED6,
CYP707A2)의 발현 수준에 의해 조절되며 서로 상관성이 있음을 시사할 수 있다.
탐색된 16개의 후보 유전자에 대한 화색 판별 마커를 개발하기 위해 유전자의 염기서열을 이용하여 부모 간의 다형성을 분석하였다. 설계된 47종의 프라이머를 통해 부모 간의 다형성을 먼저 확인한 뒤, 화색에서 차이를 보이는 16개(노란색 8개, 흰색 8개)의 F
1에 적용하였다. 그 결과,
qFC7.1의
VDE와
CYP707A4, qFC7.3의
CYP707A2 유전자에서 부모 간의 차이가 관찰되었다(
Table 5).
qFC7.1에 위치한
VDE1 유전자에 대해 부모 간의 다형성을 분석하고자, 서로 다른 2개의 프라이머(VDE124, VDE1 (21))를 사용하였고, 각각 646 bp와 724 bp의 크기를 확인할 수 있었다. 2개의 프라이머에서 노란색 표현형을 띄는 8개의 개체 중 ‘CWT2’와 같은 밴드의 크기가 6개, ‘CWT8’과 같은 크기의 밴드가 8개 중 5개로 확인되었으며, 이에 대한 선발 효율은 약 69%이었다(
Figs. 3A,
3B). 이외에도 같은 QTL 영역에 위치하는 카로티노이드 생합성 관련 유전자 중
CYP707A4에 대해서도 부모 간의 다형성이 확인되어 약 69%의 선발 효율(11/16개)을 확인하였고 이를 분자표지로 개발하였다(
Fig. 3C).
qFC7.1 영역에서 위치한 카로티노이드 생합성 관련 유전자인
VDE와
CYP707A4는 화색 유전에 관여하는 유전자임을 확인할 수 있었다.
qFC7.3에 위치한
CYP707A2 유전자의 분리집단을 분석한 결과, 부모의 화색에 따라 8개의 노란색과 8개의 흰색(16/16개)으로 분리되었다(
Fig. 3D). 이들은 부모를 포함한 16 F
1 개체의 화색을 모두 예측할 수 있는 유전자로 판단되었다.
qFC2에 위치한 8개의 카로티노이드 생합성 및 분해 등에 관련된 유전자와
qFC7.2에 위치한 MEP 경로 관련
HDR과
HDS에서는 후보 프라이머들을 이용하여 분석을 시도하였지만 부모 간의 다형성이 검출되지 않아 분자표지로 개발할 수 없었다(
Supplementary Table 2). DNA 기반의 분자표지 개발은 색의 표현형과 연관된 대립유전자를 통해 유전적 차이를 밝혀냄으로써 조기 선발 및 생식 관리를 유용하게 한다(
Cho et al. 2020). 옥수수(
Zea mays L.)에서는 생태지리학적 기원이 다른 54개의 옥수수 유전자형을 수집하여 곡물 내 총 카로티노이드 함량과 대립유전자
PSY1의 유의미한 연관성을 확인하였고, 유전자 스크리닝을 통해
PSY1 InDel1에 대한 다형성 마커를 개발하여 카로티노이드 축적이 높은 유전자형을 식별할 수 있었다(
Orlovskaya et al. 2016). 또한, 토마토(
Solanum lycopersicum)에서 LA4099의 짙은 주황색과 LA3475의 붉은 과색 간의 유전적 변이를 이용하여
LCY-E InDel 마커로 개발하였으며, 이를 F
1 집단에서 적용한 결과 3:1의 분리비(짙은 주황색 66개와 붉은색 28개)를 나타내었다(
Yoo et al. 2017). 이와 같이 작물의 색상은 식물에서 상당한 경제적인 가치가 있는 특성이므로 국화에서도 주요 육종 목표 중 하나이다. 현재까지 국화에서는 화색을 담당하는 유전자와 밀접한 관련이 있는 SNP 마커가 개발되었다(
Sumitomo et al. 2019). 국화 품종 ‘Hechengxinghuo’의 전장 전사체 서열을 통해 simple sequence repeat (SSR) 마커가 개발되었고, 이는 DNA와 cDNA 수준에서 화색이 다른 117개의 품종을 분류할 수 있었다(
Shi et al. 2022). 하지만, 국화 전체 게놈의 불완전한 염기서열과 기존 DNA 분자표지의 한계로 인해 marker MAS는 여전히 어려운 실정이지만, 본 연구에서는 개발한
CYP707A2 마커의 분리집단 활용성을 제안하고자 한다.
본 연구에서는 국화 F1 집단의 QTL 분석을 통해 탐색된 후보 유전자의 서열을 이용하여 화색을 판별할 수 있는 마커를 개발하였다. C. boreale의 유전체 서열에서 탐색된 카로티노이드 관련 화색 유전자 중 VDE, CYP707A4, CYP707A2에는 C. boreale에 대한 대립유전자가 존재한다고 추측할 수 있었으나, 나머지의 후보 유전자들에 대해서는 화색 분리가 나타나지 않았다. 이 결과는 국화의 모든 F1을 유지할 수 없는 공간적 문제와 GBS 분석에 이용된 DNA 분리량 한계 등으로 제한적 검증이 이루어졌지만 QTL이 탐색된 영역에서 개발한 마커들의 화색 선발 마커로 이용될 수 있음을 시사할 수 있다. 본 연구에서 구명한 3개 유전자의 화색 마커 중 CYP707A2 유래 마커가 선발된 노란색(8), 흰색(8) 화색을 100% 예측할 수 있는 마커라서 양친과 분리집단에 대한 발현분석을 수행한다면 CYP707A2 유전자의 효용성을 확대할 수 있으리라 생각한다. 이와 같은 분자마커의 개발은 다양한 국화 계통 개발에서, 유전 초기에 국화 화색을 구별하고 노란색 또는 흰색 꽃 국화를 예측하고 원하지 않는 꽃 색 계통을 제거하고 다른 육종형 질을 집적시킬 수 있는 분자육종의 좋은 마커로 이용할 수 있으리라 기대한다.
적요
화색(花色)은 국화의 시장성을 결정하는 주요 형질 중 하나로, 소비자 선호도와 육종 가치에 중요한 영향을 미친다. 본 연구에서는 국화의 화색과 관련된 유전적 요인을 탐색하고, 이를 기반으로 화색을 판별할 수 있는 유전자 기반의 분자표지를 개발하고자 하였다.
이를 위해, 화색이 다른 두 야생 국화 ‘CWT2’(진한 노란색)와 ‘CWT8’(흰색)을 교배하여 생성된 94개의 F1 집단을 대상으로 genotyping-by-sequencing (GBS) 분석을 수행하였다. 총 79,002개의 SNP을 발굴한 후, 2,548개의 고품질 GBS-SNP 마커를 기반으로 QTL 분석을 수행하였으며, 그 결과 총 4개의 화색 관련 QTL 영역이 확인되었다. 이들 QTL은 모두 카로티노이드 생합성, 카로티노이드 분해 및 methylerythritol phosphate (MEP) 경로와 관련된 16개의 후보 유전자를 포함하고 있었다.
국화의 화색 판별을 위한 분자표지를 개발하기 위해 후보 유전자들의 염기서열을 분석하여 부모와 16개의 F1 개체 간 다형성을 검정하였다. 그 결과, qFC7.1 영역에서 카로티노이드 생합성 관련 유전자 VDE 및 CYP707A4가 16개체 중 11개체에서 분리되어 약 69%의 선발 효율을 보였다. 또한, qFC7.3 영역의 CYP707A2는 부모를 포함한 모든 F1 개체에서 다형성이 확인되어 카로티노이드 분해에 중요한 역할을 하는 유전자임을 시사하였다.
본 연구의 결과는 국화에서 화색을 조절하는 유전적 메커니즘을 이해하는 데 기초 자료를 제공하며, QTL 분석 기반의 유전자 탐색을 통해 국화 화색 관련 주요 유전자를 규명하였다. 또한, 본 연구에서 개발된 유전자 기반 분자표지는 향후 국화 육종에서 marker-assisted selection (MAS)을 활용한 새로운 품종 선발에 기여할 것으로 기대된다.
보충자료
본문의 Supplementary Tables 1, 2는 한국육종학회지 홈페이지에서 확인할 수 있습니다.
사사
본 연구는 농촌진흥청 국립농업과학원의 농업기초기반연구(과제번호: PJ01578001)의 지원으로 수행되었습니다.
Fig. 1Phenotype distribution of flower color in wild chrysanthemum segregation types among 94 F1 population. Flower characteristics and color of ‘CWT2’, ‘CWT8’ and F1 populations (A) The index of flower color was calculated using the 94 F1 populations derived from a cross between ‘CWT2’ (C. boreale (P1), dark yellow) and ‘CWT8’ (C. makinoi (P2), white). (B) The flower color index was classified into three types: white, light yellow, dark yellow.
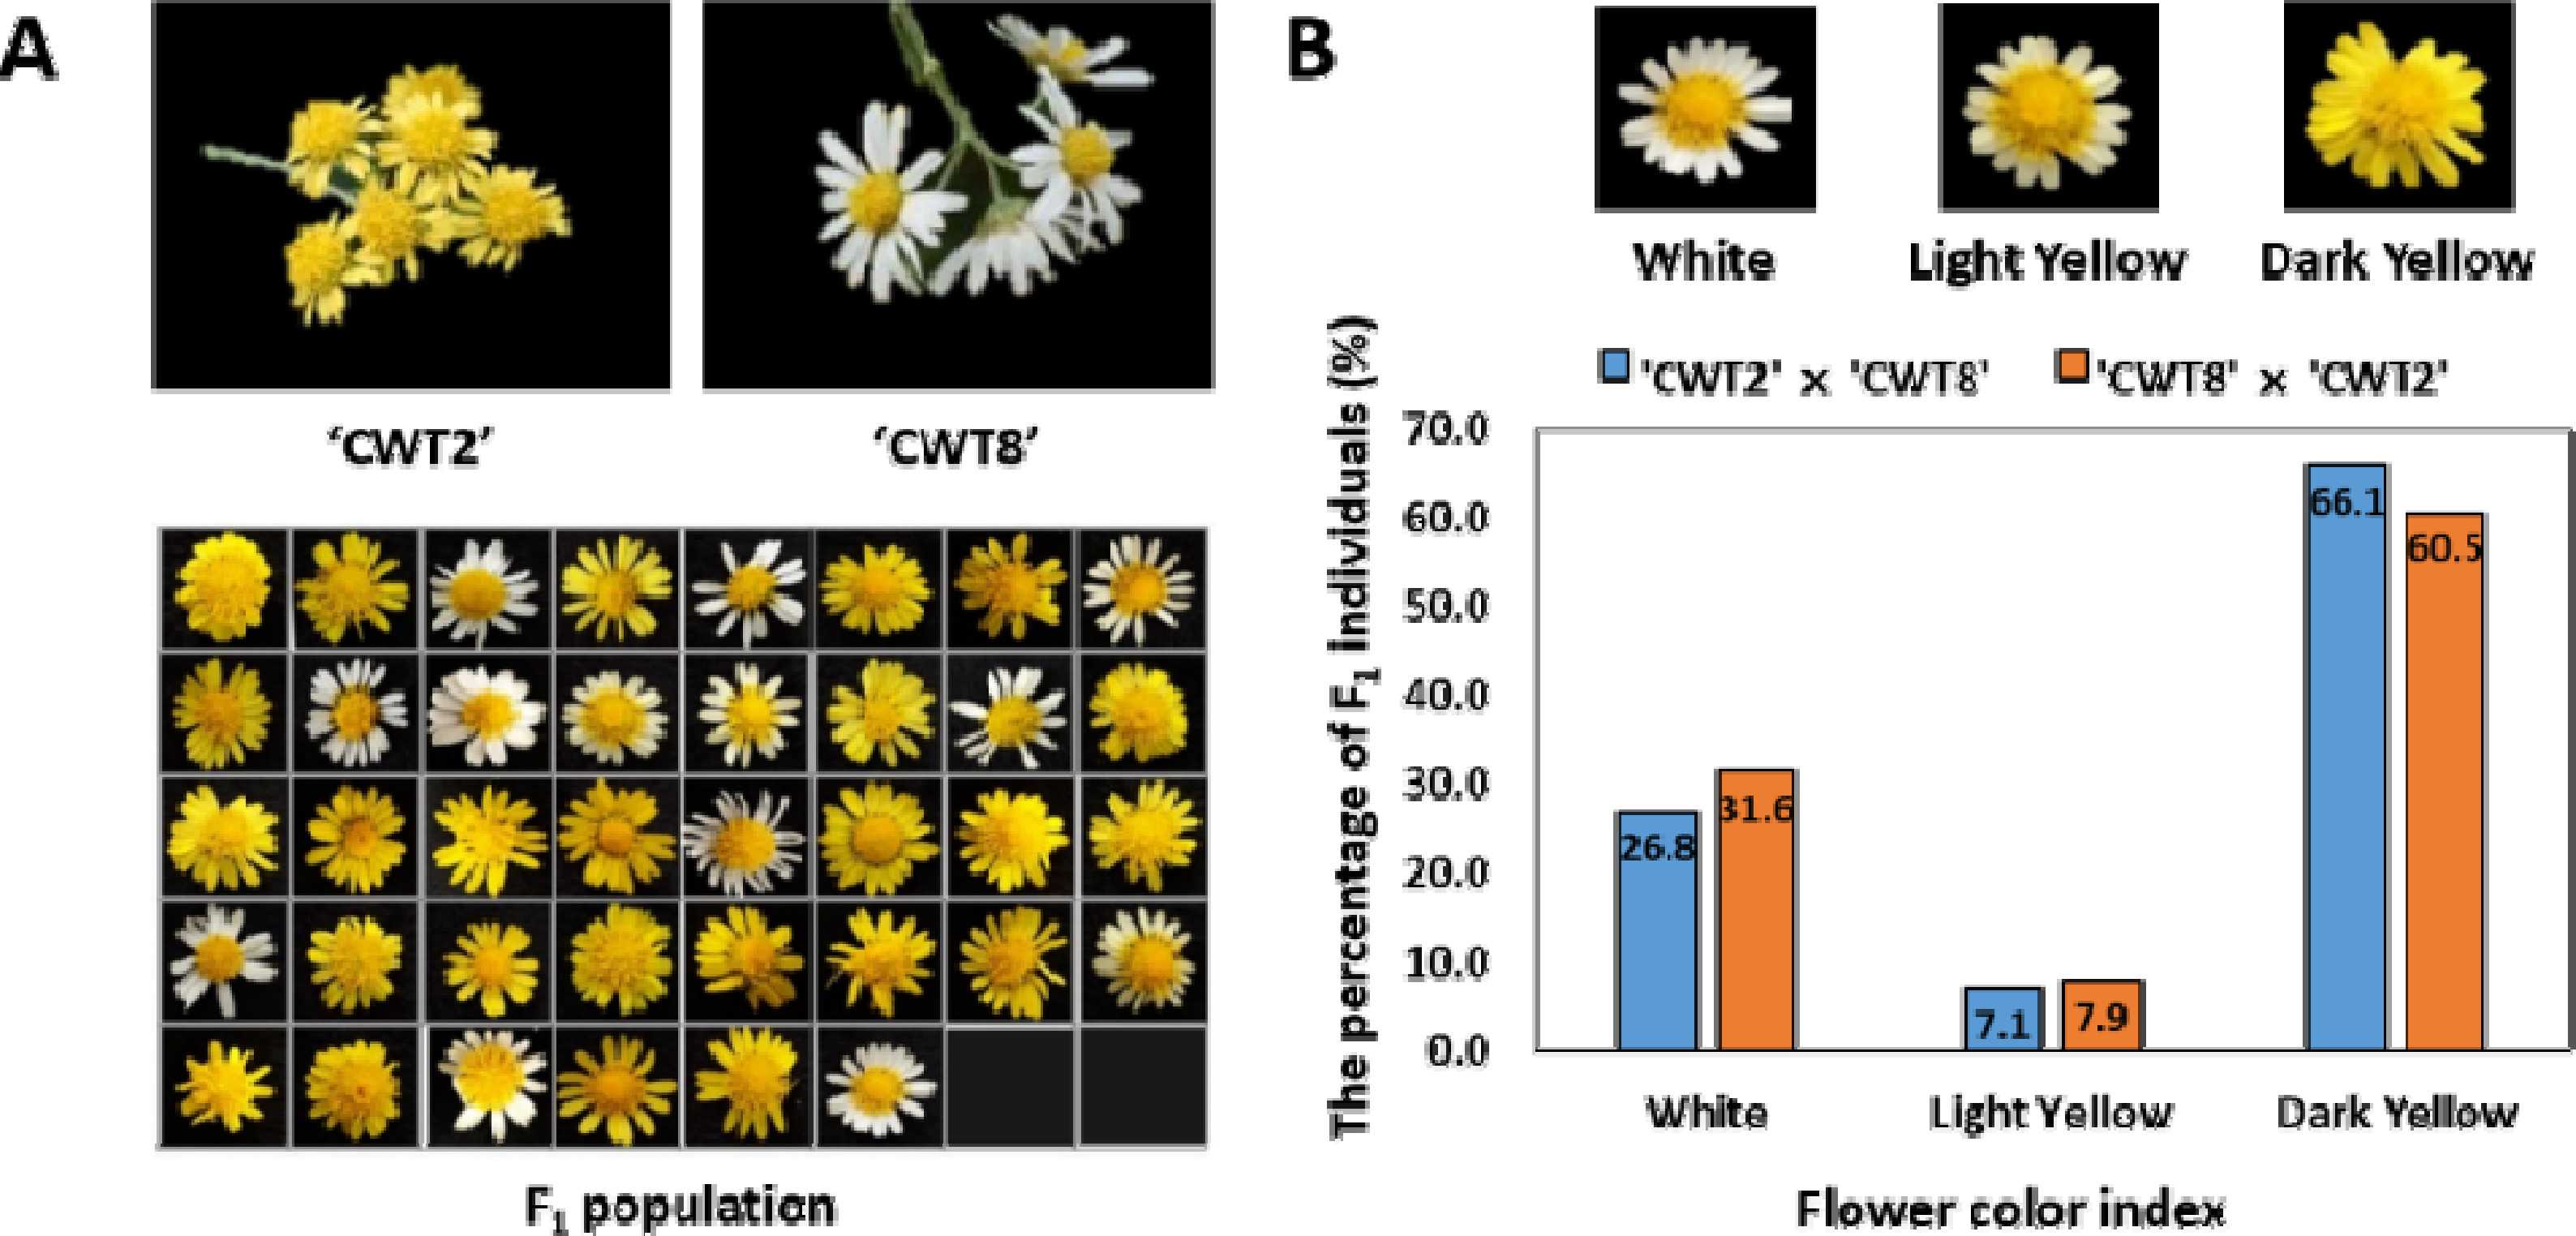
Fig. 2Relationship between physical and genetic map distances based on C. boreale genome. Each dot indicates a SNP marker. The y-axis represents the position of genome distance (Mbp) and the x-axis represents the genetic distance centimorgan (cM).

Fig. 3Validation of marker development using two chrysanthemum parents and 16 F1 genotypes based on three carotenoid genes. Four primers were designed and named as(A) VDE124, (B) VDE1 (21), (C) CYP707A42, (D) CYP707A212. (A) and (B) are related to carotenoid biosynthesis, whereas (C) and (D) are related to carotenoid degradation genes. Star marks indicate the identified target band in the F1 individuals and are classified in ‘CWT2’ (yellow) and ‘CWT8’ (white), depending on parent’s flower color.
Table 1Phenotypic and heritability for flower color in the F1 population derived from the cross two parents.
Table 1
|
Cross combinations |
Total |
Dark yellow+Light yellow |
White |
Ratio |
χ2z
|
|
‘CWT2’בCWT8’ |
56 |
37+4 |
15 |
3:1 |
0.095 (3.841) |
|
‘CWT8’בCWT2’ |
38 |
23+3 |
12 |
3:1 |
0.878 (3.841) |
|
Total |
94 |
60+7 |
27 |
3:1 |
0.695 (3.841) |
Table 2Statistics of GBS analysis for two parents and F1 population.
Table 2
|
GBS analysis |
Sum (bp) |
|
No. of raw reads |
605,292,420 |
|
No. of clean reads after preprocessing |
605,208,239 |
|
No. of mapped reads |
489,741,931 |
|
The percentage of mapped reads |
82.34 |
|
No. of an average mapped reads per sample |
3,180,142 |
|
Max of clean reads per sample |
6,725,546 |
|
Min of clean reads per sample |
1,134,786 |
|
|
SNP calling |
Sum |
|
|
No. of raw variants |
79,002 |
|
No. of raw SNPs |
6,806 |
|
No. of final SNPs |
2,548 |
Table 3QTL analysis of flower color in the chrysanthemum F1 population.
Table 3
|
QTL name |
LGz
|
QTL peaky (cM) |
Marker interval (bp) |
LODx
|
PVEw (%) |
Additive |
Dominance |
|
qFC2
|
2 |
82.0 |
Scaffold_4226_4520486-Scaffold_4226_4738191 |
3.05 |
3.91 |
0.70 |
0.68 |
|
qFC7.1
|
7 |
20.0 |
Scaffold_296_481651543-Scaffold_296_506440874 |
16.60 |
24.84 |
-0.05 |
-1.44 |
|
qFC7.2
|
7 |
132.0 |
Scaffold_486_5126833-Scaffold_486_5126842 |
10.15 |
18.27 |
-0.42 |
-1.54 |
|
qFC7.3
|
7 |
557.0 |
Scaffold_486_147973629-Scaffold_486_148071976 |
3.53 |
15.41 |
-4.76 |
-12.55 |
Table 4Summary information on C. boreale candidate genes near the flower color QTL region.
Table 4
|
QTL name |
LGz
|
No. of genes |
Pathway |
Gene name |
Start (bp) |
End (bp) |
|
qFC2
|
2 |
4 |
Carotenoid biosynthesis |
CRTISO2, ZDS, Z-ISO, CYP97A3
|
36,121,139 |
351,328,509 |
|
3 |
MEP pathway |
HDS, CMK, IPPI
|
151,397,496 |
348,923,085 |
|
1 |
Carotenoid degradation |
ABA2
|
185,222,821 |
185,225,804 |
|
qFC7.1
|
7 |
3 |
Carotenoid biosynthesis |
VDE, LCYB, LCYE
|
68,049,760 |
598.245,284 |
|
2 |
Carotenoid degradation |
CYP707A4, NCED6
|
221,577,571 |
481,791,500 |
|
qFC7.2
|
7 |
2 |
MEP pathway |
HDR, HDS
|
25,567,092 |
95,853,526 |
|
qFC7.3
|
7 |
1 |
Carotenoid degradation |
CYP707A2
|
352,601,453 |
352,607,329 |
Table 5Primer information of the DNA markers related to carotenoid biosynthesis and degradation genes.
Table 5
|
QTL region |
Primer name |
Primers sequence |
Product size (bp) |
|
|
Forward (5’ to 3’) |
Reverse (3’ to 5’) |
|
qFC7.1
|
VDE124 |
TTGGGCTTCCCCCGATTTAC |
GGGTAATCAAGGACGTGGCA |
646 |
|
VDE1(21) |
TTTAAGAGCATCAACAACATCAACC |
AGGATTAGTTGCTTACCGGACTC |
724 |
|
CYP707A42 |
CTACACAAGATTCGCACGCC |
ACAGGGCTGAAGGTCCAATC |
561 |
|
qFC7.3
|
CYP707A212 |
CGCTATGGCACCCATCTCAA |
CGCCCAGTGTCGCTAATGTA |
577 |
References
- 1. Amanullah S, Saroj A, Osae BA, Liu S, Liu H, Gao P, Luan F. 2020. Detection of putative QTL regions associated with ovary traits in melon using SNP-CAPS markers. Sci Hortic 270: 109445.
- 2. Anderson NO. 2006. Chrysanthemum (Dendranthemaⅹgrandiflora Tzvelv). In: Flower breeding and Genetics: Issues, challenges and opportunities for the 21st century. Dordrecht, Springer, Netherlands. pp. 389-437.
- 3. Botella-Pavía P, Besumbes Ó, Phillips MA, Carretero-Paulet L, Boronat A, Rodríguez-Concepción M. 2004. Regulation of carotenoid biosynthesis in plants: evidence for a key role of hydroxymethylbutenyl diphosphate reductase in controlling the supply of plastidial isoprenoid precursors. Plant J 40: 188-199.
- 4. Britton G. 1993. Biosynthesis of carotenoids. In: Carotenoids in photosynthesis. Dordrecht, Springer, Netherlands. pp. 96-126,
- 5. Chen FD, Jiang JF, Guo WM. 2003. Heredity of several flower characters in Dendranthema grandiflorawith small inflorescences. Acta Hort Sin 30: 175-182.
- 6. Cho MC, Kwak JH, Jeong HB, Jang SW, Park SH, Kwon YS, Kim CW, Choi MS, Han JW, Moon JH, Kim DY, Lee SY, Lee OJ, Kim DS, Lee HE, Huh YC, Yang EY. 2020. Overview of Korean vegetable breeding: Past, present and future. Korean J Breed Sci 52(S):112-143.
- 7. Cvejić S, Jocić S, Mladenović E. 2016. Inheritance of floral colour and type in four new inbred lines of ornamental sunflower (Helianthus annuusL.). J Hortic Sci Biotech 91: 30-35.
- 8. Dai SL, Chen JY. 1996. Interspecific hybridization of seven species of Dendranthema. Acta Scent Nat Univ Pekin 18: 16-21.
- 9. Dowrick GJ. 1953. The chromosomes of chrysanthemum, III: Meiosis in C. atratum. Heredity 7: 219-226.
- 10. Elshire RJ, Glaubitz JC, Sun Q, Poland JA, Kawamoto K, Buckler ES, Mitchell SE. 2011. A robust, simple genotyping-by-sequencing (GBS) approach for high diversity species. PLOS ONE 6: e19379.
- 11. Grotewold E. 2006. The genetics and biochemistry of floral pigments. Annu Rev Plant Biol 57: 761-780.
- 12. Ha SH, Jeong YS, Lim SH, Kim JK, Lee D, Lee JY, Kim YM. 2012. Carotenoid metabolic engineering in flowering plants. Kor J Hort Sci Technol 30: 107-122.
- 13. Hasan N, Choudhary S, Naaz N, Sharma N, Laskar RA. 2021. Recent advancements in molecular marker-assisted selection and applications in plant breeding programmes. J Genet Eng Biotechnol 19: 128
- 14. Hattori K. 1991. Inheritance of carotenoid pigmentation in flower color of chrysanthemum. Jpn J Breed 41: 1-9.
- 15. Heo MS, Han K, Kwon JK, Kang BC. 2017. Development of SNP markers using genotyping-by-sequencing for cultivar identification in rose (Rosa hybrida). Horticult Environ Biotechnol 58: 292-302.
- 16. Kim KH, Jung JU, Kang CS, Shin SH, Park JC, Son JH, Park CS. 2014. Mapping of QTL for pre-harvest sprouting resistance and seed dormancy in a doubled haploid population. Plant Breed Biotech 2: 247-256.
- 17. Kishimoto S, Maoka T, Nakayama M, Ohmiya A. 2004. Carotenoid composition in petals of chrysanthemum (Dendranthema grandiflorum (Ramat.) Kitamura). Phytochemistry 65: 2781-2787.
- 18. Kishimoto S, Ohmiya A. 2006. Regulation of carotenoid biosynthesis in petals and leaves of chrysanthemum (Chrysanthemum morifolium). Physiol Plant 128: 436-447.
- 19. Kosambi DD. 1943. The estimation of map distances from recombination values. Ann Eugen 12: 172-175.
- 20. Langton FA. 1980. Chimerical structure and carotenoid inheritance in Chrysanthemum morifolium(Ramat.). Euphytica 29: 807-812.
- 21. Lee YJ, Hyung NI, Kim TH. 2020. High-resolution bin maps provide insights for QTL mapping of yield-related traits with Milyang23/Gihobyeo recombinant inbred lines. Plant Breed Biotech 8: 293-306.
- 22. Li H, Yu K, Amoo O, Yu Y, Guo M, Deng S, Li M, Hu L, Wang J, Fang C, Zhou Y. 2022. Site-directed mutagenesis of the carotenoid isomerase gene BnaCRTISOalters the color of petals and leaves in Brassica napusL. Front Plant Sci 13: 801456.
- 23. Li L, Roos DS. Stoeckert CJJr2003. OrthoMCL: identification of ortholog groups for eukaryotic genomes. Genome Res 13: 2178-2189.
- 24. Lichtenthaler HK. 1999. The 1-deoxy-D-xylulose-5-phosphate pathway of isoprenoid biosynthesis in plants. Annu Rev Plant Biol 50: 47-65.
- 25. Lu S, Li L. 2008. Carotenoid metabolism: biosynthesis, regulation, and beyond. J Integr Plant Physiol 50: 778-785.
- 26. Margarido GR, Souza AP, Garcia AAF. 2007. OneMap: software for genetic mapping in outcrossing species. Hereditas 144: 78-79.
- 27. Meng L, Li H, Zhang L, Wang J. 2015. QTL IciMapping: Integrated software for genetic linkage map construction and quantitative trait locus mapping in biparental populations. Crop J 3: 269-283.
- 28. Ministry of Agriculture Food.Rural Affairs in Korea.Korea Agricultural Statistics Service (KASS).2023. https://kass. mafra.go.kr/.
- 29. Nisar N, Shan LL, Lu S, Khin NC, Pogson BJ. 2015. Carotenoid metabolism in plants. Mol Plant 8: 68-82.
- 30. Orlovskaya OA, Vakula SI, Khotyleva LV, Kilchevsky AV. 2016. Assotiation of total carotenoid level in maize grain (Zea mays L.) with polimorphic site InDel1 in PSY1 gene. Ecol Genet Physiol 14: 28-34.
- 31. R Core Team.2020. R: A language and environment for statistical computing. R Foundation for Statistical Computing..
- 32. Ruiz-Sola MA, Rodríguez-Concepción M. 2012. Carotenoid biosynthesis in Arabidopsis : A colorful pathway. Arab Book 10: e0158.
- 33. Shi Z, Zhao W, Li Z, Kang D, Ai P, Ding H, Wang Z. 2022. Development and validation of SSR markers related to flower color based on full-length transcriptome sequencing in Chrysanthemum. Sci Rep 12: 22310
- 34. Song H, Liu J, Chen C, Zhang Y, Tang W, Yang W, Chen H, Li M, Jiang G, Sun S, Li J, Tu M, Wang L, Xu Z, Gong R, Chen D. 2022. Down-regulation of NCED leads to the accumulation of carotenoids in the flesh of F1 generation of peach hybrid. Front Plant Sci 13: 1055779.
- 35. Song X, Xu Y, Gao K, Fan G, Zhang F, Deng C, Dai S, Huang H, Xin H, Li Y. 2020. High-density genetic map construction and identification of loci controlling flower-type traits in Chrysanthemum (Chrysanthemum×morifoliumRamat.). Hortic Res 7: 108
- 36. Sumitomo K, Shirasawa K, Isobe S, Hirakawa H, Hisamatsu T, Nakano Y, Yagi M, Ohmiya A. 2019. Genome-wide association study overcomes the genome complexity in autohexaploid chrysanthemum and tags SNP markers onto the flower color genes. Sci Rep 9: 13947
- 37. Teixeira da Silva JA, Shinoyama H, Aida R, Matsushita Y, Raj SK, Chen F. 2013. Chrysanthemum biotechnology: Quo vadis? Crit Rev Plant Sci 32: 21-52.
- 38. Vílchez C, Forján E, Cuaresma M, Bédmar F, Garbayo I, Vega JM. 2011. Marine carotenoids: biological functions and commercial applications. Mar Drugs 9: 319-333.
- 39. Wang F, Zhang FJ, Chen FD, Fang WM, Teng NJ. 2014. Identification of chrysanthemum (Chrysanthemum morifolium) self-incompatibility. Sci World J 2014: 625658.
- 40. Yagi M. 2014. Identification of tightly linked SSR markers for flower type in carnation (Dianthus caryophyllus L.). Euphytica 198: 175-183.
- 41. Yang X, Su J, Qu Y, Jiang J, Guan Z, Fang W, Chen F, Zhang F. 2023. Dissecting the inheritance pattern of the anemone flower type and tubular floral traits of chrysanthemum in segregating F1 populations. Euphytica 219: 16
- 42. Yoo HJ, Park WJ, Lee GM, Oh CS, Yeam I, Won DC, Kim CK, Lee IM. 2017. Inferring the genetic determinants of fruit colors in tomato by carotenoid profiling. Molecules 22: 764
- 43. Yu B, Gruber MY, Khachatourians GG, Zhou R, Epp DJ, Hegedus DD, Parkin IA, Welsch R, Hannoufa A. 2012. Arabidopsis cpSRP54 regulates carotenoid accumulation in Arabidopsis and Brassica napus. J Exp Bot 63: 5189-5202.
- 44. Yuan H, Zhang J, Nageswaran D, Li L. 2015. Carotenoid metabolism and regulation in horticultural crops. Hortic Res 2: 15036
- 45. Zhang F, Chen S, Chen F, Fang W, Deng Y, Chang Q, Liu P. 2011. Genetic analysis and associated SRAP markers for flowering traits of chrysanthemum (Chrysanthemum morifolium). Euphytica 177: 15-24.
- 46. Zhao D, Tao J. 2015. Recent advances on the development and regulation of flower color in ornamental plants. Front Plant Sci 6: 261
- 47. Zhao D, Wu S, Dai X, Su Y, Dai S, Zhang A, Zhou Z, Tang J, Cao Q. 2021. QTL analysis of root diameter in a wild diploid relative of sweetpotato (Ipomoea batatas(L.) Lam.) using a SNP-based genetic linkage map generated by genotyping-by-sequencing. Genet Resour Crop Evol 68: 1375-1388.